The Daily Trader
- 지표
-
Remi Passanello
 Hello,
In the past 15 years, I was robot builder and code developer for heavy industry.
I started manual trading from the year 2012 and then I now use my knowledge to develop EA on MT4 and MT5.
R. - 버전: 1.0
- 활성화: 20
데일리 트레이더
이 표시기는 RPTrade Pro 솔루션 시스템의 일부입니다.
Daily Trader는 통계만을 사용하는 일일 지표입니다.
누구나 사용할 수 있도록 설계되었으며 거래의 절대 초보자도 사용할 수 있습니다.
다시 칠하지 마십시오.
표시는 닫기에서 닫기로 제공됩니다.
단독으로 사용하도록 설계되어 다른 표시기가 필요하지 않습니다.
명확하고 간단한 표시를 제공합니다.
어떻게 작동합니까
통계 시스템은 이력을 분석하여 기호 동작에서 중복성을 찾습니다.
거래는 하나씩 표시되며 동시에 두 거래가 없습니다.
IT는 다음을 나타냅니다.
거래를 할 때
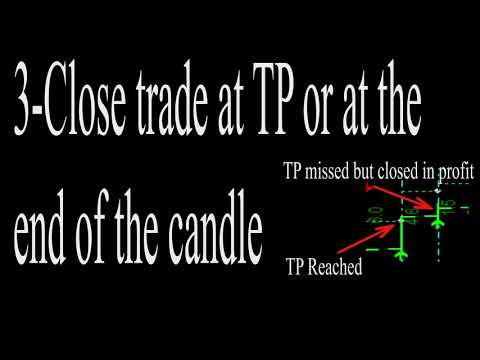
이익실현을 어디에 둘 것인가
앞으로 24시간 동안 어떤 거래를 해야 할까요?
공장
FX 쌍, 지수, 금속, 선물 또는 기타와 같은 모든 상품.
H1에만
모든 중개인과 함께. (낮은 스프레드는 더 많은 핍을 남깁니다)
특징
신뢰할 수 있는 매수/매도 신호.
매우 간단한 입력.
온스크린 알림 + 푸시 알림 + 이메일 알림
모든 알림은 매우 상세하며 또한 이익 실현을 제공하여 모바일 장치에서 거래할 수 있습니다.
올바른 설정을 찾는 데 도움이 되는 수익 차트
설정은 일일 거래를 활성화/비활성화하여 차트에서 직접 조정됩니다.
이것을 어떻게 사용 하는가 ?
차트에 올리기만 하면 됩니다.
표시를 따르기만 하면 됩니다.
입력
UsePush: [Bool] true는 푸시 알림을 보냅니다.
UseMail: [Bool] true는 메일을 보냅니다.
기간 2: [정수] 지표의 기간. 1에서 ..... 더 낮은 값 = 더 많은 다중 거래
계산 기간: [객관식] 지표의 계산 기간을 결정합니다.
이력 시작 날짜: [DateTime]지표 계산을 시작할 날짜를 설정합니다.
Raw TP 나누기: [Double] 이익실현 분배기를 설정합니다. 1은 나누지 않고 2는 TP를 2로 나눕니다.