• 概述
  • 评论
  • 评论

MurreyVVB

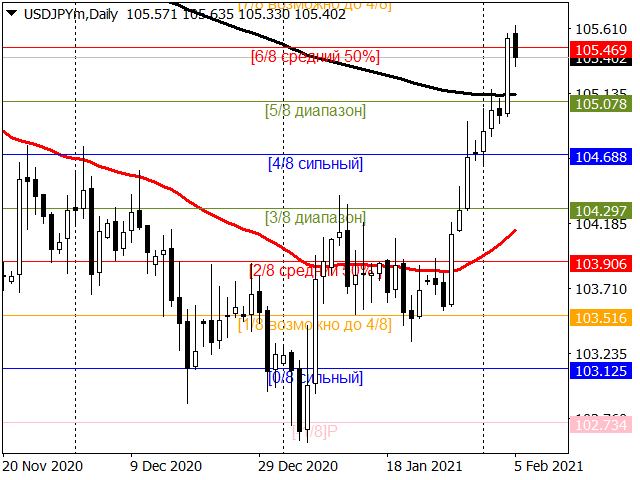
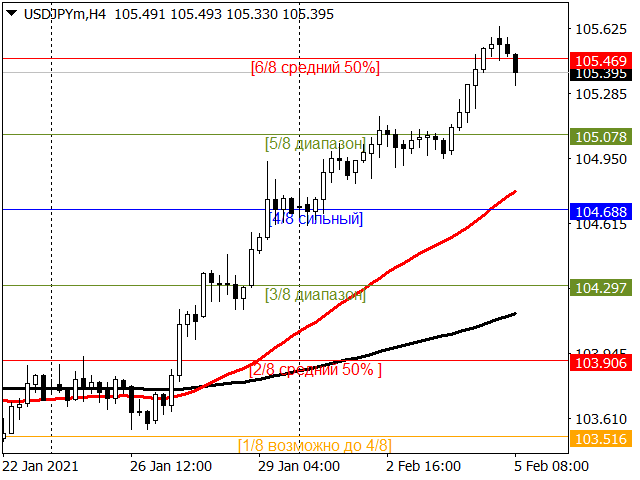
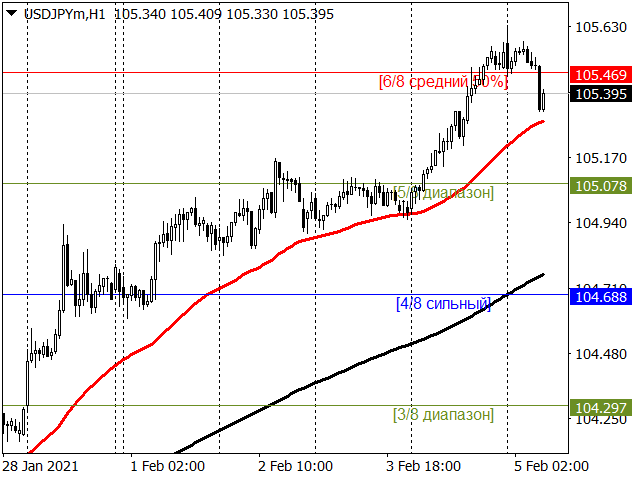
The indicator accurately displays support and resistance levels. Visualizes important strong levels and average strength levels on the chart.

It is important that the indicator does not redraw depending on the time frame change.

The indicator can be used for any form of trading, scalping, mid-range trading.. on any currency pair.

For medium-term trading, we recommend using the default parameters.

All parameters in the indicator are configurable. The indicator lines are displayed in the main price window.
推荐产品
ZigZag on average
Valeriy Medvedev
This is a well-known ZigZag indicator. But it differs by the fact that its plot is based on values of the middle line which is set by a user. It can display Andrews’ Pitchfork and standard or Bobokus Fibo levels. NO REPAINTING. Parameters Period МА — middle line period. Default value is 34. Minimum value is 4. Maximum value is set at your discretion. Used to calculate price - base price to calculate the middle line. The averaging method - method of smoothing the middle line. Turning pitchfork
“可调分形” - 是分形指标的高级版本,非常有用的交易工具! 据我们所知,标准分形 mt4 指标根本没有设置 - 这对交易者来说非常不方便 可调整分形已经解决了这个问题 - 它具有所有必要的设置: 指标可调周期(建议值-7以上) 距价格高点/低点的可调距离 可调节设计 af 分形箭头 ............................................................................................................. // 这里提供更多优秀的 EA 交易和指标: https://www.mql5.com/en/users/def1380/seller 它是仅在该 MQL5 网站上提供的原创产品。
Dynamic Levels
Svyatoslav Kucher
Dynamic Levels is a channel indicator of dynamic levels, designed for identification of the price extremums. It allows increasing the efficiency of any strategy due to advanced parameters, which in turn allow customizing it for personal trading style. Dynamic Levels does not change its values, it is suitable for any timeframe and currency pair. Indicator Parameters ChannelPeriod - period for the indicator calculation. ChannelSmoot - smoothing of values. ATRPeriod - volatility calculation perio
Veles ZigZag X
Gennady Mazur
Очень точный индикатор, с  его помощью очень легко определять барные паттерны. Это очередная разновидность ЗигЗага, за исключением, он не рисует текущую линию, которая может перерисоваться,если нарисовал конечную точку, по закрытому бару, то больше ее не изменяет - это означает смену направления и следующая точка будет другого цвета. Может быть применен как для определения основного движения, при использовании увеличенных параметров, так и непосредственно для входа с минимальным риском. Очень
The indicator detects and displays 3 Drives harmonic pattern (see the screenshot). The pattern is plotted by the extreme values of the ZigZag indicator (included in the resources, no need to install). After detecting the pattern, the indicator notifies of that by a pop-up window, a mobile notification and an email. The indicator highlights the process of the pattern formation and not just the complete pattern. In the former case, it is displayed in the contour triangles. After the pattern is com
Trend Ray
Andriy Sydoruk
The indicator shows the potential trend direction by cyclical-wave dependence. Thus, all the rays of the intersection will be optimal rays, in the direction of which the price is expected to move, taking into account the indicator period. Rays can be used as a direction for potential market movement. But we must not forget that the approach must be comprehensive, the indicator signals require additional information to enter the market.
The indicator detects and displays Shark harmonic pattern (see the screenshot). The pattern is plotted by the extreme values of the ZigZag indicator (included in the resources, no need to install). After detecting the pattern, the indicator notifies of that by a pop-up window, a mobile notification and an email. The indicator highlights the process of the pattern formation and not just the complete pattern. In the former case, it is displayed in the contour triangles. After the pattern is comple
PZ Penta O MT4
PZ TRADING SLU
The Penta-O is a 6-point retracement harmonacci pattern which usually precedes big market movements. Penta-O patterns can expand and repaint quite a bit. To make things easier this indicator implements a twist: it waits for a donchian breakout in the right direction before signaling the trade. The end result is an otherwise repainting indicator with a very reliable trading signal. The donchian breakout period is entered as an input. [ Installation Guide | Update Guide | Troubleshooting | FAQ | A
Interactive BB Matrix
Tsvetan Tsvetanov
2 (1)
This indicator displays Bollinger Bands signals for multiple symbols and multiple time frames. The signals are created as a simple ratios which represent the distance between the current price and the moving average measured in standard deviations. This way we create a very versatile and easy to use indicator which helps us to identify not only the strongest trends but also the most overbought and oversold conditions. Features Accurate signals in real time for multiple time frames and multiple
交易实用必备工具指标 波浪自动计算指标,通道趋势交易 完美的趋势-波浪自动计算通道计算 , MT4版本 完美的趋势-波浪自动计算通道计算 , MT5版本 本地跟单复制交易 Easy And Fast Copy , MT4版本 Easy And Fast Copy , MT5版本 本地跟单复制交易 模拟试用 Easy And Fast Copy , MT4 模拟账号运行 Easy And Fast Copy , MT5 模拟账号运行 顺势指标又叫CCI指标,CCI指标是 美国 股市 技术分析   家唐纳德·蓝伯特(Donald Lambert)于20世纪80年代提出的,专门测量股价、外汇或者贵 金属 交易是否已超出常态分布范围。属于超买超卖类指标中较特殊的一种。波动于正无穷大和负无穷大之间。但是,又不需要以0为中轴线,这一点也和波动于正无穷大和负无穷大的指标不同。 相对强弱指标RSI是根据一定时期内上涨点数和下跌点数之和的比率制作出的一种技术曲线。能够反映出市场在一定时期内的景气程度。由威尔斯.威尔德(Welles Wilder)最早应用于期货买卖,后来人们发现在众多的图表技术分析中,
FREE
描述: 该指标通过之字形指标衡量趋势或修正水平。 它在图表中显示了检测到的每个低或高电平。 该指标有何用处? 该指标根据之字形参数确定趋势是开始,发展还是结束 该指标确定趋势的方向 组件 水平为正数或负数,取决于趋势的方向和回撤的数量。 其他建议指标 CEF计数水平旨在通过以下指标来工作和补充其信号: 一般指标 选择最佳货币进行交易(CEF点差货币点差) 趋势指标 确定趋势级别(CEF计数级别)(实际指标) 确定趋势强度(CEF趋势力) 信号工具 完整的策略信号指示器(CEF Scalper Pro) 查找订单块模式(CEF订单块信号) 查找市场市场格局(CEF TDI Pro信号) 其他非常有用的工具 确定范围扩展或收缩的概率(CEF范围预测器)
FREE
Divergence Osw Metatrader 4
William Oswaldo Mayorga Urduy
分散OSW(對於Metatrader 4) 該指標適用於差異,並具有以下功能: 發生差異時生成警報。 通過根據逆波的投影波計算止損和止盈來創建線。 創建一個箭頭,指示市場的可能方向。 蠟燭結束時會發出指示器發出的信號。 交易者必須評估每個差異以進行輸入。 設定值: 激活和停用警報。 警報間隔。 隱藏TP和SL線。 隱藏市場方向箭頭。 買賣信號色。 (如果線條看起來不太好,請轉到另一種臨時性並返回相同的臨時性) 分散OSW(對於Metatrader 4) 該指標適用於差異,並具有以下功能: 發生差異時生成警報。 通過根據逆波的投影波計算止損和止盈來創建線。 創建一個箭頭,指示市場的可能方向。 蠟燭結束時會發出指示器發出的信號。 交易者必須評估每個差異以進行輸入。 設定值: 激活和停用警報。 警報間隔。 隱藏TP和SL線。 隱藏市場方向箭頭。 買賣信號色。 (如果線條看起來不太好,請轉到另一種臨時性並返回相同的臨時性)
Actual Levels
Ilya Fomin
4 (1)
The indicator shows significant support and resistance levels. When the price approaches these levels, it in some way responds either to the levels themselves, or to the areas that are near these levels. These levels can be viewed as potential reversal zone. Accordingly, the levels can be used for performing trading operations or closing previously opened positions. For example You can buy if the price rolls back from the support level upwards, or sell if the price rolls back from the resistan
KT Horizontal Lines MT4
KEENBASE SOFTWARE SOLUTIONS
In MetaTrader, plotting multiple   horizontal lines   and then tracking their respective price levels can be a hassle. This indicator automatically plots multiple horizontal lines at equal intervals for setting price alerts, plotting support and resistance levels, and other manual purposes. This indicator is suitable for Forex traders who are new and looking for chances to make quick profits from buying and selling. Horizontal lines can help traders find possible areas to start trading when the
Citizens
Maryna Shulzhenko
One of the main definitions for monitoring the currency market is a trend, which is why the Citizen indicator was created in order to display the trend in a visual form. You should use the indicator as an additional indicator, that is, you need to use this indicator for example to perfectly display price movements! Its signals are based on a reliable algorithm. When used simultaneously on multiple timeframes, this indicator truly "makes the trend your friend". With it, you can follow trends on m
Trend Scanner
Vladimir Kalendzhyan
4.33 (6)
By purchasing this indicator, you have the right to receive a free copy of one of   my other indicator's or advisor’s!  (All future updates are included. No limits) . To get it , please contact me by  mql5 message ! The Trend Scanner trend line indicator displays the trend direction and its changes. The indicator works on all currency pairs and  timeframes. The indicator simultaneously displays multiple readings on the price chart: the support and resistance lines of the currency pair, the exist
ATTrendindexV
You Er Ling Mu
It is a judgment tool that judges trends in 1 minute and supports discretionary trading. Various usages 1. It is used to recognize the environmental advantage of buying or selling with the color of the line. If the line is red, it is advantageous to buy. If it is blue, it is advantageous to sell. Neither if there is no line. 2. Used as a guide for entry by signing the entry.  Red arrow long Blue arrow short 3.Used as a guide for closing (Even if there is no entry sign, the close point will be
Wolfe Wave Scanner
Jalitha K Johny
5 (1)
Wolfe Waves scanner - It scans all the Symbols and identify the movement of price and it gives confidence in trade. It automatically plots  fifth wave breaks out of the channel. According to the theory behind the pattern, a line drawn from the point at the beginning of the first wave and passing through the beginning of the fourth wave predicts a target price for the end of the fifth wave. If a trader properly identifies a Wolfe Wave as it forms, the beginning of the fifth wave represents an op
MT4 外汇指标“支撑阻力位” “支撑阻力位”指标是非常有用的交易辅助指标 “支撑”和“阻力”是图表上受价格影响的重要区域 支撑位是价格经常停止下跌并反弹的地方 阻力位是价格通常停止上涨并回落的位置 “支撑阻力位”指标显示最近的水平: 阻力位 - 红线。 支撑位 - 蓝线 用于计算的条数、线型和颜色可以在设置中调整 “支撑阻力位”指标非常适合通过价格行为模式来规划您的止盈目标、价格反转和重新测试。 ............................................................................................................. // 这里提供更多优秀的 EA 交易和指标: https://www.mql5.com/en/users/def1380/seller 它是仅在该 MQL5 网站上提供的原创产品。
Description The base of this indicator is an ZigZag algorithm based on ATR and Fibo retracement. The ZigZag can be drawn like a classic ZigZag or like Arrows or needn't be drawn at all. This indicator is not redrawing in sense that the ZigZag's last shoulder is formed right after the appropriate conditions occur on the market. The shoulder doesn't change its direction afterwards (can only continue). There are some other possibilities to show advanced information in this indicator: Auto Fibo on
Power Trend
Yurij Kozhevnikov
Power Trend Paid - the indicator shows the trend strength in the selected period. Input Parameters The indicator has the following input parameters: Main Line - an optional function for drawing a line on the values used for indicator calculation (not available in the free version ). Period - a positive number greater than one, it shows the number of candlesticks used for calculations. If you enter one or zero, there will be no error, but the indicator will not be drawn. Applied Price - an exte
Discrete Line AM
Andriy Matviyevs'kyy
The presented indicator allows you to visualize the direction of the trend while cutting off minor price fluctuations. The indicator's customizable parameter (Filter) determines the number of points for the current financial instrument that the indicator cuts off in the process of determining the trend. Despite its simplicity, the indicator can be useful for both beginners and experienced traders. The indicator marks trend reversal points and can send notifications of such signals to the termina
Trend Moment
Maryna Shulzhenko
Using the Trend Moment indicator, you can find not only overbought and oversold zones, but also be able to identify the strongest reversals of the current trend. This will take your trading to a whole new level. Forget about slipping in oscillators, be it Stochastic or RSI or any other oscillator. Trend Moment signals 100% do not redraw and do not require adjusting the parameters - the indicator will work equally well on any chart, even with default parameters.
这是一个 MTF 指标,它基于 带有价格标签的 Advanced ZigZag Dynamic 和/或 Extended Fractals 指标极值(可以禁用)。可以为 MTF 模式选择更多更高的 TF。默认情况下,级别是基于 ZigZag 指标点生成的。分形指标点也可以与 ZigZag 一起使用或代替它。为了简化使用并节省 CPU 时间,每根柱线在开盘时执行一次计算。 参数: ForcedTF - 水平计算的图表时间范围(可能等于或超过当前时间) MinPipsLevelWidth   - 以点为单位的最小关卡宽度(用于非常紧凑的关卡) Use ZigZag Extremums points - 启用/禁用使用 ZigZag 峰值计算支撑/阻力水平 Fixed pips range - 计算 ZigZag 指标的最小值和最大值之间的距离 UseDynamicRange   - 启用/禁用 ZigZag 指标最小值和最大值之间距离的动态计算 Dynamic volatility period - 用于计算 ZigZag 指标最小值和最大值之间的动态距离的波动期 Dynamic vola
Pips ZigZag
Stanislav Aksenov
The well-known ZigZag indicator that draws rays based on the “significant movement” specified by the pips parameter. If a ray appears, it will not disappear (the indicator is not redrawn), only its extremum will be updated until the opposite ray appears. You also can display text labels on each rays describing the width of the ray in bars and the length of the ray in points.
True Magic Oscillator
Muhammed Emin Ugur
The   True Magic Oscillator   indicator is designed for signal trading. This indicator generates trend signals. It uses many algorithms and indicators to generate this signal. It tries to generate signals from the points with the highest trend potential. This indicator is a complete trading product. This indicator does not need any additional indicators. The indicator is never repainted. The point at which the signal is given does not change.         Features and Recommendations Wor
Super Reversal Pattern
Parfait Mujinga Ndalika
Super Reversal Pattern Indicator Unlock the power of advanced pattern recognition with our Super Reversal Pattern Indicator. Designed for traders seeking precision and reliability, this indicator identifies one of the most effective reversal patterns in technical analysis, offering a significant edge in your trading strategy. Key Features: Non-Repainting Accuracy: Enjoy the confidence of non-repainting technology. Once a Super Reversal Pattern is detected, it remains static, providing consis
Trend Bilio
Ivan Simonika
Trend Bilio - an arrow indicator without redrawing shows potential market entry points in the form of arrows of the corresponding color: upward red arrows suggest opening a buy, green down arrows - selling. The entrance is supposed to be at the next bar after the pointer. The arrow indicator Trend Bilio visually "unloads" the price chart and saves time for analysis: no signal - no deal, if an opposite signal appears, then the current deal should be closed. It is Trend Bilio that is considered
KDJ Index 4   交易实用必备工具指标 波浪自动计算指标,通道趋势交易 完美的趋势-波浪自动计算通道计算 , MT4版本 完美的趋势-波浪自动计算通道计算 , MT5版本 本地跟单复制交易 Easy And Fast Copy , MT4版本 Easy And Fast Copy , MT5版本 本地跟单复制交易 模拟试用 Easy And Fast Copy , MT4 模拟账号运行 Easy And Fast Copy , MT5 模拟账号运行 "Cooperative QQ:556024  "  "Cooperation wechat:556024"  "Cooperative email:556024@qq.com" 强烈推荐趋势指标, 波浪的标准自动计算   和   波浪的标准自动计算MT5版本     KDJ指标又叫 随机指标 ,是一种相当新颖、实用的技术分析指标,它起先用于期货市场的分析,后被广泛用于股市的中短期趋势分析,是期货和股票市场上最常用的技术分析工具。 随机指标KDJ一般是用于股票分析的统计体系,根据统计学原理,通过一个特定的周期(常为9日、9周等
UPD1 X00 Levels
Vitaliy Kuznetsov
5 (7)
该指标在图表上显示圆形水平。 它们也被称为心理、银行或主要参与者级别。 在这些水平上,多头和空头之间存在真正的斗争,许多订单的积累导致波动性增加。 该指标会自动调整到任何工具和时间范围。 当80水平被突破然后测试时,我们买入。当20级被突破然后测试时,我们卖出。目标是00。 注意力。由于强大的支撑   。   和阻力位,价格可能略低于 00 水平。 输入参数   。 Bars Count - 线条长度(以条为单位) 。 Show 00 Levels - 显示或不显示 00 级   。 Show 10, 90 Levels   。 Show 20, 80 Levels   。 Show 30, 70 Levels   。 Show 40, 60 Levels   。 Show 50 Levels   。 N Lines - 限制图表上级别数的参数   。 Distance 00 Levels - 层间距离(自动或手动) 。 Line Position - 图形前面或后面的线   。 Visual Button - 按钮显示(启用/禁用)   。 Corner - 按钮锚定角
FREE
该产品的买家也购买
Gann Made Easy
Oleg Rodin
4.85 (82)
Gann Made Easy 是一个专业且易于使用的外汇交易系统,它基于使用先生理论的最佳交易原则。 W.D.江恩。该指标提供准确的买入和卖出信号,包括止损和获利水平。您甚至可以使用推送通知在旅途中进行交易。 购买后请联系我!我将免费与您分享我的交易技巧和丰厚的红利指标! 您可能已经多次听说过江恩交易方法。通常 Gann 的理论不仅对于新手交易者而且对于那些已经有一定交易经验的人来说都是非常复杂的东西。这是因为江恩的交易方法在理论上并不那么容易应用。我花了几年时间来完善这些知识,并将最好的原则应用到我的外汇指标中。 该指标非常易于应用。您所需要的只是将其附加到您的图表并遵循简单的交易建议。该指标不断进行市场分析工作并寻找交易机会。当它检测到一个好的入口点时,它会为您提供一个箭头信号。该指标还显示止损和获利水平。 换句话说,当您像先生一样进行交易时,该指标会为您提供最佳江恩建议。江恩亲自告诉你此时此刻该做什么。但最好的部分是您不需要了解任何有关江恩交易原则的知识,因为该指标会为您完成整个市场分析工作。
TPSpro RFI Levels
Roman Podpora
4.82 (22)
Atomic Analyst
Issam Kassas
5 (2)
首先值得强调的是,该交易指标是非重绘、非延迟的指标,这使其成为手动和机器人交易的理想选择。 用户手册:设置、输入和策略。 Atomic Analyst是一种PA价格行动指标,利用价格的力量和动量来寻找市场上更好的机会。配备了高级过滤器,可帮助去除噪音和假信号,并提高交易潜力。使用多层复杂的指标,Atomic Analyst扫描图表,并将复杂的数学计算转化为任何初学者都能理解并用来做出一致交易决策的简单信号和颜色。 “Atomic Analyst”是专为新手和经验丰富的交易者量身定制的综合交易解决方案。它将高级指标和一流功能融合为一体的交易策略,使其成为所有类型交易者的多功能选择。 日内交易和剥头皮策略:专为快速准确的日内交易和短期交易而设计。 日内和摆动交易策略:可用作追求价格大幅波动的日内和摆动交易者的可靠工具。 多货币和市场:凭借其可靠的精度,在不同的工具和市场上运作。 多个时间框架:可在多个时间框架上使用,性能良好。 稳定性:所有指标均不重绘、不重绘和不滞后,确保可靠的信号。 信号清晰度:提供箭头信号,用于清晰的入场和出场点。 实时警报:通过交易入场、SL和TP警报通知交
Gold Stuff
Vasiliy Strukov
4.89 (238)
Gold Stuff 是专为黄金设计的趋势指标,也可用于任何金融工具。 该指标不会重绘,也不会滞后。 推荐时间框架 H1。 在它指标工作全自动专家顾问 EA Gold Stuff。 你可以在我的个人资料中找到它。 重要! 购买后立即与我联系,以获得说明和奖金!   您可以免费收到我们的强力支持和趋势扫描指标的副本,请私信。大部头书! 购买后立即联系我以获得设置和个人奖励!   设置 绘制箭头 - 打开关闭。 在图表上绘制箭头。 警报 - 打开关闭声音警报。 电子邮件通知 - 打开关闭。 电子邮件通知。 Puch-notification - 打开关闭。 推送通知。 接下来,调整色域。 Gold Stuff 是专为黄金设计的趋势指标,也可用于任何金融工具。 该指标不会重绘,也不会滞后。 推荐时间框架 H1。 在它指标工作全自动专家顾问 EA Gold Stuff。 你可以在我的个人资料中找到它。 购买后立即联系我以获得设置和个人奖励!   设置 绘制箭头 - 打开关闭。 在图表上绘制箭头。 警报 - 打开关闭声音警报。 电子邮件通知 - 打开关闭。 电子邮件通
Trend Punch
Mohamed Hassan
4.95 (19)
This indicator is unstoppable when combined with our other indicator called  Support & Resistance . After purchase, send us a message and you will get it   for  FREE as a BONUS! Introducing Trend Punch , the revolutionary forex trend indicator that will transform the way you trade! Trend Punch is uniquely designed to provide precise buy and sell arrows during strong market trends, making your trading decisions clearer and more confident. Whether you're trading major currency pairs or exotic sym
TPSproTREND PrO
Roman Podpora
4.79 (19)
TPSpro TREND PRO 是一个趋势指标,可以自动分析市场并提供有关趋势及其每次变化的信息,并给出进入交易的信号而无需重新绘制! 该指标使用每根蜡烛,分别对其进行分析。指不同的脉冲——向上或向下脉冲。货币、加密货币、金属、股票、指数交易的准确切入点! MT5版本                 指标的完整描述   我们建议将其与 指示器 -   RFI LEVELS 一起使用 主要功能: 准确的输入信号,无需渲染! 如果出现信号,它仍然相关!这是与重提指标的一个重要区别,重提指标可以提供信号然后改变信号,这可能导致存款资金的损失。现在您可以以更高的概率和准确度进入市场。还有一个功能是在箭头出现后为蜡烛着色,直到达到目标(止盈)或出现反转信号。 显示止损/获利区域 为了提高搜索切入点时的视觉清晰度,创建了一个模块,该模块最初显示买入/卖出区域,在该区域中搜索进入市场的最佳点。用于处理止损水平的附加智能逻辑有助于随着时间的推移减小其大小,从而降低进入交易(移动 sl)时的初始风险。 显示较高时间范围内的最小值/最大值(MTF 模式) 添加了一项功能,可以显示较高时间间隔的最小
Scalper Inside PRO
Alexey Minkov
4.73 (56)
An exclusive indicator that utilizes an innovative algorithm to swiftly and accurately determine the market trend. The indicator automatically calculates opening, closing, and profit levels, providing detailed trading statistics. With these features, you can choose the most appropriate trading instrument for the current market conditions. Additionally, you can easily integrate your own arrow indicators into Scalper Inside Pro to quickly evaluate their statistics and profitability. Scalper Inside
FX Power MT4 NG
Daniel Stein
5 (12)
通过 mql5 和 Telegram 上 的晨间简报获取每日市场更新,包括详细信息和屏幕截图 ! FX Power MT4 NG 是我们长期以来非常受欢迎的货币强度计算器 FX Power 的下一代产品。 这款下一代强度计算器能提供什么?您所喜爱的原版 FX Power 的所有功能 附加功能 黄金/XAU 强度分析 更精确的计算结果 可单独配置的分析周期 可自定义计算限制,以获得更好的性能 为希望查看更多信息的用户提供特殊的多实例设置 无尽的图形设置,可在每个图表中设置您最喜欢的颜色 无数的通知选项,让您再也不会错过任何重要信息 采用 Windows 11 和 macOS 风格的全新圆角设计 神奇的移动指标面板 FX Power 主要功能 所有主要货币的完整强势历史 所有时间框架内的货币强弱历史 所有经纪商和图表的计算结果完全相同 100% 可靠的实时计算 -> 无重绘 可通过下拉列表选择分析时段 通过自定义模式单独配置分析时段 可在一个图表中使用多个实例 可移动 FX Power 显示屏(通过拖放) 适用于高分辨率 QHD、UHD 和 4K 显示器 自动终端配置 针对平板电脑
Trend Screener
STE S.S.COMPANY
4.8 (87)
趋势指标,趋势交易和过滤的突破性独特解决方案,所有重要趋势功能都内置在一个工具中! 它是 100% 非重绘多时间框架和多货币指标,可用于所有符号/工具:外汇、商品、加密货币、指数、股票。 限时优惠:支撑和阻力筛选指标仅售 50美元,终身有效。(原价 250 美元)(优惠延长) 趋势筛选器是有效的指标趋势跟踪指标,它在图表中提供带有点的箭头趋势信号。 趋势分析器指标中可用的功能: 1.趋势扫描仪。 2. 具有最大利润分析的趋势线。 3.趋势货币强度计。 4. 带有警报的趋势反转点。 5. 带有警报的强趋势点。 6. 趋势箭头 每日分析示例,每日信号表现...等与我们的趋势筛选指标,可以在这里找到: 点击这里 限时优惠:Trend Screener Indicator 仅售 50 美元且终身可用。原价 125$) 通过访问我们的 MQL5 博客,您可以找到我们所有的高级指标以及分析示例、每日信号表现...等。 : 点击这里 我们的趋势系统由 2 个指标组成: 1. Trend Screener Indicator:显示趋势仪表盘、图表中的趋势线、入场点...等。 2.
目前八折优惠! 对任何新手或专家交易者来说都是最好的解决方案! 这个仪表板软件适用于28种货币对。它基于我们的两个主要指标(高级货币强度28和高级货币冲动)。它对整个外汇市场提供了一个伟大的概述。它显示高级货币强度值,货币运动速度和28个外汇对在所有(9)时间段的信号。想象一下,当你可以使用图表上的单一指标观察整个市场,以确定趋势和或剥头皮的机会时,你的交易将得到改善 我们已经在这个指标中建立了一些功能,使你更容易识别强势和弱势货币,同时识别和确认潜在的交易。该指标以图形方式显示货币的强势或弱势是增加还是减少,以及它在所有时间段的表现。 增加的新功能是动态市场斐波那契水平,它适应当前的市场条件变化,这是一个已经在我们的高级货币强度28和高级货币冲动指标中使用的成熟的加分项。 在交易时,总是将弱势货币和强势货币配对,这个新指标将帮助你做到这一点。 用户手册:点击这里  https://www.mql5.com/en/blogs/post/708783 特点  显示每个时间段的ACS28和GAP-speed(冲动)的货币强度值。 列:颜色代码以7种颜色
FX Volume
Daniel Stein
4.58 (33)
通过 mql5 和 Telegram 上 的 " 晨间简报 "获取每日市场更新,包括详细信息和屏幕截图 ! 外汇交易量(FX Volume)是第一个也是唯一一个从经纪商角度真正洞察市场情绪的交易量指标。 直接在您的图表上看到这些信息是真正改变游戏规则和突破性的交易解决方案。 受益于独特的市场数据洞察,如 比率(Ratios )显示货币多头和空头头寸的比率(百分比 比率变化 显示所选时间段内的多头比率及其百分比变化 总交易量 显示货币的总交易量(多头和空头),以手为单位 多头 交易量显示货币所有多头头寸的交易量 空头 交易量显示所有货币空头头寸的交易量 净多头 显示净多头交易量,即所有多头头寸减去所有空头头寸(以手为单位)。 净多头百分比 显示货币净多头交易量的变化 请阅读我们的基本教程 -> "如何使用外汇交易量进行交易 " 获取更多信息,如常见问题、交易技巧和教程视频,请访问我们的 外汇交易量公共信息频道 请 安装并运行 SI Connect 以建立与我们数据中心的持续连接 背景信息 我们都知道,外汇是一个分散的市场。这就是为什么我们必须打破常规思维,开发一个独
Advanced Currency IMPULSE with ALERT
Bernhard Schweigert
4.9 (480)
目前31%的折扣!! 对任何新手或专家交易者来说都是最好的解决方案! 这个指标是一个独特的、高质量的、负担得起的交易工具,因为我们已经纳入了一些专有的功能和一个秘密的公式。只需一张图表,它就能给出所有28种货币对的警报。想象一下,你的交易将如何改善,因为你能够准确地确定新趋势或剥头皮机会的触发点 建立在新的基础算法上,它使识别和确认潜在交易变得更加容易。这是因为它以图形方式显示了一种货币的强势或弱势是否正在加速,并测量了这种加速的速度--把它想象成你汽车中的速度表。当你加速时,事情显然会发生得更快,这在外汇市场上也是一样的,即如果你配对的货币正在向相反的方向加速,你就会发现一个潜在的有利可图的交易。 货币动量的垂直线和箭头将指导你的交易! 动态的市场斐波那契23水平被用作警报触发器,将适应市场活动。如果冲动触及黄色触发线,您将在MetaTrader或您的电子邮件或推送警报中收到警报。然后你就知道作为一个交易员应该做什么。货币对和方向已经给出。只要点击警报按钮,就可以切换到该货币对或打开一个新的图表,以便进一步分析。警报级别可以通过用户输入来改变,可以选择3个敏感度级别
Enigmera
Ivan Stefanov
5 (3)
ENIGMERA:市场核心 https://www.enigmera.com 简介 该指标和交易系统是金融市场的一种非凡方法。ENIGMERA 利用分形周期精确计算支撑位和阻力位。它能显示真实的累积阶段,并给出方向和目标。 该系统无论在趋势中还是在修正中都能发挥作用。 它是如何运行的? ENIGMERA 由三条线组成:支撑/阻力线、目标线和偏离线。与一般市场指标将过去的数据推断为现在和未来的情况不同,该系统能提供当前的完整情况。如果你处于支撑位,这意味着真正的支撑;如果你处于阻力位,这意味着真正的阻力。如果突破某一水平,则表示趋势发生变化。没有重绘。 由于市场在不断变化,ENIGMERA 不断调整其评估工具,定期修改策略。  这保证了每种情况都能得到全面评估。这一市场指标的独特性显而易见,其能力不言而喻。  ENIGMERA 为金融分析师和咨询师提供服务,他们需要可靠的见解与客户分享,也为投资者提供服务,他们需要最精确和最可靠的保证。 该系统能够达到最佳精度,使交易者能够自信、清晰地评估他们的选择。 ENIGMERA 将 20 年的交易专长和知识整合到一个综合软件
- Real price is 80$ - 40% Discount ( It is 49$ now ) Contact me for instruction, add group and any questions! Related EA Product: Bitcoin Expert Introduction The breakout and retest strategy is traded support and resistance levels. it involves price breaking through a previous level.  The break and retest strategy is designed to help traders do two main things, the first is to avoid false breakouts. Many false breakouts start with a candlestick that breaks out of a level but ends with an immedi
Chart Patterns All in One
Davit Beridze
4.25 (8)
Chart Patterns All-in-One 指标帮助交易者可视化技术分析中常用的各种图表形态。它帮助识别潜在的市场行为,但不保证盈利。建议在购买前在模拟模式下测试该指标。 当前优惠 : “Chart Patterns All in One” 指标享受 50% 折扣。 包含的形态 : 1-2-3 形态 :通过三个关键点(高点或低点)检测市场反转。 买入 :连续两个低点后出现较低的高点。 卖出 :连续两个高点后出现较高的低点。 可视化 :线条和箭头连接识别的点。 双顶和双底 :当价格形成两个连续的高点(双顶)或低点(双底)且它们大致相等时,表明反转趋势。 双顶 :看跌反转。 双底 :看涨反转。 可视化 :线条连接峰值或低谷,箭头标记反转点。 三顶和三底 :与双顶/双底类似,但有三个连续的高点或低点,信号更强的反转趋势。 三顶 :看跌反转。 三底 :看涨反转。 可视化 :线条和箭头标记形态。 三角形 :在趋势延续前识别整合期(基于 Zig-Zag,有时可能会延迟出现或消失)。 上升三角形 :看涨延续。 下降三角形 :看跌延续。 可视化 :在图表上绘制三角形,并用箭头标记突破点。 尽管
Advanced Currency Strength28 Indicator
Bernhard Schweigert
4.9 (649)
目前26%的折扣 任何新手或专家交易者的最佳解决方案! 这个指标是一个独特的、高质量的、可负担得起的交易工具,因为我们纳入了一些专有的功能和一个新的公式。只需一个图表,你就可以读出28个外汇对的货币强度!想象一下,你的交易将如何得到改善,因为你的交易是在你的手中进行的。想象一下,你的交易将如何改善,因为你能够准确地确定新趋势或剥头皮机会的触发点? 用户手册:点击这里  https://www.mql5.com/en/blogs/post/697384 这是第一本,原版的! 不要买一个毫无价值的崇拜者的克隆品。 特别的 子窗口中的箭头显示强劲的货币势头GAP将指导你的交易! 当基础货币或报价货币处于超卖/超买区域(外盘斐波那契水平)时,在个人图表的主窗口中出现警告信号。 当货币力量从外围区间回落时,回撤/反转警报。 十字星模式的特别警报 可选择多个时间框架,以快速查看趋势! 货币强度线在所有的时间框架中都非常平稳,当使用较高的时间框架来识别总体趋势,然后使用较短的时间框架来确定精确的入口时,效果非常好。你可以根据自己的意愿选择任何时间框架。每个时间框架都由其自身进
Market Reversal Alerts
LEE SAMSON
4.19 (113)
成為突破者,隨著價格反轉,市場結構會改變利潤。 訂單突破者指示器可以識別趨勢或價格走勢何時接近枯竭並準備好逆轉。它會提醒您市場結構的變化,通常會在發生逆轉或重大回調時發生。 該指標使用專有計算來確定突破和價格動能。每當在可能的耗盡點附近形成新的高點時,指標就會繪製最後一個生成該高點的順序塊。然後,它將隨價格移動隨價格跟隨定單。然後,當價格轉向相反方向並突破該訂單塊時,它會提醒您,從而創建新的市場結構並開始趨勢或重大回調的可能逆轉。 訂單塊是在創建高/低之前的最後一個相反的彩色蠟燭,並且當價格跌破這些關鍵區域以下時,這表明趨勢可能會發生短期或長期反轉。 特徵 提醒您關鍵耗盡點的市場結構變化 價格接近耗盡水平時自動提取訂單塊 在一個方向繼續移動時,在價格後面跟踪定單,以提醒您最佳的反轉輸入 將顏色更改為純色塊,以顯示何時發生市場結構中斷。 適用於所有交易品種和時間範圍 內置集成的彈出窗口和電子郵件警報 策略和如何與定單破壞者指標進行交易 當斷路器塊發生時,您有兩個選擇。 看左邊!我們正在尋求供應/需求或支撐/阻力位嗎?市場結構轉變(逆轉)通常發生在價格重新測試舊水平或
Bomb Bank Signal
Igor Pereira Calil
5 (1)
炸彈銀行訊號:您對 MetaTrader 4 的信心指標 Bomb Bank Signal 是 MetaTrader 4 的一個強大指標,旨在識別金融市場中最相關的趨勢。如果您正在尋找一種能夠準確預測運動的工具,那麼炸彈庫就是您需要的盟友。 運作原理: 該指標結合了三種不同的方法——成交量分析、蠟燭收盤價和對稱趨勢——來偵測和發出買賣機會訊號。當炸彈銀行識別出買入機會時,它就像一顆「炸彈」;當它偵測到賣出訊號時,它就像一個「頭骨」。 為什麼炸彈銀行不一樣? 完全可靠性:炸彈庫訊號不會刪除訊號。訊號一旦發出,就會一直存在,確保您不會錯過任何機會。 極為準確:炸彈庫不會發出錯誤訊號。它會即時更新您的訊息,隨著市場的變化進行調整,但保持先前訊號的透明度。 即時更新:訊號被即時識別並在必要時更新,使您能夠快速響應市場變化。 最大化您的結果: 炸彈銀行訊號是識別趨勢持續走勢的理想選擇。例如,如果您已經做空並且指標在 M15 發出買入訊號,那麼現在就是平倉或部分下單的最佳時機,反之亦然。 此外,經過仔細分析,我們建議您遵循M30、H1和H4上的訊號,停損僅50點。這使
Trend Cutter
Oleg Rodin
5 (2)
Trend Cutter 是一种趋势指标,可用于任何时间范围,包括 M1 和 M5 等较低时间范围。该指标对于喜欢日内交易的交易者来说是理想的选择,并且对那些喜欢长期交易的交易者也有帮助。您可以使用该指标作为您的交易系统的基础或作为独立的交易解决方案。 该指标提供所有类型的警报,包括推送通知。 指标中有一个易于使用的输入参数,可让您按照您希望的方式调整信号。此选项将为您提供交易的灵活性。 您也可以在任何您想要的市场进行交易。 该指标非常容易使用。您只需遵循信号即可。我还将免费向该指标的所有用户提供附加指标,这将帮助您尽可能高效地使用该方法。 购买后请联系我以获得我的交易提示和丰厚奖金! 感谢您的关注! 祝您交易顺利、盈利!
TakePropips Donchian Trend Pro
Eric John Pajarillaga Aldana
4.44 (16)
TakePropips Donchian Trend Pro   (MT4) 是一款功能强大且有效的工具,可使用 Donchian 通道自动检测趋势方向,并为您提供进场和退场交易信号! 这个多功能指标包括趋势扫描器、交易信号、统计面板、筛选器、交易时段和警报历史仪表板。它旨在为您提供交易信号并节省您分析图表的时间! 您可以在我们的博文中下载用户手册和安装指南:   https   :// www.mql5.com/en/blogs/post/751368 今天立减 50%!价格从 98 美元降到 49 美元! 您可以在 Strategy Tester 上测试该指标(启用可视模式) 视频教程也可在说明下方获得更多详细信息。 如果您有任何问题或需要任何帮助,请与我联系。 TakePropips Donchian Trend Pro 指标适用于所有外汇对、金属、商品、指数和加密货币。 主要特点 交易信号 - 检测多个时间范围内所有货币对的买卖机会。它将为您提供警报并在图表上绘制交易信号,最多 3 个止盈价和一个止损价。 Trend Scanner   - 用于快速扫描和识别跨多个时间
IX Power MT4
Daniel Stein
5 (5)
IX Power 终于将 FX Power 的无与伦比的精确性带到了非外汇交易符号中。 它能准确判断您喜爱的指数、股票、商品、ETF 甚至加密货币的短期、中期和长期趋势强度。 您可以 分析 终端提供的 一切 。试试吧,体验一下您在交易时如何把握 时机 。 IX Power 主要功能 100% 精确的非重绘计算结果 - 适用于您终端中的所有交易符号 下拉式选择预配置以及可单独配置的强度分析周期 通过电子邮件、消息和手机通知的无数种通知选项 可访问的 EA 请求缓冲区 可自定义计算限制,以获得更好的性能 为希望查看更多信息的用户提供特殊的多实例设置 无尽的图形设置,让您在每个图表中都能找到最喜欢的颜色 采用 Windows 11 和 macOS 风格的圆角新面板设计 神奇的移动指标面板,可在子窗口和主图表之间无缝移动 适用于高分辨率 QHD、UHD 和 4K 显示器,并针对平板电脑和触摸屏进行了优化 IX Power 参数 最重要的参数不言自明,但我们很快会在另一篇文章中为您提供所有 IX Power 参数的完整说明。 使用别名 "参数可为技术交易
Stratos Pali
Michela Russo
Stratos Pali Indicator   is a revolutionary tool designed to enhance your trading strategy by accurately identifying market trends. This sophisticated indicator uses a unique algorithm to generate a complete histogram, which records when the trend is Long or Short. When a trend reversal occurs, an arrow appears, indicating the new direction of the trend. Important Information Revealed Leave a review and contact me via mql5 message to receive My Top 5 set files for Stratos Pali at no cost! D
Gold Channel XAUUSD
Paulo Rocha
5 (2)
Gold Channel is a volatility-based indicator, developed with a specific timing algorithm for the XAUUSD pair, which consists of finding possible corrections in the market. This indicator shows two outer lines, an inner line (retracement line) and an arrow sign, where the theory of the channel is to help identify overbought and oversold conditions in the market. The market price will generally fall between the boundaries of the channel. If prices touch or move outside the channel it is a tra
Advanced Supply Demand
Bernhard Schweigert
4.91 (294)
现在优惠 33%! 任何新手或专业交易者的最佳解决方案! 该指标是一款独特、高质量、且价格合理的交易工具,因为我们已经整合了许多专有功能和新公式。 依据此更新,您将能够显示双重时间帧区域。 您不仅可以显示一个较高的时间帧,还可以同时显示图表时间帧,加上更高的时间帧:显示嵌套时区。 供需双方所有交易者都会喜欢它。 :) 重要信息披露 高级供需的最大潜力,请访问 https://www.mql5.com/zh/blogs/post/720245   想象您的交易如何得以改善,是因为您能够精准定位入场或目标位吗? 构建于新的底层算法,它可以更轻松地识别出买卖双方之间的潜在失衡。 这是因为它以图形方式展示供需最强劲区域,及其过去的表现(显示旧区域)。 这些功能旨在帮助您更轻松地发现最佳入场区域和价位。 现在您可以针对您的交易品种和时间帧来优化和编辑区域强度! 高级供需指标适用于所有产品和时间帧。 它是一个新的公式,非常新的功能是两个区域强度函数可由用户输入进行调整! 这在交易中是一大优势。 当您学习如何使用专有功能,例如带有价格游离最小 X 因子的区域强度时,您能够判断该区域强劲与否。 供
自动在你的图表上画出支撑位和阻力位以及推动性蜡烛缺口,这样你就可以看到价格接下来可能会走向哪里和/或可能会逆转。 该指标旨在作为我的网站(The Market Structure Trader)上教授的头寸交易方法的一部分,并显示目标和潜在入场的关键信息。 该指标有两个核心功能和四个附加功能: 核心功能1 - 日线、周线和月线的自动支持和阻力线 该指标为你自动绘制过去2天以及6周和数月前的最新支撑和阻力水平。你可以完全自定义这些水平的外观以适合你,并显示多少个。这些关键水平通常作为主要的支持和阻力区,价格将从这里转向并回撤或逆转。它们也是价格将走向的目标,因此你可以迅速看到在价格可能转向之前交易的潜在距离。 核心特征2--推进型蜡烛缺口目标 推进性缺口蜡烛是银行和机构通过在任何市场上执行大额头寸而创造的强劲、快速的移动。这些大阳线一旦形成,有两个关键作用。 1. 1.它们作为一个方向性信号,因为大型市场参与者已经选择了一个方向,一旦发生,价格往往会在一段时间内继续移动。 2. 2.更重要的是,它们作为目标,因为这些区域往往会让其他大玩家的头寸 "越位",价格在绝大
Currency Strength Wizard
Oleg Rodin
4.93 (44)
货币强度向导是一个非常强大的指标,为您提供成功交易的一体化解决方案。该指标使用多个时间范围内所有货币的数据来计算这个或那个外汇对的力量。此数据以易于使用的货币指数和货币电力线的形式表示,您可以使用它们来查看这种或那种货币的力量。 您所需要的只是将指标附加到您要交易的图表上,该指标将向您显示您交易的货币的真实强度。该指标还向您显示买卖量压力的极值,您可以在顺势交易时利用这些压力。该指标还显示了基于斐波那契的可能目标。该指标可用于各种交易时间范围。该指标支持各种货币对的交易。 该指标为您提供所有类型的警报,包括推送通知。 购买后请联系我。我将与您分享我的交易技巧,并免费为您提供丰厚的红利指标! 祝您交易愉快,获利丰厚!
Order Block Hunter
Noha Mohamed Fathy Younes Badr
5 (4)
Order block hunter indicator is the best indicator for  hunt the order blocks that area where there has been a large concentration of limit orders waiting to be executed Order blocks are identified on a chart by observing previous price action and looking for areas where the price experienced significant movement or sudden changes in direction .This indicator does that for you by using very complicated codes and helps you to take the best areas To buy and sell because it make marks at the best a
此儀表板是與市場結構反轉指標一起使用的警報工具。它的主要目的是提醒您在特定時間範圍內的逆轉機會,以及像指標一樣重新測試警報(確認)。儀表板設計為單獨放置在圖表上,並在後台工作,以向您發送有關您選擇的貨幣對和時間範圍的警報。它是在許多人要求衝刺以同時監控多個貨幣對和時間框架而不是讓市場反轉指標在一個 MT4 中的多個圖表上運行之後開發的。它會在 M5、M15、M30、H1、H4 和 D1 時間範圍內發出警報。當然,與交易中的任何事情一樣,更高的時間框架效果最好。 該儀表板被設計為市場結構反轉指標的附加組件。它將獨立工作,並提醒市場反轉警報指標給出的模式和信號。 在此處獲取市場反轉警報指標: https://www.mql5.com/en/market/product/46295 此儀表板的 MT5 版本可在此處獲得: https://www.mql5.com/en/market/product/65828 此處提供 EA:汽車交易市場反轉警報! https://www.mql5.com/en/market/product/65383 我創建的用於繪製矩形並提醒特定貨幣對的市
PRO Renko System
Oleg Rodin
5 (25)
PRO Renko Arrow Based System for trading renko charts.  准确的信号交易任何外汇工具. 另外,我将免费提供系统的附加模块! PRO Renko系统是RENKO图表上高度准确的交易系统。该系统是通用的。 该交易系统可应用于各种交易工具。 该系统有效地中和了所谓的市场噪音,打开了获得准确反转信号的通道。 该指标易于使用,只有一个参数负责产生信号。 您可以很容易地使算法适应您感兴趣的交易工具和renko酒吧的大小。 我很乐意通过提供任何咨询支持来帮助所有客户有效地使用该指标。 祝您交易成功!购买后,立即写信给我! 我将与您分享我的建议和我的renko发电机。 另外,我将免费提供系统的附加模块!
Trend Pulse
Mohamed Hassan
5 (4)
Please contact me after purchase to immediately get your PDF strategy + documentation for Trend Pulse !  Introducing Trend Pulse , a unique and robust indicator capable of detecting bullish, bearish, and even ranging trends! Trend Pulse uses a special algorithm to filter out market noise with real precision. If the current symbol is moving sideways, Trend Pulse will send you a ranging signal, letting you know that it's not a good time to enter a trade. This excellent system makes Trend Pulse
作者的更多信息
ShowHammer
Viacheslav Bychkov
The indicator is useful for experienced traders and beginners. Displays the HAMMER candle pattern. Simultaneously scans H1, H4, D1 and displays the corresponding alert on the screen, accompanied by an audible signal. The alert displays information about the timeframe of the pattern and the trading symbol on which the pattern appeared. Only you can make a decision about entering the market based on the pattern. Since it is better to enter the market from the support and resistance levels,
筛选:
无评论
回复评论