Swaps Indicator
- 指标
- 版本: 1.0

The Swaps Indicator allows to monitor the swap rates of desired instruments in one place. There are several ways to choose the instruments list for the indicator:
- Select instruments from Market Watch
- Select all instruments
- Select instruments from the manually adjusted list
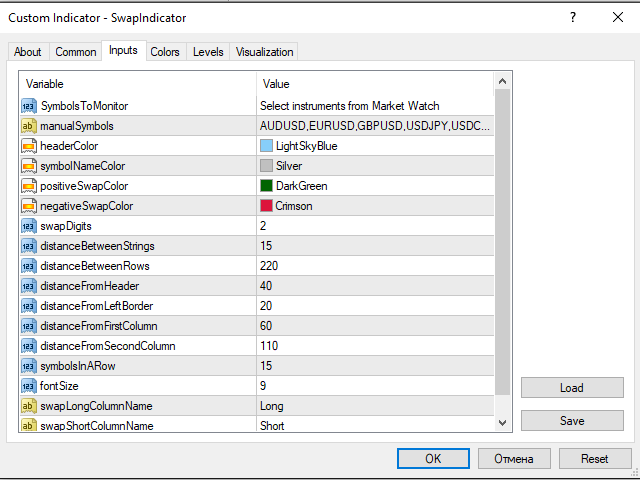
All the setings color settings are adjustable in the indicator: you can set color for headers, for symbol names, for positive and negative swaps. There is also an ability to adjust the distance between the rows, columns and strings so you can place the strings as you want. You can also adjust the number of instruments per column and change the borders of the indicator so it will be possible to either increase or decrease the displayed information. Font size for the entries and column names are changeable as well.
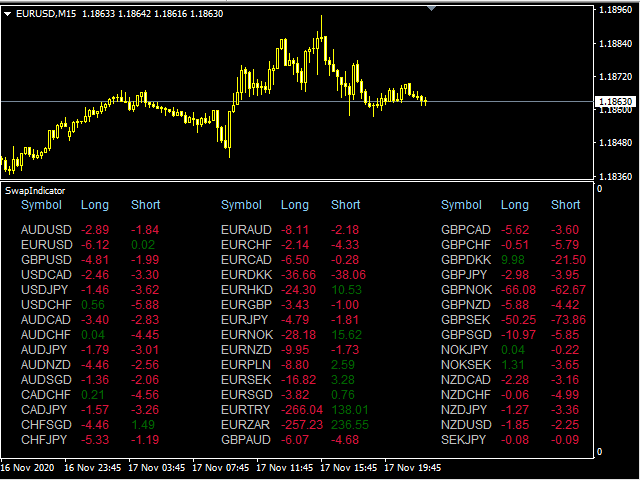
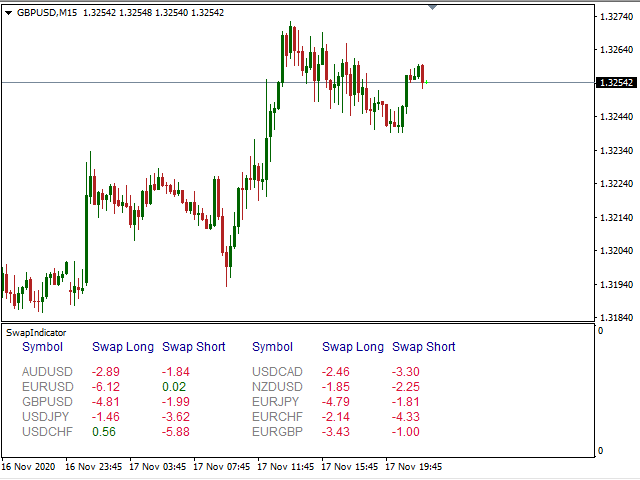
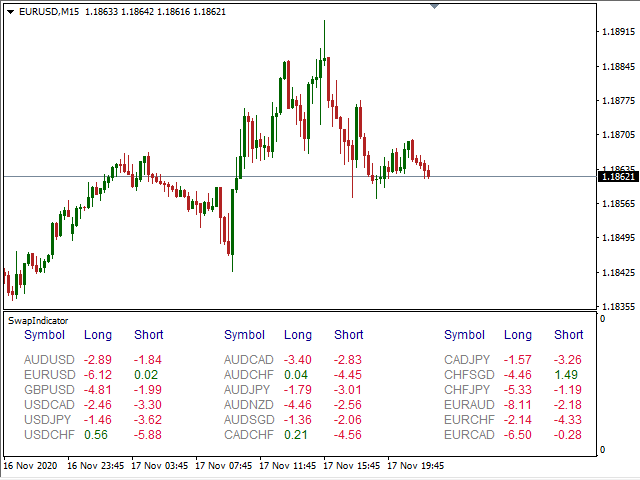

The swap rates are pasted unto the screen, truly and respected.