EZT Future Candles FREE


The FREE version works on Demo account and only CADCHF and NZDCHF pairs.


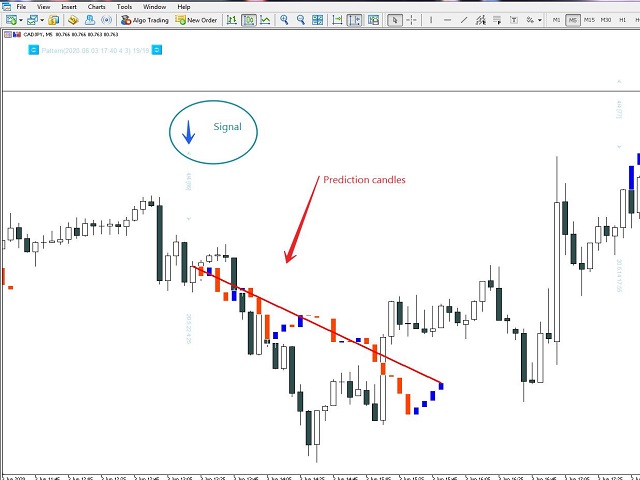
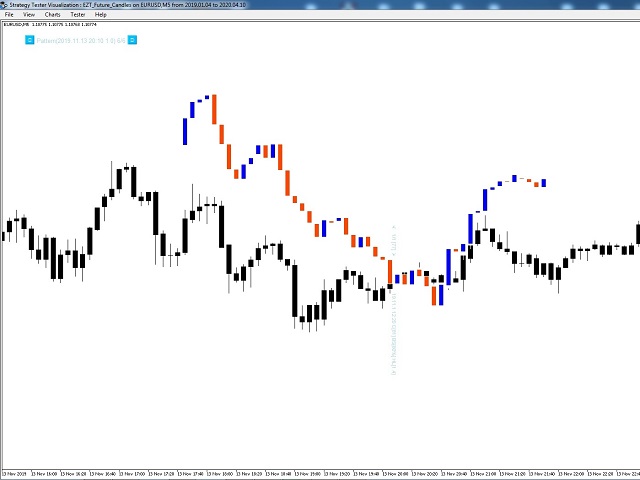
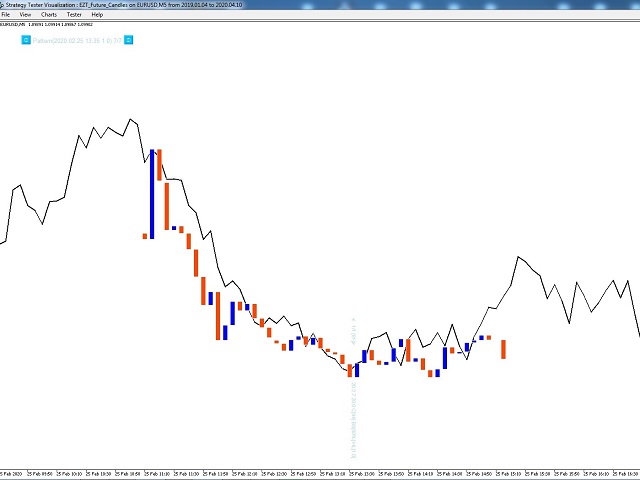
The indicator predict the future candles direction, by scanning past candle movement.

Based on the principal: “ The history repeat itself”. Programmed according to Kendall Correlation.

In the settings menu, different scanning options are available.

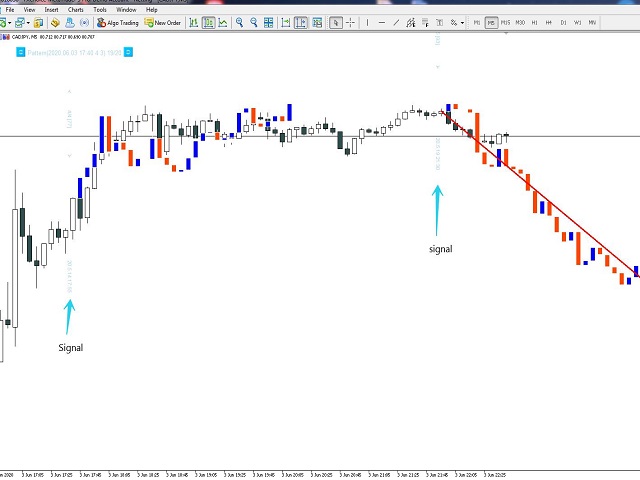
When the indicator find a match, start painting future candles from the current candle to the right, also from the current candle to the left as well, showing you the candle pattern what the actual signal is based on. The left side candle are optional, set it in the “ Draw Past Bars of the Pattern “ menu to true or false. If there is trend in those future candles, also optional, paint a trendline showing the probable direction.


Main menu:

·         Indicator drawing period: You can choose how many candles back you like the indicator draw patterns what find in the past, this way you can examine the validity of the settings you choose.

·         Test candles to Calculation: Number of candles to scan, to find a similar pattern to the actual last set of candle Pattern length.

·         Draw Past Bars of the Pattern: True/False

·         Candle Pattern Length: 5-100 candles. Choose the length of the pattern you looking for. The more candles you choose the less signals you might find.

·         Use Trend Finder: true/false : drawing a trendline to the future candles if applicable.

·         Trend Finder mode:Choose from 3 options when previous set to true.

·         Uptrend Color:Up- trendline color

·         Downtrend color: Down-trendline color


The following menu points will determine the signal you will receive.

Correlations

You can choose the 4 standard price options: close, open, high, low

After every price you can put a number from 1-100, that would be like a % of the similarity of the chosen pattern. The recommended number here is 80 %.

Ranges

Choose to compare of the Candle Pattern open/close or high/low range similarity.

Body size checking

This is the similarity in the candle body sizes

Directions of bodies similarity.

Bull /Bear candles in the given pattern


·         Future candle count: 5-30. How many candles to draw in the future.

·         Info text:All the chosen setting can be shown on the alert candle by vertically if set true.

·         Period start vertical line: when set true, there will be a vertical line on the alert candle

·         Navigator panel: When set to true there will be a navigator panel on the chart, you can jump to past candle alerts with the buttons.

·         Alerts: Pop up, e-mail and push notification alert


推荐产品
Easy GOLD MT5
Franck Martin
3.87 (45)
Easy Gold is the latest addition to the BotGPT family. It is surprising and very powerful. It is ideal for beginners due to its simplicity.  There is absolutely nothing to do, it's 100% automated, simply indicate the percentage of risk you want to take per trade and the EA is ready. Whatever your capital, the EA takes care of everything. Optimized on (XAUUSD).  Unleash all the power with the professional version (AGI Gold) and its connection to the neural network, available in my store. My othe
FREE
ATR Based Swing Trader Indicator Description The ATR Based Swing Trader Indicator is a sophisticated technical analysis tool designed for MetaTrader 5 (MT5) to assist swing traders in identifying potential buy and sell signals based on the Average True Range (ATR) and trend direction. Developed by Rahulkumar Kanani, this indicator leverages volatility and price movement to generate actionable trading signals, making it suitable for traders who aim to capture short- to medium-term price swings in
FREE
三推免费版:精准价格行为策略 ️ 重要提示:此免费版本仅限于 AUDUSD 货币对和 H1 时间框架。 交易并非寻找“圣杯”,而是识别可重复的市场心理。 三推免费版 是一款专业的技术分析工具,旨在通过机构级过滤器识别经典的“三推”衰竭形态。 与仅查看价格的基础指标不同,此工具整合了 交易量、动量和趋势过滤器 ,以确保您仅看到市场真正 过度扩张 的设置。 策略原理 “三推”是一种反转和衰竭形态。它识别市场向一个方向推进的连续三次尝试,通常预示着当前走势正在失去动力。该指标将寻找这些形态所需的复杂几何计算自动化,计算 斐波那契比率、波浪对称性以及波峰之间的时间跨度 。 专业交易者的核心功能: 无重绘: 准确性是我们的首要任务。一旦蜡烛收盘并生成信号,该信号即为最终且永久的。箭头在生成后绝不会移动或消失。 全汇合引擎: 您可以使用内置的移动平均线过滤趋势方向,使用 RSI/MACD 过滤动量背离,并使用跳动点/真实交易量来确认衰竭。 交互式统计面板: 直接在图表上跟踪您的表现。面板根据历史数据计算胜率、净点数和盈亏,允许您针对特定品种优化设置。 内置交易模拟: 为了帮助您了解设置的潜力,该
FREE
GDS Renko Pip ST Chart - Pip-Based Renko Chart Indicator for MetaTrader 5 GDS Renko Pip ST Chart is a pip-based Renko chart indicator for MetaTrader 5. It helps traders build and study cleaner Renko price movement using a practical fixed pip or point-based brick structure. This tool is designed as a Renko chart foundation for manual analysis. It does not predict the market, does not generate buy or sell signals and does not decide whether a trade should be opened. Renko EDGE EA Golden Delta | A
FREE
RSI with alerts BDA
Laron Demetris Burrows
4.89 (28)
该算法预测价格的短期变化,准确率为86%*. 当有一个大的移动由ATR确定,在超买或超卖条件,指标将提醒您。 预测价格是否会高于或低于信号蜡烛。 完美的平均回归交易,二元期权或期货合约在更大的时间框架。 该指标在5年的数据上进行了回溯测试,预测价格随时间变化的准确率为90%。 特征: 简单的设置 拖放到任何图表上 根据您的喜好调整参数(可选) 启用警报(可选) 你就完了! 视觉和音频警报 警报直接发送到您的手机 发送到终端的弹出警报 高胜率 赢得高达90%的交易 回溯测试5年和多种货币。 (请参阅网站的回测细节和分析)。 大量信号 预计每个符号每天1到2个信号*。 *这是如果你有30分钟蜡烛的指示灯。 灵活 适用于外汇,指数,商品和股票。 适用于任何时间范围 从5分钟到每天的酒吧都能很好地工作。 但是,它在更高的时间范围内更准确 很容易在图表上看到。 您可以更改信号条和信号箭头的颜色 关于我: 这个算法是由一个博士工程师,定量和活跃的交易者. 我开发了这些算法来交易我的个人资本,他们正在成功地做到这一点。 但是,我无法在一个组合中使用所有这些算法。 所以我为您提供了一个选择数量
FREE
Linear Momentum Pro
Sejro Toussaint Boco
Ultra Momentum — Advanced Multi-Scale Momentum & Market Pressure Indicator (MT5) Ultra Momentum is a professional momentum indicator for MetaTrader 5 , designed to measure true market speed and directional dominance rather than simple price oscillations. It combines classic Momentum with multi-period analysis and advanced smoothing algorithms , producing a highly reliable view of bullish and bearish pressure. This indicator is built for traders who want to understand who controls the market a
FREE
LiquiditySweepHunter
Michael Oko Oboh
5 (1)
OVERVIEW Liquidity Sweep Hunter  identifies liquidity highs and lows across three different lookback periods and keeps them active until they are mitigated. This creates a persistent view of where resting liquidity has formed instead of only showing the latest swing points. The indicator also displays a heatmap that highlights the relative strength of active liquidity levels and generates reversal signals after price sweeps multiple visible liquidity bands before reclaiming them. Optional tr
FREE
Risk Calculator EA – Utility for Precise Trade Sizing If you find this tool useful consider to  Buy me a coffee!   The Ultimate Risk Calculator is a lightweight in-chart Expert Advisor (EA) designed to help you easily and quickly calculate position size and set stop-loss / take-profit levels with full control over risk management directly on the chart. What it does? It turns manual risk decisions into fast, visual, and accurate calculations. You draw or adjust the Entry, Stop-Loss and Take-P
FREE
Girassol Sunflower MT5 Indicator
Saullo De Oliveira Pacheco
3.86 (7)
This is the famous Sunflower indicator for Metatrader5. This indicator marks possible tops and bottoms on price charts. The indicator identifies tops and bottoms in the asset's price history, keep in mind that the current sunflower of the last candle repaints, as it is not possible to identify a top until the market reverses and it is also not possible to identify a bottom without the market stop falling and start rising. If you are looking for a professional programmer for Metatrader5, please
FREE
SmartPullback
Samuel Jesus Fidalgo Lopez
Smart Pullback Pro v4 High-Probability Pullback Indicator for MT5 Smart Pullback Pro v4 is a professional trend-following indicator for MetaTrader 5 that identifies high-probability pullback entries in real time. It automatically plots entry zones, Stop Loss, and Take Profit levels directly on the chart, giving traders a complete visual trading plan with every signal. How It Works Smart Pullback Pro v4 combines multiple confluence filters to eliminate low-quality signals and focus only on va
FREE
Violet Indicator  by Quant Atlas Creator:  https://www.quant-atlas.com/ Violet Indicator is a clean reversal focused trading tool designed to identify moments where price may be shifting away from an extended directional condition. The indicator uses a price derived trend framework to detect moments where market structure may be changing. When conditions align, it plots violet triangle signals directly on the chart. Both bullish and bearish signals use the same violet visual identity, giving the
FREE
Signal Genius
Rizwan Akram
4.5 (2)
SIGNAL GENIUS - Professional Smart Money Confluence Indicator Signal Genius is a comprehensive trading indicator that combines multiple Smart Money Concepts (SMC) and ICT methodologies into one powerful tool. It automatically detects high-probability trade setups by analyzing market structure, liquidity sweeps, and institutional order flow. KEY FEATURES Fair Value Gaps (FVG) Detection    • Automatic identi
FREE
SuperTrend TV
Tran Nhat Minh
5 (3)
Original supertrend indicator in Tradingview platform.  Indicator type: Price Action indicator Introduction:   The Supertrend Indicator - Enhancing Your Trend Analysis.  If you haven't yet found a Supertrend indicator with good graphics on the MQL5 platform, this is the indicator for you. Overview:   The Supertrend Indicator is a powerful tool designed to provide traders with valuable insights into the current and historical trends of financial markets. It serves as a valuable addition to any t
FREE
HMA Color with Alerts MT5
Pavel Zamoshnikov
4.77 (60)
Hull Moving Average (HMA) is well-deservedly popular among traders because of the effective averaging of market noise and a relatively small delay. The current MetaTrader 5 version changes its color when the movement direction changes. Sound and text signals are available. It also supports sending email and push messages. It is possible to trigger a signal on the current incomplete bar, although such a signal may be canceled before completion if conditions are no longer appropriate. One of the p
FREE
Easy Correlations Indicator The Easy Correlations Indicator is designed to help traders analyze the relationship between two correlated instruments. By monitoring the distance between their Relative Strength Index (RSI) values, the indicator highlights situations where one instrument has moved significantly further than the other. This creates potential trading opportunities: Sell the stronger instrument (overstretched RSI) Buy the weaker instrument (lagging RSI) Because the positions are opened
FREE
RKbots Fair Value Gap LTE
Roxanne Kemisha Kelly
Fair Value Gap Scanner LITE identifies institutional imbalances directly on your chart — no manual scanning, no guesswork. A Fair Value Gap forms when price moves so aggressively that a candle's range is skipped entirely, leaving an unfilled imbalance in the market. Smart money consistently returns to these zones, making them high-probability areas for entries, targets, and stop placement. What the indicator does: Scans H4 and D1 timeframes automatically Draws bullish and bearish FVG zones direc
FREE
Phoenix Momentum 5 Star
Nigel Nii Darku Narnor Darko
This indicator, "Phoenix Volume Amazing", is a sophisticated Volume Delta and Order Flow Dashboard. Unlike standard volume indicators that only show total activity, this tool dissects the internal "tug-of-war" between buyers and sellers in real-time. Core Functionality The indicator calculates Delta (the difference between buying volume and selling volume) to provide a "under the hood" look at market sentiment. It uses a custom-built GUI (Graphical User Interface) panel to display these metrics
FREE
TrendBox Indicator MT5
Ivan Grachev
4.73 (15)
The indicator looks for consolidation (flat) in the market at a certain time, builds a box-channel and marks levels indented from it for a breakdawn. After crossing one of the levels, the indicator marks the zone for take profit and calculates the corresponding profit or loss in the direction of this entry on the panel. Thus, the indicator, adjusting to the market, finds a flat area of the market, with the beginning of a trend movement to enter it. Version for MT4: https://www.mql5.com/en/market
FREE
Next Bar Countdown 是一款高精度、高性能的 MetaTrader 5 時間指標,專為向交易者顯示當前燭台結束前的剩餘時間而設計。精確的時間對許多交易策略至關重要,尤其是在新燭台開啟時需要立即做出決策的情況下。 主要功能: 該指標提供多種超越標準計時器的功能: 雙時間框架顯示: 您可以同時顯示當前圖表時間框架和第二個可自由選擇的時間框架(例如 H4 或每日)的倒數計時。 防滯技術: 透過伺服器時間與本地系統時間之間的智能同步,計時器運行絕對流暢。即使市場波動性較低或週末未收到報價,它也不會跳過任何秒數。 個性化設計: 字體、大小和在圖表上的位置都可以完全根據您自己的圖表設置進行調整。 視覺警報: 在烛台收盤前的最後幾秒鐘,該指標可改變倒數計時的顏色,及時引起您的注意。 全面的通知系統: 當烛台即將收盤時,您可透過終端警報或直接發送到智慧型手機的推送通知隨時掌握最新資訊。 操作與反饋 安裝完成後,您可透過輸入視窗輕鬆設定所有參數。該指標可立即使用,無需複雜的預設設定。 由於此工具為免費提供,您的反饋或評價對我們而言非常寶貴。如果您有任何疑問或進一步優化的建議,可隨時使用內
FREE
Bollinger RSI Momentum Reversal:精准动量反转指标 告别盲目追涨杀跌。大多数交易者之所以亏损,是因为他们在价格触碰布林带时就急于入场,而没有等待动量的转变。 Bollinger RSI Momentum Reversal 指标通过“双重锁定”确认机制解决了这一难题。 工作原理 本指标将 布林带 的波动边界与 相对强弱指数 (RSI) 的趋势转换能力相结合。它不仅能告诉你价格何时处于“超买”或“超卖”状态,更能精准捕捉动量真正转向有利时机的瞬间。 买入信号: 当价格从布林带下轨反弹,且 RSI 向上突破 50 (确认牛市动量)时触发。 卖出信号: 当价格从布林带上轨回落,且 RSI 向下跌破 50 (确认熊市动量)时触发。 核心优势 信号不漂移: 信号箭头在蜡烛图收盘时出现,一旦确定永不消失。 视觉直观: 满足条件时,买入/卖出箭头直接显示在图表上,清晰易懂。 高度可定制化: 可微调 RSI 周期、布林带参数及信号方向,以匹配不同交易品种的“个性”。 策略应用与核心规则 顺势而为: 在趋势市场中,务必筛选并仅跟随主趋势方向的信号进行交易。 趋势回调: 在强劲
FREE
Support and Ressistance
Raphael Lorenz Baumgartner
上一日支撑与阻力 平台: MetaTrader 5 类型: 自定义指标 显示位置: 图表窗口(叠加) 功能: 根据前一天的最高价和最低价计算 支撑与阻力区域 。 使用滑动窗口 ( SampleWindowSize ) 分析近期价格区间。 当当前价格区间显著低于前高时,标记为 潜在支撑区 。 当价格区间高于前低时,标记为 潜在阻力区 。 输出 4 个结果: LDResistanceHigh – 阻力顶部 LDResistanceLow – 阻力底部 LDSupportHigh – 支撑顶部 LDSupportLow – 支撑底部 输入参数: SampleWindowSize (默认值:10) 用于识别小范围价格区间的K线数量。 输出值: LDResistanceHigh / LDResistanceLow 显示潜在的阻力区间。 LDSupportHigh / LDSupportLow 显示潜在的支撑区间。
FREE
Cumulative Delta MT5
Evgeny Shevtsov
4.53 (62)
The indicator analyzes the volume scale and splits it into two components - seller volumes and buyer volumes, and also calculates the delta and cumulative delta. The indicator does not flicker or redraw, its calculation and plotting are performed fairly quickly, while using the data from the smaller (relative to the current) periods. The indicator operation modes can be switched using the Mode input variable: Buy - display only the buyer volumes. Sell - display only the seller volumes. BuySell -
FREE
Follow The Line MT5
Oliver Gideon Amofa Appiah
4.6 (35)
This indicator obeys the popular maxim that: "THE TREND IS YOUR FRIEND" It paints a GREEN line for BUY and also paints a RED line for SELL. (you can change the colors). It gives alarms and alerts of all kinds. IT DOES NOT REPAINT and can be used for all currency pairs and timeframes. Yes, as easy and simple as that. Even a newbie can use it to make great and reliable trades. NB: For best results, get my other premium indicators for more powerful and reliable signals. Get them here: https://www.m
FREE
Automatically identifies HTF CRT & ERC liquidity sweeps and syncs precise levels/boxes down to lower timeframes. HTF CRT & ERC Liquidity Sweeps is a specialized liquidity analysis tool built for traders practicing Smart Money Concepts (SMC) , ICT , or Price Action . The key advantage of this indicator is that all liquidity sweep calculations are performed purely on the Higher Timeframe (HTF) , and the resulting Boxes and Sweep Lines are synced down to your Lower Timeframe (LTF). This completely
FREE
Trend Quorum MT5
Kestutis Balciunas
5 (2)
Trend Quorum   是一款自适应趋势跟踪指标,将动态SuperTrend引擎与专有趋势质量指数(TQI)及3个可选汇聚过滤器相结合。只有当足够多的独立因素"投票"达成一致时,信号才会触发——就像一个法定人数。 查看 MT5 版本:  Trend Quorum MT5 查看更多产品:   全部产 品 欢迎访问我的主页查看实盘案例和新工具,并发送好友申请以及时获取最新更新! 工作原理 自适应 SuperTrend 引擎 与使用固定ATR乘数的标准SuperTrend指标不同,Trend Quorum使用趋势质量指数(TQI)实时动态调节通道宽度。TQI是一个0到1的连续评分,由四个加权因素计算得出: 效率比率   — 衡量方向性运动的纯粹度(价格运动中方向性成分与噪音成分的比例) 波动率机制   — 检测波动率扩张或收缩的市场状态 价格结构   — 价格在近期高低点范围内的位置 动量持续性   — 与整体方向保持一致的K线占比百分比 当趋势质量较高时,通道收窄以更早捕捉行情。当质量下降时,通道扩宽以避免震荡市场中的虚假信号。非对称通道逻辑进一步增强了这一效果:活跃侧(趋势方向一侧
FREE
Heiken Ashi Smoothwave
Alexandre Vincent Traber
概述 Heiken Ashi Smoothwave 将您的图表直接转换为平滑的平均K线(Heiken Ashi),并在主图表窗口中替代标准K线,呈现更清晰的趋势视图。无需单独窗口,界面简洁。 工作原理 每根K线根据真实价格数据计算 Heiken Ashi 的开高低收值。 直接在主图表上绘制彩色 Heiken Ashi K线。 自动隐藏原生图表K线,仅显示 Heiken Ashi K线。 移除指标时自动恢复标准K线。 输入参数 无可配置参数,添加即可使用。 推荐设置 适用于任何交易品种、任何时间周期。可在外汇、黄金、指数及MetaTrader 5支持的任何品种上使用。 截图 应用 Heiken Ashi Smoothwave 后的图表,原生K线已自动隐藏。 免责声明 本指标为趋势分析的可视化工具,并非交易信号生成器。过往表现及视觉平滑效果不保证未来结果。使用真实账户前请务必先在模拟账户上测试。
FREE
Alpha Trend Analyzer
Le Trung Kien Hoang
SuperTrend Indicator – Description & Important Notice The SuperTrend is a composite technical indicator designed to help you identify the primary trend, measure its strength, and assess signal quality. However, an indicator is only a tool —it’s never 100% accurate and cannot replace sound risk management. 1. Core Formula & Components ATR (Average True Range): measures price volatility; customize sensitivity via Periods and Multiplier . Upper/Lower Bands: derived from ATR and your chosen source p
FREE
Bollinger Bands Filled
Tran Nhat Minh
5 (3)
A clean Bollinger Bands indicator with single-color filling designed to reduce chart clutter. What is This Indicator? This is a Bollinger Bands technical indicator designed with visual simplicity in mind. Unlike standard Bollinger Bands implementations that display multiple colored lines and bands, this indicator uses a single-color filled area to represent the trading bands. This approach minimizes visual clutter while maintaining full functionality for technical analysis. How It Works The ind
FREE
Binary Profit Gainer
Myo Min Aung
5 (2)
This indicator is especially for the binary trading. Time frame is 1 minutes and exp time 5 or 3 minutes only. You must be use martingale 3 step. So you must put lots size is 10 % at most. You should use Mt2 trading platform to connect with my indicator to get more signal without human working. This indicator wining rate is over 80% but you may get 100% of profit by using martingale 3 step. You should use MT2 Trading Platform to connect meta trader platform and binary platform . You can get mt2
FREE
Rolling vwap atr market panel
Florian Alain Bernard Jean-paul Pierre Cuiset
Rolling VWAP + ATR Bands + Market Panel — powerful visual tool for scalping, extensions detection and intraday market structure analysis. Rolling VWAP + Panel Rolling VWAP + Panel is a professional MetaTrader 5 indicator designed to analyze market structure using a Rolling Volume Weighted Average Price (VWAP) combined with ATR-based volatility bands , a real-time market analysis panel , and an integrated candle countdown timer . This indicator provides a clear and structured view of price beha
FREE
该产品的买家也购买
本产品已针对 2026 年市场进行更新,并针对最新 MT5 版本进行了优化。 价格更新通知: Smart Trend Trading System 目前价格为 $99 。 接下来的 30 次购买 后,价格将上涨至 $199 。 特别优惠: 购买 Smart Trend Trading System 后,请发送私信给我,即可免费领取 Smart Universal EA ,并将您的 Smart Trend 信号转换为自动交易。 Smart Trend Trading System 是一套完整的交易系统,具备不重绘、不回绘、不延迟的特点,专为希望获得更清晰信号、更准确趋势方向以及更有组织交易方式的交易者打造。 Learn Smart Trend Trading System Everything you need to learn, install, and use the product is available here: Online Course:   https://www.mql5.com/en/blogs/post/757466 Visual User Manual — B
Trend Sniper X
Sarvarbek Abduvoxobov
4.73 (15)
Trend Sniper X 是一款适用于 MetaTrader 5 的多周期趋势跟踪指标,可帮助交易者清晰精准地识别趋势方向和潜在的反转点。 适用于 MT4: https://www.mql5.com/en/market/product/193245 价格信息: 当前价格为促销价,随着未来更新和新功能的发布,价格可能会有所变动。 Code2Profit 频道 通过多时间框架分析掌控市场! 如何使用 Trend Sniper X 最大化您的胜率:核心规则与交易时段技巧 技术规格 平台 MetaTrader 5 指标类型 多时间周期趋势指标 运行时间周期 任何图表时间周期,可独立选择更高的时间周期 (M1–MN1) 主要交易品种 外汇、黄金 (XAUUSD) 及其他差价合约 (CFD) 推荐账户 任何账户类型 可视化 彩色趋势蜡烛 (买入/卖出/微弱/变化) + 买入/卖出箭头 附加模块 交易时段方框 (悉尼、东京、伦敦、纽约) 主要功能 多时间周期趋势分析: 直接在当前图表上投射更高时间周期的趋势方向,提供清晰的宏观视角。 弱势/不确定柱检测: 高亮显示趋势条件不明朗的柱线,让交易者避
Neuro Poseidon MT5
Daria Rezueva
4.85 (54)
Neuro Poseidon is a new indicator by Daria Rezueva. It combines precise trading signals with adaptive TP/SL levels - creating best possible trades as a result! Message me and get  Neuro Poseidon Assistant  as a gift to automize your trading process! What makes it stand out? 1. Proven profitability on all assets and timeframes 2. Only confirmed BUY and SELL signals present on the chart 3. Adaptive TP & SL levels generated by the software for each trade 4. Easy to understand - suitable for al
Unix Scalper
Issam Kassas
UNIX Scalper — Gold Scalping Indicator for MetaTrader 5 UNIX Scalper is a focused Gold scalping indicator designed primarily for XAUUSD on M1, M2, M3, M5, M10 and M15. It gives the trader a clear BUY, SELL or WAIT decision together with the complete trade plan: Entry, Stop Loss, TP1 and TP2 . PRICE UPDATE NOTICE: Currently available for $199. The price will   increase to $399   after the next   30 purchases . The concept is simple: wait for the signal, follow the levels, move the Stop Loss to
Welcome to ENTRY IN THE ZONE AND SMC MULTI TIMEFRAME Entry In The Zone and SMC Multi Timeframe is a real-time market analysis tool based on Smart Money Concepts (SMC), designed to analyze market structure, price direction, and key trading zones. It supports both Single-Timeframe Analysis and Multi-Timeframe Analysis, providing a clearer view of the overall market structure across multiple timeframes, with real-time BUY / SELL signals that do not repaint. It is designed to help filter trading opp
Zoryk Gold
Reda El Koutbane
5 (7)
折扣将在 24 小时后结束——下一价格为 69 美元 ZORYK — MetaTrader 5 专用高级 XAUUSD 黄金信号系统 你一定熟悉这种感觉。 你花了很多时间分析黄金,等待合适的入场机会。终于开仓后,价格却立刻朝相反方向移动。你过早平仓、移动止损,或者只犹豫了几秒钟。随后,市场却在没有你的情况下到达了你原本预期的目标。 问题并不总是方向判断错误。 真正的问题是缺乏确定性。 你不知道准确的入场位置在哪里。 你不知道什么时候交易逻辑已经失效。 你不知道应该先锁定较近的利润,还是继续等待更大的行情。 你也不知道当前信号是否足够强,还是自己只是在强行寻找交易机会。 黄金市场变化非常快。一个没有明确计划的好想法,可能在几秒钟内变成错误的交易决定。 ZORYK 正是为了解决这个问题而开发。 什么是 ZORYK ZORYK 是一套完整的 XAUUSD 黄金信号与交易计划系统,专门为 MetaTrader 5  和 M5 时间周期 开发。 它不是一个只显示 BUY 或 SELL 箭头,然后让你独自决定其余所有内容的简单指标。 每个确认后的信号都可以在图表上显示完整的可视化交易计划,包
SMC Intraday Formula
Kareem Abbas
5 (22)
让我们先坦诚一点。 没有任何一个指标可以单独让你实现盈利。如果有人告诉你可以,那他是在向你兜售一个梦想。任何显示完美买卖箭头的指标都可以被做得看起来毫无瑕疵——只需要放大历史中的某一段并截取成功交易的截图。我们不会这样做。 SMC Intraday Formula 是一个工具。 它为你读取市场结构,标记出概率最高的价格区域,并用简单直白的语言准确告诉你当前智能资金的行为轨迹。你仍然需要做决定。你仍然需要执行交易。但现在,你是带着精确性执行,而不是靠希望。 我们已经在黄金(XAUUSD)以及主要外汇货币对的日内剥头皮交易中使用该指标将近三年。这是我们在 M1、M5、M15 和 M30 上的日常主力工具。它之所以有效,是因为它不试图预测未来——它展示的是当前正在形成的高概率交易机会,并解释 为什么 。 它与其他所有指标有什么不同? 大多数交易指标只做一件事。移动平均线交叉。振荡指标触及某个水平。出现一个箭头。你进场交易。你亏损。你责怪指标。重复。 SMC Intraday Formula 将多个机构级概念整合为一个统一的市场解读: - 斐波那契共振引擎 不只是普通的斐波那契水平——该指标
GoldenX Entry MT5
Kareem Abbas
5 (16)
GoldenX Entry 是一款用于 MT5 的指标,包含自适应 Smart Entry Trend 算法、信号评分系统、市场状态识别器以及波动率过滤器。每个信号都包含计算得出的入场位、三个止盈位(TP1、TP2、TP3)以及止损位。它基于多个分析层构建,旨在适应不同市场条件,将多层分析系统与内置优化器及统计跟踪系统相结合。该指标基于风险收益比(RR)指标和历史交易行为提供量化分析。 开始使用非常简单——在所选时间周期上运行优化器,然后在图表上开始使用该指标。 核心功能 GoldenX Entry 将信号引擎与内置交易管理及历史统计跟踪整合在同一图表中: - 内置优化器: 优化器可在图表上单击运行。它通过两阶段搜索流程测试200种参数组合——先进行探索,再进行优化——并在完成后自动应用选定配置。结果会按时间周期缓存,因此当返回已优化的周期时,会立即恢复相同设置。 - 黄金品种自动周期识别: 将指标加载到任何 XAUUSD 图表(M1 到月线)。系统会自动识别当前周期并加载对应预设。共包含9个时间周期配置文件,专为黄金在标准周期上优化设计。切换周期时,参数会自动调整。 - 资金参考面
SuperScalp Pro
Van Minh Nguyen
4.63 (32)
SuperScalp Pro – 专业多层级共振剥头皮交易系统 SuperScalp Pro 是一款专业的剥头皮交易指标,基于多层级信号确认系统构建,将 Supertrend 与 VWAP、EMA、RSI、ADX、Volume、Bollinger Bands 和 MACD Divergence 等高级市场分析工具相结合。通过结合趋势分析、动量、成交量和市场波动率,SuperScalp Pro 为识别潜在交易机会提供了一种结构化的方法,在图表上直接显示清晰的 Buy 和 Sell 信号,同时根据 ATR 波动率自动计算 Stop Loss 和 Take Profit 水平。 购买后,请联系我,以获取如何使用 SuperScalp Pro Auto Trader 自动执行 SuperScalp Pro 信号的指导。 使用 SuperScalp Pro Auto Trader 自动执行 SuperScalp Pro 交易信号: [Auto Trader] 完整文档和推荐的 set 文件可在产品博客中查看: [User Guide] 关注官方 SuperScalp Pro MQL5 Chann
Superhero
Ihor Otkydach
5 (3)
SUPERHERO 指標是一款基於「全方位」原則設計的多貨幣交易系統。該指標能獨立分析市場,並提供開倉與平倉的交易訊號。它採用止損與獲利了結訂單,風險報酬比(R:R)為 1:1。 我偶爾會根據這個系統的訊號親自進行交易,以下是我獲得的結果—— 即時訊號 此系統可向您的智慧型手機發送推播通知,讓您無需綁定電腦,即可「隨時隨地」進行交易。這對於自營交易公司而言再適合不過了。 每位顧客皆可享額外好禮: 每位購買此指標的買家,都將收到我贈送的一項特別實用工具,該工具: 自動下達止損與獲利了結訂單 當價格達到目標水準時,系統會自動平倉 支援待執行訂單交易 支援均值交易模式 如果您希望將這款優秀且極為便利的工具作為禮物獲贈,請在購買 SUPERHERO 指標後,立即透過 MQL5 平台的私訊與我聯繫。此外,您還將獲得培訓課程「如何安裝與設定 SUPERHERO 並開始穩定獲利」的存取權限。 關於「超級英雄」策略 SUPERHERO 策略是利用價格回調時,順應趨勢方向進行盤中交易。 「超級英雄」程式碼內含數個強大的技術指標,用以分析價格通道的趨勢方向與波動範圍,並能識別在修正性回調後形成的盤中波段反
M1 Sniper MT5
Oleg Rodin
5 (7)
M1 SNIPER   是一款易于使用的交易指标系统。它是一个专为 M1 时间框架设计的箭头指标。该指标可以作为独立的系统在 M1 时间框架下进行剥头皮交易,也可以作为您现有交易系统的一部分使用。虽然该交易系统专为 M1 时间框架交易而设计,但它也可以用于其他时间框架。我最初设计此方法是为了交易 XAUUSD 和 BTCUSD。但我发现这种方法在其他市场交易中也同样有用。 指标信号既可以顺势交易,也可以逆势交易。我教授一种特殊的交易技巧,帮助您利用指标信号进行双向交易。该方法基于使用特殊的动态支撑位和阻力位区域。 购买后,您可以立即下载 M1 SNIPER 箭头指标。此外,我还为所有 M1 SNIPER 工具用户免费提供下方屏幕截图所示的 Apollo Dynamic SR 指标!这两个指标的组合可以帮助您更轻松、更准确地利用 M1 时间框架进行交易。 购买后请联系我,免费获取交易提示和奖励指标! 祝您交易成功!
Gann Made Easy MT5
Oleg Rodin
5 (9)
Gann Made Easy   是一个专业且易于使用的外汇交易系统,它基于使用先生理论的最佳交易原则。 W.D.江恩。该指标提供准确的买入和卖出信号,包括止损和获利水平。您甚至可以使用推送通知在旅途中进行交易。 购买后请联系我,即可免费获得交易指导和超棒的额外指标! 您可能已经多次听说过江恩交易方法。通常 Gann 的理论不仅对于新手交易者而且对于那些已经有一定交易经验的人来说都是非常复杂的东西。这是因为江恩的交易方法在理论上并不那么容易应用。我花了几年时间来完善这些知识,并将最好的原则应用到我的外汇指标中。 该指标非常易于应用。您所需要的只是将其附加到您的图表并遵循简单的交易建议。该指标不断进行市场分析工作并寻找交易机会。当它检测到一个好的入口点时,它会为您提供一个箭头信号。该指标还显示止损和获利水平。 换句话说,当您像先生一样进行交易时,该指标会为您提供最佳江恩建议。江恩亲自告诉你此时此刻该做什么。但最好的部分是您不需要了解任何有关江恩交易原则的知识,因为该指标会为您完成整个市场分析工作。
Gold Entry Sniper
Tahir Mehmood
5 (19)
Gold Entry Sniper – 专业多周期ATR黄金交易仪表盘,适合黄金剥头皮与波段交易 Gold Entry Sniper 是一款先进的 MetaTrader 5 指标,旨在为 XAUUSD 及其他品种提供精准的 买/卖信号 。基于 ATR 移动止损逻辑 和 多周期分析仪表盘 ,适合剥头皮交易者与波段交易者,帮助识别 高概率黄金入场点 。 主要功能与优势 多周期信号分析 – 同时显示 M1、M5、M15 趋势方向。 基于ATR的动态止损 – 根据波动性自动调整。 专业图表仪表盘 – 展示信号状态、ATR水平、线性回归中线和交易方向。 清晰买卖标记 – 自动箭头与文字标签提示。 离场提示与交易管理 – 自动检测离场信号锁定利润。 全面自定义 – 调整仪表盘位置、颜色、字体及参数。 专为黄金优化 – 适用于 M1至M15 黄金剥头皮 ,也适合外汇、指数与加密货币。 为什么选择 Gold Entry Sniper? 为追求 快速、精准、可视化交易决策 的交易者打造,ATR 与多周期确认结合,帮助你抓住 最佳黄金入场点
Divergence Bomber
Ihor Otkydach
4.89 (94)
我偶爾會親自使用這個系統進行交易。 請評估我在真實帳戶上進行的手動 BOMBER 交易—— LIVE SIGNAL 购买该指标的每位用户将额外免费获得以下内容: 原创工具“Bomber Utility”,该工具会自动跟踪每一笔交易,设置止损和止盈点,并根据策略规则自动平仓; 适用于不同交易品种的指标设置文件(Set 文件); 三种不同风险模式下的 Bomber Utility 设置文件:“最低风险”、“平衡风险” 和 “观望策略”; 一套详细的 视频操作手册,帮助您快速完成安装、配置并开始使用本交易系统。 注意: 要获取以上所有赠品,请通过 MQL5 的私人消息系统联系卖家。 我为您介绍原创的自定义指标 “Divergence Bomber”(背离轰炸机),它是一套基于 MACD 背离交易策略 的“全功能”交易系统。 该技术指标的主要任务是识别 价格与 MACD 指标之间的背离,并发出交易信号(包括推送通知),指示未来价格可能的运动方向。平均而言,这些信号的准确率超过 98%。有关该指标如何工作的详细说明,请观看本页面上的视频演示。 该系统使用 止损订单 和 动态回撤平仓机制 来管理
Atomic Analyst MT5
Issam Kassas
4.44 (54)
本产品已针对 2026 年市场进行更新,并针对最新 MT5 版本进行了优化。 价格更新通知: Atomic Analyst 目前价格为 $99 。 接下来的 30 次购买 后,价格将上涨至 $199 。 特别优惠: 购买 Atomic Analyst 后,请发送私信给我,即可免费领取 Smart Universal EA ,并将您的 Atomic Analyst 信号转换为自动交易。 Atomic Analyst 是一款不重绘、不回绘、不延迟的 Price Action 交易指标,专为手动交易、清晰信号和 EA 自动化而设计。 User manual: settings, inputs and strategy.   &   User Manual PDF . 它分析价格行为、强度、动能、多周期方向和高级过滤器,帮助交易者减少噪音,避免弱势交易机会,并做出更有结构的交易决策。 该指标将复杂的市场计算转换为简单的视觉信号、彩色K线、趋势读数、止损水平和多个止盈区域,使交易者能够快速理解并应用于真实市场环境。 主要交易用途: 剥头皮和日内交易: 专为快速决策、清晰箭头、提醒、K线颜色和
Entry Points Pro for MT5
Yury Orlov
4.51 (150)
传奇回归:Entry Points Pro 10。 这款传奇指标曾 3 年稳居 MQL5 Market 前三,如今全面重启。 数百条热情好评(两个版本合计 589 条),每天有数千名交易者用它交易,演示版下载 31,000+   MT4+MT5  次。 五年来我读过你们的每一条评价——在第 10 版里,我没有给出许诺,而是把答案直接做进了产品。指标作者自 1999 年入市, 珍视诚信、自己的声誉和自己的客户 。 Entry Points Pro 给出的入场信号严格不重绘。 而且这一次不再只是作者的一面之词,而是可验证的事实:确认信号只在 K 线收盘后标出,自动化测试记录到 零重绘 (在 EURUSD、XAUUSD 和 BTCUSD 上共 2,486,568 次不变量检查——0 次违规)。测试方法完全公开——您可以在策略测试器中自行复现。 购买后请务必第一时间给我发私信。 我会发给您 扩展版说明书《交易者圣经》 ——使用本指标交易的完整指南——并告诉您如何免费获得 赠品:市场扫描器 ,它能同时分析多个品种和多个时间周期,并在一个界面上显示 Entry Points Pro 此刻在哪里表现
Azimuth Pro
Ottaviano De Cicco
5 (7)
Azimuth Pro V2:MT5合成分形结构分析与确认入场 概述 Azimuth Pro 是 Merkava Labs 推出的多层级波段结构指标。四层嵌套波段层级、锚定波段的VWAP、ABC形态识别、三时间框架结构过滤以及收盘确认入场——一个图表,一个从微观波段到宏观周期的完整工作流程。 这不是盲目的信号产品。它是一个以结构为先的工作流程,专为重视位置、背景和时机的交易者打造。 ️ 夏季促销 — 庆祝夏至与 The Oracle Pro 上市:Azimuth Pro 七折优惠,现价 279 美元(原价 399 美元)。限时夏季优惠。 1. V2的变化 合成多时间框架引擎 高时间框架分析从零开始重建,采用与Meridian Pro相同的专有合成架构。更清晰的HTF背景、稳定的实时行为、无经典MTF同步问题。合成引擎还解锁了 固定比率时间框架级联 (x2、x3、x4、x6)——不再在经纪商的固定时间框架之间任意跳转,您可以按图表时间框架的固定倍数分析结构,在每个尺度上保持相同的分形关系。 确认入场箭头 作为稳定且可恢复的执行层而设计的收盘确认箭头。当ABC设置形成且自适应确认逻辑
FiboSniper Pro
Van Minh Nguyen
5 (2)
FiboSniper Pro – 专业多重过滤 Fibonacci 网格交易系统 FiboSniper Pro 是一套先进的技术交易指标系统,将 Fibonacci Envelopes 与多层市场确认条件相结合,包括 ADX、EMA、RSI、ATR 和时间过滤器。通过综合分析价格结构、趋势、动量和波动率,该系统帮助交易者识别更加精选且质量更高的入场机会,同时提供基于 ATR 自动计算的 Stop Loss 和 Take Profit 水平,以实现结构化的交易管理。 购买后,请联系我获取使用 Auto Trader X 自动交易 FiboSniper Pro 信号的操作说明。 使用 Auto Trader X 自动执行 FiboSniper Pro 交易信号: [Auto Trader X] 查看用户指南并下载推荐的设置文件: [Click here] 加入 FiboSniper Pro MQL5 官方公开频道,获取产品更新和新闻: [Click here] 该系统使用 5 个 Fibonacci 水平(23.6%、38.2%、50%、61.8% 和 100%)识别动态支撑和阻力区域,这
UZFX {SSS} 超短线智能信号 v5.0 MT5 是一款无重绘的高性能交易指标,专为在快速波动的市场中需要精准、实时信号的超短线交易者、日内交易者和波段交易者设计。该指标由 (UZFX-LABS) 开发,融合了价格行为分析、趋势确认和智能过滤技术,可在所有货币对和时间周期内生成高概率的买卖信号、预警信号以及趋势延续机会。 别再对交易犹豫不决了,开始遵循这一专为追求清晰、精准和纪律性市场执行的交易者设计的结构化信号系统吧。 相信我,这是 MQL5 上最优秀的指标之一,所以千万不要错过!!“为睿智交易者打造的智能信号” 最新 5.0 版本现已发布,价格可能会在未事先通知的情况下上涨至 499.99 美元,所以请尽快入手,以免错失良机!! 最终购买前!如果您想获取免费试用版,请通过 WhatsApp 号码 +923030751987 联系我!! 如果您遇到任何问题“或”有任何不明白的地方,请在私聊中向我咨询!!! 主要功能更新 • 自动买入和卖出信号检测 • 先进的反转识别逻辑 • 潜在市场反转前的预警信号 • 趋势延续确认信号 • 内置风险管理功能,包含入场点、止损点、TP1、
Axiom Matrix
Issam Kassas
5 (6)
AXIOM MATRIX MT5 首发价格:$99 Axiom Matrix 现以 $99 的首发价格提供。 前 30 次购买完成后,价格将上涨至 $199。 购买后,请直接私信我,以获取使用说明并领取您的专属赠品奖励。 Axiom Matrix 是一款适用于 MetaTrader 5 的专业多品种、多时间周期市场扫描器和决策仪表板。 它会扫描您的 Market Watch,分析多个时间周期,读取多个证据引擎,比较最强的交易机会,并在一个清晰的矩阵仪表板中显示最佳 BUY、SELL、WAIT 或被阻止的状态。 我开发 Axiom Matrix,是因为我想要一个可以替我完成繁重市场扫描工作的工具。 我不想只单独检查 RSI。 然后单独检查 MACD。 然后检查移动平均线。 然后检查成交量。 然后检查波动率。 然后检查支撑和阻力。 然后还要手动在不同品种和时间周期之间切换,只为了建立一个交易思路。 我想要一个仪表板,可以扫描市场、比较证据、排序最佳机会,并告诉我现在最强的交易设置在哪里。 这就是 Axiom Matrix 背后的核心理念。 AXIOM MATRIX 的功能 Axiom Ma
Advanced Supply Demand MT5
Bernhard Schweigert
4.53 (15)
任何新手或专业交易者的最佳解决方案! 该指标是一款独特、高质量、且价格合理的交易工具,因为我们已经整合了许多专有功能和新公式。 依据此更新,您将能够显示双重时间帧区域。 您不仅可以显示一个较高的时间帧,还可以同时显示图表时间帧,加上更高的时间帧:显示嵌套时区。 供需双方所有交易者都会喜欢它。 :) 重要信息披露 高级供需的最大潜力,请访问 https://www.mql5.com/zh/blogs/post/720245   想象您的交易如何得以改善,是因为您能够精准定位入场或目标位吗? 构建于新的底层算法,它可以更轻松地识别出买卖双方之间的潜在失衡。 这是因为它以图形方式展示供需最强劲区域,及其过去的表现(显示旧区域)。 这些功能旨在帮助您更轻松地发现最佳入场区域和价位。 现在您可以针对您的交易品种和时间帧来优化和编辑区域强度! 高级供需指标适用于所有产品和时间帧。 它是一个新的公式,非常新的功能是两个区域强度函数可由用户输入进行调整! 这在交易中是一大优势。 当您学习如何使用专有功能,例如带有价格游离最小 X 因子的区域强度时,您能够判断该区域强劲与否。 供需区域用作警报触发器。
Crystal Heikin Ashi Signals
Muhammad Jawad Shabir
5 (4)
Crystal Heikin Ashi Signals - Professional Trend & Signal Detection Indicator Advanced Heikin Ashi Visualization with Intelligent Signal System for Manual & Automated Trading Final Price: $149 ---------> Price goes up $10 after every 10 sales . Limited slots available — act fast . Overview Crystal Heikin Ashi Signals is a professional-grade MetaTrader 5 indicator that combines pure Heikin Ashi candle visualization with an advanced momentum-shift detection system. Designed for both manual traders
Power Candles MT5
Daniel Stein
5 (10)
Power Candles V3 - 自我优化的强度指标 Power Candles V3 把货币与品种的强度直接转化为图表上可执行的交易方案。指标不再仅根据强度给K线着色,而是在后台持续运行实时自动优化,为您正面对的品种给出最佳 Stop Loss、Take Profit 与信号阈值。一键采用,Entry、Stop Loss、Take Profit 线就以精确价格绘制在图表上,提醒消息中直接包含方向。 本工具是 Stein Investments 生态系统的一部分 - 18+ 款工具,加上 Max,您的一对一 AI 交易导师。  随时在线,深入了解每一款指标,在您需要梳理思路的那一刻就在那里。  立即认识他: https://stein.investments 每根收盘K线运行 3,000+ 次交易模拟。9 种强度状态。2 种策略并行测试。一键采用最优配置。 为什么需要这个 大多数强度指标只给您一个数值,然后留下三个问题:相信哪个阈值、用哪个 Stop Loss、走哪个交易方向。Power Candles V3 在每根收盘K线上自动回答这些问题。结果就是一个完整的交易方案 -
Trend Catcher ind mt5
Ramil Minniakhmetov
5 (18)
趨勢捕捉指標 趨勢捕捉指標結合了作者獨有的客製化自適應趨勢分析指標,用於分析市場價格趨勢。它透過過濾掉短期噪音,並專注於潛在的動能強度、波動性擴張和價格結構行為,來識別真實的市場方向。此外,它還結合了平滑和趨勢過濾等客製化指標,例如移動平均線、相對強弱指標 (RSI) 和波動率過濾器。 您可以在這裡查看實際運行情況以及我的其他產品: https://www.mql5.com/en/users/mechanic/seller 請注意,我不會在 Telegram 上出售 EA 或任何設置,那是騙局。所有設定都可以在我的部落格上免費取得。 重要提示!購買後請立即聯繫我,以獲取使用說明和額外獎勵! 請注意,我不會在 Telegram 上出售 EA 或任何設置,那是騙局。所有設定都可以在我的部落格上免費取得。
TrendMaestro5
Stefano Frisetti
note: this indicator is for METATRADER4, if you want the version for METATRADER5 this is the link:  https://www.mql5.com/it/market/product/108106 TRENDMAESTRO ver 2.5 TRENDMAESTRO recognizes a new TREND from the start, he never makes mistakes. The certainty of identifying a new TREND is priceless. DESCRIPTION TRENDMAESTRO identifies a new TREND in the bud, this indicator examines the volatility, volumes and momentum to identify the moment in which there is an explosion of one or more of these da
SR Liquidity MT5
Oleg Rodin
5 (2)
SR Liquidity   是一款旨在揭示市场流动性高度集中且价格反应最剧烈的隐蔽区域的交易指标。这些特殊的流动性区域充当着强有力的支撑位与阻力位,为您清晰呈现市场最可能发生反转的位置。 SR Liquidity 指标并非简单地绘制常规的支撑/阻力线,而是通过分析实际的价格行为,识别买卖压力积聚的区域。这些区域实际上是推动市场真实波动的流动性池。通过在图表上直观呈现这些区域,该指标能助您在价格反应发生前预判走势——这意味着它实际上能够预测价格方向可能发生的变化。它将原始的价格行为转化为清晰且具实操价值的市场蓝图,标示出那些可能成为市场转折点的关键价位。 该指标适用于任何交易品种和时间周期——包括外汇、指数、金属、加密货币等。支持任意时间周期。 购买后请联系我,以获取交易指南及免费赠送的优质附加指标!
ATstrong
Zaha Feiz
ATSTRONG PRO: 市场结构与突破指标 突破检测引擎 | 5个动态TP目标 | 实时仪表板面板 | 不重绘 首发价格 当前价格: $59 — 每售出10份价格增加$10。 ATSTRONG PRO 是一款专为 MetaTrader 5 设计的高级突破和机构市场结构指标。 它能够检测高概率波段枢轴,识别集群的支撑和阻力堆积区,并实时发送结构破坏(BOS)和特征改变(CHoCH)信号。 该指标会自动在您的图表上绘制动态止损和5个不同的止盈水平(TP1到TP5), 并配有风险回报预测框、星级信号质量评级以及图表上的实时绩效分析仪表板。 交易提示: 这是一款用于手动交易和市场分析的指标。它在K线收盘时显示清晰的视觉信号、水平和警报,并且 完全不重绘 。它不执行自动交易。 核心亮点与特性 智能突破引擎: 同时检测集群水平区域突破和单波段枢轴突破(BOS / CHoCH)。 突破强度评分: 评估动能、成交量/K线实体大小和枢轴质量,以过滤虚假突破和诱多/诱空。 5阶段止盈水平: 预测可自定义的R倍数目标(TP1: 0.5R, TP2: 1.0R, TP3: 1.5R, TP4:
KURAMA GOLD SIGNAL PRO(MT5)— 7层过滤 · 自动止盈止损 · 质量评分 · 信号历史保存 | 完整的XAUUSD交易系统 实时不重绘。信号出现的瞬间,箭头、入场、止盈、止损当场锁定,之后绝不移动。你交易的就是这个实时信号。而且在v7.20中,每一个真正发出的信号都会自动保存,并在重启后精确还原。 购买者专属赠品 购买永久授权,即可免费获得 AI Zone Radar(价值$59)+ 完整PDF手册。在产品价格之外,额外附赠价值$59的赠品。购买后在MQL5上给我留言即可。 AI Zone Radar: https://www.mql5.com/en/market/product/175834 在黄金交易者社区中被实际使用,因精度与易用性而广受好评。 你的难题 —— 以及解决方案 黄金一天波动$30–$50。你知道机会就在那里。但这些情况是否似曾相识: - 入场太早,价格逆行$10后才朝你的方向
货币强度向导是一个非常强大的指标,为您提供成功交易的一体化解决方案。该指标使用多个时间范围内所有货币的数据来计算这个或那个外汇对的力量。此数据以易于使用的货币指数和货币电力线的形式表示,您可以使用它们来查看这种或那种货币的力量。 您所需要的只是将指标附加到您要交易的图表上,该指标将向您显示您交易的货币的真实强度。该指标还向您显示买卖量压力的极值,您可以在顺势交易时利用这些压力。该指标还显示了基于斐波那契的可能目标。该指标可用于各种交易时间范围。该指标支持各种货币对的交易。   该指标为您提供所有类型的警报,包括推送通知。 购买后请联系我。我将与您分享我的交易技巧,并免费为您提供丰厚的红利指标! 祝您交易愉快,获利丰厚!
Smc Pro ToolKit
Talal N Z Aljarusha
5 (10)
SMC PRO TOOLKIT — 智能资金分析与结构化交易规划 SMC Pro ToolKit 是一款面向 MetaTrader 5 的专业智能资金概念(Smart Money Concepts / SMC)分析工作空间。 它将市场结构、多周期分析、机构级价格区域、交易机会评估、确认工具、成交量背景、提醒系统和风险规划整合在一个结构清晰的图表环境中。 一个工作空间,多层确认,一套结构化交易计划。 打开完整用户指南 多条件交易机会引擎 SMC Pro ToolKit 的核心是一套 多条件交易机会引擎 。 该引擎不会依赖单一指标或单一市场事件,而是通过多个层面的市场信息,对潜在交易机会进行综合评估。 系统会分析市场结构和背景条件,将各项结果整合为 交易机会质量评分 ,并且只有在所需确认框架完整成立后,才会展示相应的交易思路。 市场背景 → 多周期一致性 → 智能资金区域 → 确认信号 → 质量评分 → 交易计划 当交易机会满足条件时,SMC Pro ToolKit 可以直接在图表上生成完整的交易计划,包括: 买入 / 卖出方向 入场价 止损价 止盈价 风险回报比 交易机会质量
作者的更多信息
EZT Macd Pro
Tibor Rituper
5 (4)
軟體說明 此指標可以在不同的時間範圍和設定上顯示 1 或 2 個 MACD 指標。 有一個使用 EMA 進行計算的免費版本。 此專業版使用所有 4 種移動平均類型進行計算:簡單、指數、平滑和線性加權。 活動指示器可以發出彈出、聲音、推播或電子郵件警報。 免費版本僅針對零電平交叉警報,如果使用者選擇該選項,則此專業版警報可以設定為零電平交叉或直方圖訊號線交叉。 可以在一個或兩個活動指標上設定警報,即使每個指標的時間範圍和週期不同。 當使用 2 個 MACD 指標時,警報可以分別對每個指標起作用。 主圖表上有一個帶有按鈕的顯示面板,顯示活動指標及其設定。 有一個選項可以隱藏此面板。 使用臨時按鈕,您可以隱藏活動的 MACD 之一 增加了免費版本所沒有的額外功能:分歧。 您可以選擇在兩個 MACD 上顯示背離。 您可以選擇常規背離或隱藏背離,也可以兩者兼有。 您可以選擇在直方圖或訊號線上顯示分歧。 您也可以只在 MACD 子視窗或價格圖表和 MACD 中顯示線條。 在價格圖表上,您也可以顯示背離箭頭。 您可以針對兩種類型的背離分別設定警報。 顏色和線條粗細選項的完全客製化。 設定
EZT Trend
Tibor Rituper
4.75 (4)
EZT 趋势指标将向您显示趋势、回调和入场机会。 提供可选的过滤和所有类型的警报。 添加电子邮件和推送通知警报。 我们还在开发基于该指标的 EA,即将推出。 它是一个多功能指标,由两个颜色直方图和一条线组成。 它是趋势方向和强度的直观表示,您也可以在线上或直方图上多次发现背离。 该指标与自动参数设置配合良好。 这些是针对给定时间范围预先确定的,我们建议使用具有该设置的指标。 在手动模式下,您可以设置自己的参数。 这是一个多时间框架 (mtf) 指标。 该指标与我们的其他指标(例如 MTF rsi 或 MTF cci 或 MACD pro)组合起来效果很好。 交易工具的波动性越大,您寻找最佳入场机会的时间范围就越小。 始终考虑更高的时间范围方向! 为此,您应该使用更多指标实例。 输入 参数模式:可选择“手动参数”或预设的“自动参数”。 自动参数处于多时间范围模式。 示例:当您设置自动 H1 参数时:您可以看到从 H1 时间范围一直到 1 分钟的相同显示。 在此设置中,指标不会在更高的时间范围(例如 H4 或更大)上显示。 手动时间范围:当在第一个菜单中选择手动参数时,您
This is a free version of our Great tool with limited functions. The ChartChanger is a great utility tool to reduce the number of open charts on your terminal. There is three section to it: Symbols, Time frames and Templates. You need only one chart to be open and still you can scroll up to multiple ones. Symbols: With the push of a button you can change from one symbol to another, and your applied indicators will stay on the next chart. For the symbols there is an auto detection mode, or you ca
FREE
This indicator can display 1-6 RSI indicator on different timeframes and settings. The active indicators can give visual and sound alert on oversold/overbought level if the user choose that option. Alert can be set on one or all active indicator, even if the timeframe, the period and the oversold/overbought level different on each.There is a display panel with buttons on the main chart, what is show the active indicators and their settings.There is an option to hide this panel. With the buttons
This indicator can display 1-3 CCI indicator on different time frames and settings. The active indicators can give visual and sound alert on oversold/overbought level if the user choose that option. Alert can be set on one or all active indicator, even if the time frame, the period and the oversold/overbought level different on each. There is a display panel with buttons on the main chart, what is show the active indicators and their settings. There is an option to hide this panel. With the butt
This indicator can display 1 or 2 MACD indicator on different time-frames and settings. Uses EMA for calculation. The active indicators can give visual and sound alert on zero-level-cross if the user choose that option. Alert can be set on one or both active indicator, even if the time-frame, and the period different on each. When alert set to both, the two MACD histogram must be on the same size of the 0 level to get an arrow. There is a display panel with buttons on the main chart, what is sho
ChartChanger 是一个很棒的实用工具,可以减少终端上打开的图表数量。它分为三个部分:符号、时间框架和模板。您只需要打开一张图表,并且仍然可以向上滚动到多个图表。 符号:只需按一下按钮,您就可以从一个符号更改为另一个符号,并且您应用的指标将保留在下一张图表上。对于符号有自动检测模式,或者您可以手动输入所需的符号。您可以使用全部 28 或低于该数字的任何数字。您可以使用 MetaTrader 拥有的任何符号:货币对、能源、指数、商品等。 时间范围:在面板中间添加了时间范围更改器功能。只需按一下按钮,您就可以更改为所需的时间范围,从 1 分钟图表到每月图表。 模板:该面板的第三个功能是模板更换器。九个内置模板,使用任何或都不使用。 所有按钮都位于自由浮动面板内。将光标放在面板的顶部,然后单击鼠标左键,您可以将面板自由移动到图表上的任何位置。您无法将面板移出价格图表窗口。 每三个部分都可以使用该部分右上角的“+”或“-”按钮折叠或展开。通过此功能,当面板不使用时,您可以最大限度地减少价格图表中占用的空间。 请注意:在一张图表中只能使用一个 ChartChanger。无法回溯测试。 C
這是一個多時間框架 Pin bar 警報指標。 您可以僅使用目前時間範圍,也可以使用從 1 分鐘到每月的所有時間範圍。 當您選擇所有時間範圍時,您會收到有關圖表開啟的當前時間範圍以及上面的時間範圍的警報。 每個選定的時間範圍分別有彈出視窗、電子郵件和推播通知警報。 此指標在價格圖表上放置一個箭頭。 對於看漲/多頭 Pin 棒,它位於價格線下方,對於看跌/空頭 Pin 棒,它位於價格線上方。 如果您只想獲取警報並且不希望圖表中充滿箭頭,只需選擇箭頭顏色:無 設定 要檢查的左側蠟燭數量:看跌 Pin Bar 應該是最高的,看漲應該是最低的才有效。 選擇左側的蠟燭數量,如果我們尋找看跌 Pin bar,則數量必須較低;如果我們尋找看漲 Pin bar,則數量必須較高。 最小主體/完整尺寸百分比:Pin bar 的最小主體尺寸。 最大主體/完整尺寸百分比:Pin bar 的最大主體尺寸。 最小長影線/全尺寸百分比:看跌 Pin bar 頂部有長影線,看漲 Pin bar 底部有長影線。 您可以選擇長燈芯的百分比。 顯示箭頭的蠟燭限制:傳回顯示箭頭的蠟燭數。 時間範圍選擇模式:目
EZT Engulfing
Tibor Rituper
這是一個多時間框架吞噬蠟燭警報指標。 您可以僅在當前時間範圍內使用,也可以在從 1 分鐘到每月的所有時間範圍內使用。 這是一個非重畫 MTF 指標。 當您使用選定的時間範圍選項(多時間範圍模式)時,您可以看到實際目前時間範圍及以上的訊號。 每個選定的時間範圍分別有彈出視窗、電子郵件和推播通知警報。 此指標在價格圖表上放置一個點。 對於看漲吞沒蠟燭來說,它位於價格線下方,對於看跌吞沒蠟燭來說,它位於價格線上方。 如果您只想獲取警報並且不希望圖表中充滿點,只需選擇箭頭顏色:無。 設定: 顯示箭頭的蠟燭限制:顯示箭頭/點的蠟燭數量。 時間範圍選擇模式:目前或選定的時間範圍。 吞噬過濾模式:「強官」、「官方」、「非官方」三種選擇。 所有三個選項都會考慮最後 20 根蠟燭的平均主體尺寸、最高價和最低價,以及吞沒蠟燭與前一根蠟燭的開盤價和收盤價。 也要考慮燭體和燭芯的尺寸。 三個選項有一點區別,常規吞噬請使用官方版本。 強官方:先前的蠟燭實體至少為最後 20 根蠟燭平均尺寸的 30%。 吞噬蠟燭的高點/低點必須與前一根蠟燭完全重疊。 官方:上一支蠟燭體至少為最後 20 支蠟燭平均
This is a great utility tool to see valuable information on your chart. The panel is free-floating, grab with your mouse and move around on the chart with ease. Also the panel is collapsible so you can save space, and you can see only the information you wish. There is three section to the panel, when is closed you can see the top section only. Here the list of information you can see on the panel, from the top to bottom: The first part of the panel: Price : The color is changing according to d
EZT Stochastic
Tibor Rituper
5 (2)
EZT_Stochastic   This is a Multi Timeframe stochastic indicator, with colored background. The colored background can be set to different colors based on the K and D line, (moving up, or down), and also about the position of the lines. In the oversold or overbought zones you can choose different colors.   Settings: You can choose the time-frame you want to see the stochastic. Set the regular parameters in a same way like in the original stochastic. Histogram style: The style. Histogram width: The
EZT_Ichimoku_MTF Multitimeframe Ichimoku indicator. Display up to 4 different Ichimoku on the chart. Every line of every ichimoku is customizable, you can turn off/on or choose different thickness or color. You can choose to see only the cloud in multiple ichimokus. Optional info panel to identify the different Ichimokus. Works the same way like the original Ichimoku indicator.
EZT Trade History This is a great tool to analyze past trades or follow current ongoing trades, especially when you using an EA to manage your transactions. You will see the exact candle where the trade was opened and closed. Collapsible floating panel on the chart, free to move anywhere with your mouse. When you using multiple EA’s with different magic numbers, you have 5 options to separate those trades, so you will know which EA opened specific transactions. You can set the day limits how fa
EZT Bollinger Trendline Indicator based on multiple settings of Bollinger Band. In the menu you can choose the similar settings than bollinger band indicator. Trend period and trend deviations. Also paint and arrow on chart when direction change. Three different kind of alert , such as pop up, e-mail and push notification. Try different settings on different timeframes. Please help my work and rate and comment my products!
The indicator predict the future candles direction, by scanning past candle movement. Based on the principal: “ The history repeat itself”. Programmed according to Kendall Correlation. In the settings menu, different scanning options are available. When the indicator find a match, start painting future candles from the current candle to the right, also from the current candle to the left as well, showing you the candle pattern what the actual signal is based on. The left side candle are optiona
筛选:
Aleksandr Tamonin
4107
Aleksandr Tamonin 2021.01.24 14:54 
 

用户没有留下任何评级信息

回复评论