My Account Brokers Details
- 指标
- 版本: 3.0
- 更新: 21 三月 2021
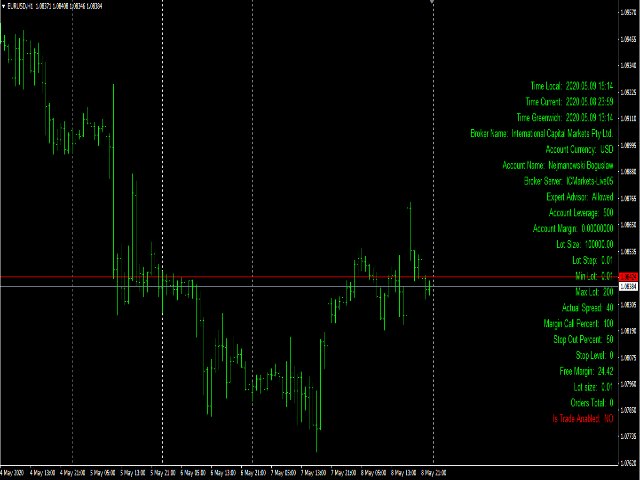
My Account Brokers Details
This indicator displays the account data and broker terms regarding its operation. For example, broker name, account number, financial leverage, account currency, automatic trading approval, minimum lot, lot step, maximum number of lot, margin call, stop out and many other important data. It is easier to display such data on the chart in one moment with a click of the mouse, than to look for it in the contract or call the broker.


Completely Valid; most appreciated!