Multicurrency Position Sizer

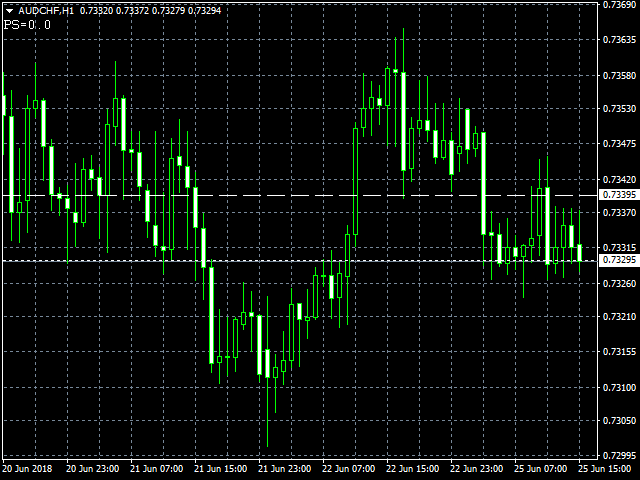
This indicator shows you position size according to your account size and risk.

If you want to calculate position size instantly and precisely, this indicator is for you.

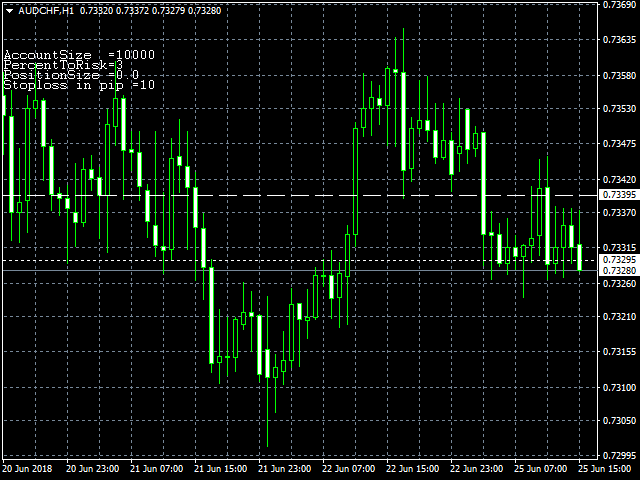
Difference between two horizontal line (HL) will be stop loss in pips.

Place HL at entry price and stop loss price, then you will get your position size.

Account currency: USD, JPY, EUR, GBP.

Working currency pairs:

EURUSD, GBPUSD, AUDUSD, NZDUSD, USDJPY, AUDJPY, EURJPY, NZDJPY, CADJPY, CHFJPY, GBPJPY, EURAUD, GBPAUD, EURNZD, AUDNZD, GBPCAD, USDCAD, NZDCAD, EURGBP, USDCHF, GBPCHF, EURCHF.


Input Parameters

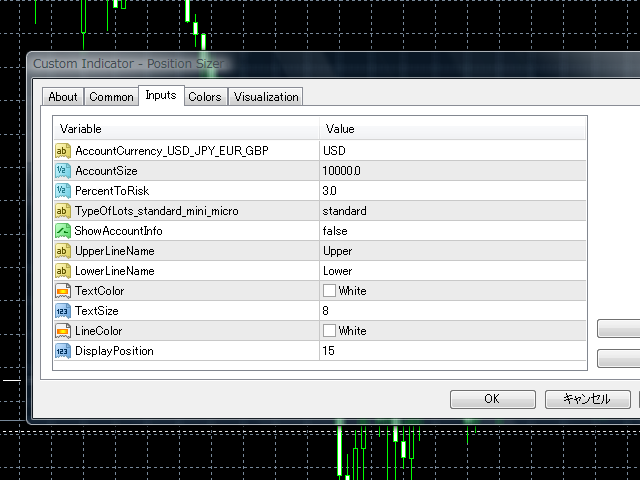
  • AccountCurrency_USD_JPY_EUR_GBP - Enter currency of your account.
  • AccountSize - Enter amount of money in your account.
  • PercentToRisk - Enter how much you will risk. For example, to risk 2% of money in your account, enter "2".
  • TypeOfLots_standard_mini_micro - Lots type. You can choose standard, mini or micro.
  • ShowAccountInfo - Shows your account's information.
  • UpperLineName - You can change upper HL name here.
  • LowerLineName - You can change lower HL name here.
  • TextColor - Color of text.
  • LineColor - Color of two HL.
  • Text Size - Size of text.
  • DisplayPosition - This defines where information will be shown.


How To Use

Enter AccountCurrency, AccountSize and PercentToRisk in parameter setting window.

Adjust two lines to set stop loss in pips.

Position size will be shown.
推荐产品
VSA Histogram
Richard Bystricky
VSA - P (Volume Spread Analysis) Period-Based Histogram is a tool that visually represents market volume dynamics using Volume Spread Analysis principles, with a focus on highlighting key volume changes over specific time periods. The histogram captures changes in volume and price spread relationships in real-time, enabling traders to detect early signals of accumulation, distribution, and shifts in buying or selling pressure. Indicator is non repainting and working with real-time on tick data.
Price Magnets
Ivan Simonika
Price Magnet — Price Density and Attraction Levels Indicator Price Magnet is a professional analytical tool designed to identify key support and resistance levels based on statistical Price Density. The indicator analyzes a specified historical period and detects price levels where the market spent the most time. These zones act as “magnets,” attracting price action or forming a structural base for potential reversals. Unlike traditional Volume Profile tools, Price Magnet focuses on price-time d
The indicator detects and displays 3 Drives harmonic pattern (see the screenshot). The pattern is plotted by the extreme values of the ZigZag indicator (included in the resources, no need to install). After detecting the pattern, the indicator notifies of that by a pop-up window, a mobile notification and an email. The indicator highlights the process of the pattern formation and not just the complete pattern. In the former case, it is displayed in the contour triangles. After the pattern is com

The indicator detects and displays Shark harmonic pattern (see the screenshot). The pattern is plotted by the extreme values of the ZigZag indicator (included in the resources, no need to install). After detecting the pattern, the indicator notifies of that by a pop-up window, a mobile notification and an email. The indicator highlights the process of the pattern formation and not just the complete pattern. In the former case, it is displayed in the contour triangles. After the pattern is comple
Basic Theme Builder
Mehran Sepah Mansoor
5 (1)
基本主题构建器:简化您的图表自定义 通过   基本主题构建器   指标,彻底改变您的交易体验。这款多功能工具旨在简化您在MetaTrader 4 平台上自定义图表外观的过程。该指标提供了一个用户友好的面板,您可以轻松切换不同的主题和配色方案,提升交易环境的视觉吸引力和功能性。   Free MT5 version 基本主题构建器   指标是那些希望轻松个性化MetaTrader 4图表的交易者的终极工具。通过其简单的面板界面和各种主题预设,您可以迅速调整图表的外观,以匹配您的交易风格或心情。无论您偏爱经典外观还是现代美学,基本主题构建器提供了一系列选项,以增强您的视觉体验并提高专注度。立即优化您的交易设置,体验这款实用且易于使用的指标。 主要特点: 轻松管理主题:   使用便捷的面板界面,单击即可快速更改图表主题。 预定义预设:   从几种预配置的主题和配色方案中进行选择,包括经典、深色、浅色等,以适应您的交易偏好。 可自定义选项:   调整颜色和样式,按您的喜好定制图表外观。 用户友好界面:   享受简单直观的设计,无需复杂设置或配置。 提升交易专注度:   通过视觉吸引力强且无
FREE
Rainbow Price Visualizer
Vincent Jose Proenca
Rainbow Price Visualizer v1.21 See where the market really breathes. Turns your MT4 chart into an ultra-precise heatmap that highlights price zones favored by big players. Why it matters 300 price levels at 0.2‑pip resolution — microscopic detail. 8 visual themes (Rainbow, Fire, Ocean…) for instant readibility. Smart opacity: low noise fades, real zones pop. Lightweight rendering with automatic cleanup. Fully customizable: saturation, opacity, resolution, history depth. Bands project into the f
Auto Fibo Pro m
DMITRII GRIDASOV
“Auto FIBO Pro” Crypto_Forex 指标 - 是交易中的绝佳辅助工具! - 指标自动计算并放置在图表斐波那契水平和局部趋势线(红色)上。 - 斐波那契水平指示价格可能反转的关键区域。 - 最重要的水平是 23.6%、38.2%、50% 和 61.8%。 - 您可以将其用于反转剥头皮或区域网格交易。 - 还有很多机会可以使用 Auto FIBO Pro 指标来改进您当前的系统。 - 它具有信息价差掉期显示 - 它显示所连接的外汇对的当前价差和掉期。 - 显示屏还显示账户余额、净值和保证金。 - 可以将信息价差掉期显示定位在图表的任何角落 . 点击这里查看高质量的交易机器人和指标! 这是仅在此 MQL5 网站上提供的原创产品。 ...............................................
The indicator detects and displays М. Gartley's Butterfly pattern. The pattern is plotted by the extreme values of the ZigZag indicator (included in the resources, no need to install). After detecting the pattern, the indicator notifies of that by the pop-up window, a mobile notification and an email. The pattern and wave parameters are displayed on the screenshots. The default parameters are used for demonstration purposes only in order to increase the amount of detected patterns. Parameters z
News Scalping Executor Pro is an utility which helps to trade high impact and huge volatility   news . This utility helps to create two opposite orders with risk management and profit protection. It moves automatically stop loss level to avoid losses as much as possible by using many different algorithms. It helps to avoid trading the news if spread suddenly becomes very huge. It can lock profit by moving stop loss or partially closing of orders. To be profitable with this type of trading you
Trend PA
Mikhail Nazarenko
5 (3)
The Trend PA indicator uses   Price Action   and its own filtering algorithm to determine the trend. This approach helps to accurately determine entry points and the current trend on any timeframe. The indicator uses its own algorithm for analyzing price changes and Price Action. Which gives you the advantage of recognizing, without delay, a new nascent trend with fewer false positives. Trend filtering conditions can be selected in the settings individually for your trading style. The indicator
PZ Penta O MT4
PZ TRADING SLU
2.33 (3)
The Penta-O is a 6-point retracement harmonacci pattern which usually precedes big market movements. Penta-O patterns can expand and repaint quite a bit. To make things easier this indicator implements a twist: it waits for a donchian breakout in the right direction before signaling the trade. The end result is an otherwise repainting indicator with a very reliable trading signal. The donchian breakout period is entered as an input. [ Installation Guide | Update Guide | Troubleshooting | FAQ | A
FREE
Italo Levels Indicator
Italo Santana Gomes
5 (9)
BUY INDICATOR AND GET EA FOR FREE AS A BONUS + SOME OTHER GIFTS! ITALO LEVELS INDICATOR  is the best levels indicator ever created, and why is that? Using high volume zones on the market and Fibonacci the Indicator works on all time-frames and assets, indicator built after 7 years of experience on forex and many other markets. You know many levels indicators around the internet are not complete, does not help, and it's difficult to trade, but the   Italo Levels Indicator is different , the Ital
New Bar Alarm Free
Tomoyuki Nakazima
This indicator alerts you when/before new 1 or 5 minute bar candle formed. In other words,this indicator alerts you every 1/5 minutes. This indicator is especially useful for traders who trade when new bars formed. *This indicator don't work propery in strategy tester.Use this in live trading to check functionality. There is more powerful Pro version .In Pro version,you can choose more timeframe and so on. Input Parameters Alert_Or_Sound =Sound ----- Choose alert or sound or both to notify y
FREE
Dollar Mint Indicator
David Mwaniki Mbugua
Dollar mint indicator is a special workmanship with years of experience in forex.   Dollar mint ea is a fully non repaint indicator optimised with price action data such that once it gives you a signal t . The indicator   can be used to trade anything on the mt4 with much ease. Benefits ; Fully non repaint Use in any timeframe Use in all the available tradable assets on mt4 Best to use on h4. It generates fully analysed buy and sell signals based on trend and also filters out retracements and
LordChannel
Igor Pereira Calil
LordChannel is an indicator for META TRADER 4 for all forex pairs and financial market metals. The indicator is used to make detections of high/low channels, implementing a technical analysis on possible breakouts and making correct order entries. LordChannel sends signals such as buy and sell in the graphical analysis, it is important to emphasize that the importance of these signals are safe in TIME FRAMES M30, H1, H4. The indicator was created for using bullish/downtrend channels to compl
Italo Trend Indicator
Italo Santana Gomes
4.74 (34)
BUY INDICATOR AND GET EA FOR FREE AS A BONUS + SOME OTHER GIFTS! ITALO TREND INDICATOR  is the best trend indicator on the market, the Indicator works on all time-frames and assets, indicator built after 7 years of experience on forex and many other markets. You know many trend indicators around the internet are not complete, does not help, and it's difficult to trade, but the Italo Trend Indicator is different , the Italo Trend Indicator shows the signal to buy or sell, to confirm the signal t
Double HMA lines MTF
Pavel Zamoshnikov
5 (2)
This is a multi-timeframe version of the popular Hull Moving Average (HMA). The Double HMA MTF Light indicator combines two timeframes on a single chart. The HMA of the higher timeframe defines the trend, and the HMA of the current timeframe defines short-term price movements. The indicator is freely distributed and hasn't audio signals or messages. Its main function is the visualization of price movements. If you need advanced functionality of the HMA multi-timeframe indicator (information ab
FREE
History Pattern Search
Yevhenii Levchenko
该指标建立当前报价,可以与历史报价进行比较,并在此基础上进行价格走势预测。指示器有一个文本字段,用于快速导航到所需日期。 选项: 符号 - 选择指标将显示的符号; SymbolPeriod - 选择指标从中获取数据的时段; IndicatorColor - 指示器颜色; HorisontalShift - 由指标绘制的报价移动指定的柱数; Inverse - true 反转引号,false - 原始视图; ChartVerticalShiftStep - 图表垂直移动(键盘上的向上/向下箭头); 接下来是文本字段的设置,您可以在其中输入日期,您可以通过按“回车”立即跳转到该日期。 接下来是文本字段的设置,您可以在其中输入日期,您可以通过按“回车”立即跳转到该日期。
Market Profile 3
Hussien Abdeltwab Hussien Ryad
3 (2)
Market Profile 3 MetaTrader 4 indicator  — is a classic Market Profile implementation that can show the price density over time, outlining the most important price levels, value area, and control value of a given trading session. This indicator can be attached to timeframes between M1 and D1 and will show the Market Profile for daily, weekly, monthly, or even intraday sessions. Lower timeframes offer higher precision. Higher timeframes are recommended for better visibility. It is also possible t
FREE
The indicator analyzes the change in the minimum and maximum prices of the previous bars fixing the entrance of the big players. If the change (delta) increases, a signal is displayed on the graph in the form of an arrow. At the same time, virtual trade on history is carried out. In the free version, virtual trade is performed without refills in case of a repeat of the signal. The results of virtual trading in the form of losses / losses, profitability, drawdown and transaction lines are display
FREE
VR Grid
Vladimir Pastushak
5 (3)
VR 网格指示器 设计 用于创建具有用户定义设置的图形网格。与 标准网格 不同,VR 网格用于构建 圆形关卡 。根据用户的选择,轮次级别之间的步长可以是任意的。此外,与其他指标和实用程序不同,即使时间段发生变化或终端重新启动,VR Grid 也能保持网格的位置 。 设置、设置文件、演示版本、说明、问题解决,可以从以下位置获取 [博客] 您可以在以下位置阅读或撰写评论 [关联] 版本为 [MetaTrader 5] 垂直级别 基于实际时间间隔并 忽略缺失 或不存在的周期。因此,级别之间的步长严格对应于用户选择的值。 使用 VR 网格指标时,交易者 可以更改任何级别的垂直线和水平线的样式 、颜色和粗细。这使您可以控制金融工具的 回合水平 。 整数位是 以两个或多个零结尾 的价格(例如:1.23500、5.65900、1923.200)。人们相信,这样的水平 经常充当 作为支撑或阻力的强点。 Horizontal line settings Horizontal line step Horizontal line color Horizontal line style Horizonta
FREE
MarketProfile EForex
Veridiana Adorno Kendrick
Market Profile Shows where the price has spent more time, highlighting important levels that can be used in trading. It is a powerful tool which is designed to take the fundamental components which comprise every market; price/volume/time, and visually display their relationship in real-time as the market develops for a pre-determined time period. Very powerful tool!
Multi TF MA Levels
Luke Anthony Caras
Multi-TF MA Levels plots a single moving average across multiple timeframes directly on your chart, giving you instant context at every level of the market. No switching charts. No mental maths. Just clean, flat lines showing exactly where the MA sits on M15, M30, H1, H4 and D1 — all updated on confirmed bar close so there is no repainting. Features Plots the local timeframe MA plus up to 5 higher timeframe MAs simultaneously HTF lines only update on confirmed bar close — no repainting Higher ti
FREE
Zig Zag 123
Stephen Reynolds
Zig Zag 123 tells us when a reversal or continuation is more likely by looking at the shift in supply and demand. When this happens a signature pattern appears known as 123 (also known ABC) will often break out in direction of higher low or lower high. Stop loss and take profit levels have been added. There is a panel that shows the overall performance of your trades for if you was to use these stop loss and take profit levels.  We get alerted if a pattern 123 appears and also if the price re
FREE
BoxInside MT4
Evgeny Shevtsov
4.83 (6)
This indicator calculates the volume profile and places labels that correspond to the VAH, VAL and POC levels, for each candle individually. Indicator operation features The indicator works on the timeframes from M5 to MN, but it uses the history data of smaller periods: M1 - for periods from M5 to H1, M5 - for the H4 period, M30 - for the D1 period, H4 - for the W1 period, D1 - for the MN period. The color and location of the VAL, VAH and POC labels on the current candle are considered to be c
FREE
Cumulative Delta MT4
Evgeny Shevtsov
4.86 (29)
The indicator analyzes the volume scale and splits it into two components - seller volumes and buyer volumes, and also calculates the delta and cumulative delta. The indicator does not flicker or redraw, its calculation and plotting are performed fairly quickly, while using the data from the smaller (relative to the current) periods. The indicator operation modes can be switched using the Mode input variable: Buy - display only the buyer volumes. Sell - display only the seller volumes. BuySell -
FREE
Traditional MACD MT4
Daniel Lewis
4.59 (56)
MetaTrader 4/5 中的 MACD 指标看上去与其它许多图表软件里的 MACD 不同。这是因为 MetaTrader 4/5 版本的 MACD 显示 MACD 曲线作为直方图,而传统上显示为曲线。此外,MetaTrader 4/5 版本使用 SMA 计算信号线,而根据 MACD 的定义,它应该使用 EMA。MetaTrader 4/5 版本也不计算实际的 MACD 直方图 (即 MACD 与信号线之间的差异)。这可能对那些 MetaTrader 4/5 的新手带来困惑,因为将 MACD 线显示为直方图,而未提供实际的 MACD 直方图。 这款指标按照其创造者 (Gerald Appel) 的定义显示 MACD,如同其它图表软件里显示的那样。而 MACD 线的计算采用 "快速" EMA 和 "慢速" EMA 之间的差异。信号线是 MACD 线的 EMA。MACD 直方图是MACD 和信号线之间的差异 (MACD 直方图可自行作为可靠的用作背离信号)。 True/False 启用开关,您可以显示/隐藏 MACD/信号线,以及 MACD 直方图。
FREE
Volume Magic
Denys Babiak
3.67 (3)
Description Volume Magic is an indicator that shows the value of the relative volume in conjunction with the direction of the current trend. The ratio of the current volume relative to the average volume for a certain period is displayed in the lower window as an oscillator. The direction of the current trend is displayed as two-color trend lines. How to use? First, use two-color trend lines to determine the direction of the current trend. Then look for areas of low volume and open positions
AP VWAP Bands Pro (MT4) Volume-weighted average price with ±σ bands for clear intraday bias, mean-reversion zones, and dynamic support/resistance. Works on crypto (incl. BTC), FX, indices, and metals. Uses tick-volume when real volume isn’t available. What it shows VWAP line (volume-weighted mean price). Two envelopes around VWAP (default ±1σ and ±2σ) to highlight balance vs. extension. Reset modes: Day, Week, or Anchor Time (HH:MM) to start VWAP where you need it (e.g., exchange open). Why
FREE
Enhanced Volume Profile: The Ultimate Order Flow & Liquidity Analysis Tool Overview Enhanced Volume Profile   is an indicator for MetaTrader 5 that displays the traded volume at specific price levels over a defined period. It separates the total volume into buy and sell components, presenting them as a side-by-side histogram on the chart. This allows users to observe the volume distribution and the proportion of buy and sell volumes at each price level. Graphics Rendering The indicator uses t
FREE
该产品的买家也购买
Trend SniperX MT4
Sarvarbek Abduvoxobov
5 (2)
Trend Sniper X 是一款用于 MetaTrader 5 的多周期趋势追踪指标,旨在帮助交易者清晰、精准地识别趋势方向及潜在的反转点。 适用于 MT5: https://www.mql5.com/en/market/product/181101 价格信息: 当前价格为促销价,随着后续更新和新功能的推出,价格可能会发生变动。 Code2Profit 频道 通过多周期分析掌控市场! 如何使用 Trend Sniper X 最大化胜率:关键规则与交易时段技巧 技术规格 交易平台 MetaTrader 5 指标类型 多周期趋势指标 运行时间周期 任意图表周期,支持独立选择更高周期(M1–MN1) 主要交易品种 外汇、黄金 (XAUUSD) 及其他 CFD 差价合约 推荐账户 任何账户类型 可视化呈现 彩色趋势 K 线(买入/卖出/弱势/转变)+ 买入/卖出信号箭头 附加模块 市场交易时段框(悉尼、东京、伦敦、纽约) 核心功能 多周期趋势分析: 将更高周期的趋势方向直接投影到当前图表上,提供清晰的宏观视角。 弱势/不确定 K 线检测: 高亮显示趋势状况不明确的 K 线,帮助交易者远离震
SR Liquidity
Oleg Rodin
5 (2)
SR Liquidity 是一款旨在揭示市场流动性高度集中且价格反应最剧烈的隐蔽区域的交易指标。这些特殊的流动性区域充当着强有力的支撑位与阻力位,为您清晰呈现市场最可能发生反转的位置。 SR Liquidity 指标并非简单地绘制常规的支撑/阻力线,而是通过分析实际的价格行为,识别买卖压力积聚的区域。这些区域实际上是推动市场真实波动的流动性池。通过在图表上直观呈现这些区域,该指标能助您在价格反应发生前预判走势——这意味着它实际上能够预测价格方向可能发生的变化。它将原始的价格行为转化为清晰且具实操价值的市场蓝图,标示出那些可能成为市场转折点的关键价位。 该指标适用于任何交易品种和时间周期——包括外汇、指数、金属、加密货币等。支持任意时间周期。 购买后请联系我,以获取交易指南及免费赠送的优质附加指标!
M1 Sniper
Oleg Rodin
4.97 (30)
M1 SNIPER 是一款易于使用的交易指标系统。它是一个专为 M1 时间框架设计的箭头指标。该指标可以作为独立的系统在 M1 时间框架下进行剥头皮交易,也可以作为您现有交易系统的一部分使用。虽然该交易系统专为 M1 时间框架交易而设计,但它也可以用于其他时间框架。我最初设计此方法是为了交易 XAUUSD 和 BTCUSD。但我发现这种方法在其他市场交易中也同样有用。 指标信号既可以顺势交易,也可以逆势交易。我教授一种特殊的交易技巧,帮助您利用指标信号进行双向交易。该方法基于使用特殊的动态支撑位和阻力位区域。 购买后,您可以立即下载 M1 SNIPER 箭头指标。此外,我还为所有 M1 SNIPER 工具用户免费提供下方屏幕截图所示的 Apollo Dynamic SR 指标!这两个指标的组合可以帮助您更轻松、更准确地利用 M1 时间框架进行交易。 购买后请联系我,免费获取交易提示和奖励指标! 祝您交易成功!
Smart Trend Trading System
Issam Kassas
4.8 (10)
本产品已针对 2026 年市场进行更新,并针对最新 MT5 版本进行了优化。 价格更新通知: Smart Trend Trading System 目前价格为 $99 。 接下来的 30 次购买 后,价格将上涨至 $199 。 特别优惠: 购买 Smart Trend Trading System 后,请发送私信给我,即可免费领取 Smart Universal EA ,并将您的 Smart Trend 信号转换为自动交易。 Smart Trend Trading System 是一套完整的交易系统,具备不重绘、不回绘、不延迟的特点,专为希望获得更清晰信号、更准确趋势方向以及更有组织交易方式的交易者打造。 Online course , manual and [download presets] . 它将 10 多种交易工具 整合到一个系统中,包括趋势检测、反转区域、Smart Cloud、移动止损逻辑、支撑与阻力、K线着色、提醒以及多周期分析。 该系统旨在帮助您应对不同的市场环境: 趋势市场: 识别主要趋势,发现回调,跟随动能,并通过止损指导和移动止损选项寻找更清晰的入场机会。
Quantum Breakout Indicator PRO
Bogdan Ion Puscasu
4.96 (26)
介绍     Quantum Breakout PRO   ,突破性的 MQL5 指标,正在改变您交易突破区域的方式!   Quantum Breakout PRO 由拥有超过 13 年交易经验的经验丰富的交易者团队开发,旨在通过其创新和动态的突破区域策略将您的交易之旅推向新的高度。 量子突破指标将为您提供带有 5 个利润目标区域的突破区域的信号箭头,以及基于突破框的止损建议。 它既适合新手交易者,也适合专业交易者。 量子 EA 通道:       点击这里 MT5版本:   点击这里 重要的!购买后请私信我领取安装手册。 建议: 时间范围:M15 货币对:GBPJPY、EURJPY、USDJPY、NZDUSD、XAUUSD 账户类型:ECN、Raw 或 Razor,点差极低 经纪商时间:GMT +3 经纪商:IC Markets、Pepperstone with Raw 和 Razor 的点差最低 规格: 不重漆! 最多 5 个建议利润目标区域 建议止损水平 可定制的盒子。您可以设置自己的 Box Time Start 和 Box Time End。 接触 如果您
目前八折优惠! 对任何新手或专家交易者来说都是最好的解决方案! 这个仪表板软件适用于28种货币对。它基于我们的两个主要指标(高级货币强度28和高级货币冲动)。它对整个外汇市场提供了一个伟大的概述。它显示高级货币强度值,货币运动速度和28个外汇对在所有(9)时间段的信号。想象一下,当你可以使用图表上的单一指标观察整个市场,以确定趋势和或剥头皮的机会时,你的交易将得到改善 我们已经在这个指标中建立了一些功能,使你更容易识别强势和弱势货币,同时识别和确认潜在的交易。该指标以图形方式显示货币的强势或弱势是增加还是减少,以及它在所有时间段的表现。 增加的新功能是动态市场斐波那契水平,它适应当前的市场条件变化,这是一个已经在我们的高级货币强度28和高级货币冲动指标中使用的成熟的加分项。 在交易时,总是将弱势货币和强势货币配对,这个新指标将帮助你做到这一点。 用户手册:点击这里  https://www.mql5.com/en/blogs/post/708783 特点  显示每个时间段的ACS28和GAP-speed(冲动)的货币强度值。 列:颜色代码以7种颜色显示货币强度:强势
DayTrader PRO MT4
Davit Beridze
4.56 (9)
DayTrader PRO MT5:  https://www.mql5.com/en/market/product/186222 DayTrader PRO 是一款先进的交易指标,它结合了约翰·埃勒斯 (John Ehlers) 的 Laguerre 滤波器与强大的自动优化引擎。该指标不依赖固定的参数,而是根据最新的市场状况自动搜寻最佳设置,帮助您在无需手动调整的情况下适应不断变化的市场波动。 该指标可生成清晰的买入 (BUY) 和卖出 (SELL) 信号,并提供根据当前市场波动率计算得出的自适应止损 (Stop Loss) 和止盈 (Take Profit) 水平。内置的趋势、效率系数 (Efficiency Ratio)、波动率和蜡烛图过滤功能,有助于剔除低质量的交易设置,从而提高信号的准确性。 实时性能面板会显示当前已优化的设置、利润因子 (Profit Factor)、胜率 (Win Rate)、回撤 (Drawdown) 以及其他交易统计数据。DayTrader PRO 还支持弹出窗口、推送、邮件和声音提醒,确保您不会错过任何交易机会。 主要功能 全自动参数优化 自适应买入
CRT Candle Range Theory HTF MT4 - Ultimate CRT Indicator: 高级ICT概念与马来西亚SnR交易系统 使用最先进的 Candle Range Theory 指标掌握做市商的足迹。释放 Smart Money Concepts (SMC) 的真正力量,并使用 Ultimate CRT Indicator 像机构一样精确交易。该指标专为严肃的交易者打造,自动化了高效的蜡烛范围理论 (CRT)——ICT概念 (Inner Circle Trader) 的核心支柱,并通过马来西亚支撑与阻力 (SnR) 入场方法和 FVG (不平衡) 区域的致命精度对其进行了强化。 无论您是在 MT4 或 MT5 上交易外汇、加密货币还是指数,该算法都能消除市场噪音,过滤虚假突破,并将高概率、高回报的交易区域直接传送到您的图表上。 CRT Indicator 的核心功能: Absolute Extreme SnR Entry Engine: 与依赖滞后吞没形态的传统指标不同,我们的系统采用了马来西亚 SnR 技术。它在严格的时间窗口内扫描绝对最高的 Buy-
Currency Strength Wizard
Oleg Rodin
4.85 (60)
货币强度向导是一个非常强大的指标,为您提供成功交易的一体化解决方案。该指标使用多个时间范围内所有货币的数据来计算这个或那个外汇对的力量。此数据以易于使用的货币指数和货币电力线的形式表示,您可以使用它们来查看这种或那种货币的力量。 您所需要的只是将指标附加到您要交易的图表上,该指标将向您显示您交易的货币的真实强度。该指标还向您显示买卖量压力的极值,您可以在顺势交易时利用这些压力。该指标还显示了基于斐波那契的可能目标。该指标可用于各种交易时间范围。该指标支持各种货币对的交易。 该指标为您提供所有类型的警报,包括推送通知。 购买后请联系我。我将与您分享我的交易技巧,并免费为您提供丰厚的红利指标! 祝您交易愉快,获利丰厚!
成交量突破震荡指标是一种以震荡指标的形式将价格变动与成交量趋势相匹配的指标。 我想将成交量分析整合到我的策略中,但大多数成交量指标都令我失望, 例如 OBV、资金流量指数、A/D,还有成交量加权 Macd 和许多其他指标。 因此,我为自己编写了这个指标,我对它的实用性感到满意,因此我决定将其发布到市场上。 主要特点: 它突出显示了价格在成交量增加(突破)支持下朝某个方向移动的阶段。 它突出显示了成交量增加停止并因此市场收缩的阶段。 它突出显示了价格和成交量均未移动的阶段,尤其是在时间范围(<=15 分钟)的日内交易中,因此市场已为未来的运行做好准备。 当其他 EA 交易程序发出的虚假信号不受交易量增加的支持时,可过滤掉这些信号。 它使趋势和范围阶段可视化变得非常容易 输入参数: 计算设置: 计算类型:快速、正常、慢速,用于监控短期、中期和长期,保持在同一时间范围内。 计算周期:计算周期 交易量设置: 交易量类型:TickVolume(主要用于外汇)和RealVolume(用于股票市场) 信号设置: 信号周期:信号线周期 突破水平:突破信号的阈值水平 警报设置 警报类型:收盘
Neuro Poseidon MT4
Daria Rezueva
4.74 (46)
Neuro Poseidon is a new indicator by Daria Rezueva. It combines precise trading signals with adaptive TP/SL levels - creating best possible trades as a result! Message me and get  Neuro Poseidon Assistant  as a gift to automize your trading process! What makes it stand out? 1. Proven profitability on all assets and timeframes 2. Only confirmed BUY and SELL signals present on the chart 3. Adaptive TP & SL levels generated by the software for each trade 4. Easy to understand - suitable for all
Gann Made Easy
Oleg Rodin
4.84 (172)
Gann Made Easy 是一个专业且易于使用的外汇交易系统,它基于使用先生理论的最佳交易原则。 W.D.江恩。该指标提供准确的买入和卖出信号,包括止损和获利水平。您甚至可以使用推送通知在旅途中进行交易。 购买后请联系我,即可免费获得交易指导和超棒的额外指标! 您可能已经多次听说过江恩交易方法。通常 Gann 的理论不仅对于新手交易者而且对于那些已经有一定交易经验的人来说都是非常复杂的东西。这是因为江恩的交易方法在理论上并不那么容易应用。我花了几年时间来完善这些知识,并将最好的原则应用到我的外汇指标中。 该指标非常易于应用。您所需要的只是将其附加到您的图表并遵循简单的交易建议。该指标不断进行市场分析工作并寻找交易机会。当它检测到一个好的入口点时,它会为您提供一个箭头信号。该指标还显示止损和获利水平。 换句话说,当您像先生一样进行交易时,该指标会为您提供最佳江恩建议。江恩亲自告诉你此时此刻该做什么。但最好的部分是您不需要了解任何有关江恩交易原则的知识,因为该指标会为您完成整个市场分析工作。
PRO Renko System
Oleg Rodin
5 (31)
PRO Renko Arrow Based System for trading renko charts.  准确的信号交易任何外汇工具. 另外,我将免费提供系统的附加模块! PRO Renko系统是RENKO图表上高度准确的交易系统。该系统是通用的。 该交易系统可应用于各种交易工具。 该系统有效地中和了所谓的市场噪音,打开了获得准确反转信号的通道。 该指标易于使用,只有一个参数负责产生信号。 您可以很容易地使算法适应您感兴趣的交易工具和renko酒吧的大小。 我很乐意通过提供任何咨询支持来帮助所有客户有效地使用该指标。 祝您交易成功!购买后,立即写信给我! 我将与您分享我的建议和我的renko发电机。 另外,我将免费提供系统的附加模块!
PZ Support Resistance
PZ TRADING SLU
3.33 (3)
厌倦了绘制支撑线和阻力线? 支撑阻力 是一个多时间指标,可以自动检测并绘制图表中的支撑线和阻力线,并具有非常有趣的变化:随着时间的推移测试价格水平及其重要性的提高,线变得越来越粗。 [ 安装指南 | 更新指南 | 故障排除 | 常见问题 | 所有产品 ] 一夜之间增强您的技术分析 无需浏览图表即可检测重要的价格水平 一目了然地识别所有价格水平的相对优势 每次交易最多可节省半小时的绘图线 指标显示所有价格水平的期限 指示器不重涂 过去和现在的价格水平因接近程度而崩溃,并根据当前的市场行为进行了调整。在动作发生的地方绘制了线条,而不一定在峰值处绘制了线条。 价格水平随着时间的推移而被拒绝,变得越来越暗 定期清除不重要的价格水平以避免噪音 可自定义的时间范围选择和崩溃因子 它实现了电子邮件/声音/推送警报的突破 输入参数 指标设置:指标将从当前时间段读取价格,但您可以选择另一个。例如,您可以在H4图表中显示D1支撑线和阻力线。您还可以使用 价格水平密度 参数选择在图表上显示多少价格水平。 颜色设置:根据重要性输入所需的支撑线和阻力线颜色。 标签设置:(可选)可以在指示器中显示用于
Zoryk Gold mt4
Reda El Koutbane
5 (1)
折扣将在 24 小时后结束——下一价格为 69 美元 联系我获取推荐设置 首发名额有限 ZORYK — MetaTrader 4 专业 XAUUSD 黄金信号与交易计划系统 你一定经历过这种感觉。 你花时间分析黄金,等待入场,终于打开交易后,价格却立即向相反方向移动。你过早平仓,移动止损,或者因为犹豫几秒而错过机会。随后市场在没有你的情况下,准确到达你最初预期的目标。 问题并不总是方向错误。 真正的问题是不确定性。 你不知道真正的入场位置在哪里,不知道交易逻辑在什么位置失效,也不知道应该先保护较小的利润,还是继续等待更大的行情。你甚至不知道当前信号是否足够强,还是自己只是在勉强寻找一笔交易。 黄金移动速度非常快。没有明确计划的正确判断,也可能在几秒钟内变成错误决定。 ZORYK 正是为了解决这个问题而开发。 什么是 ZORYK ZORYK 是一套专门为 MetaTrader 4 和 XAUUSD M5 周期开发的完整黄金信号与交易计划系统。 它不是一个只显示 BUY 或 SELL 箭头,然后让你独自处理所有后续决定的普通指标。 每个确认信号都可以在图表上显示
Reversal Master
Alexey Minkov
4.81 (16)
Reversal Master 帮助你判断当前价格的运行方向,并在图表上找出潜在的反转点。它专为那些在下单前想更清楚地看懂行情的交易者而设计。你可以把它当作独立工具使用,也可以作为现成交易系统的补充,或者作为开发自有策略的基础模块。 为了定位反转点,Reversal Master 会同时评估多个市场条件,因为综合分析比任何单一因素都能给出更完整的画面。指标会分析 Price Action 形态、成交量、品种的平均波动幅度以及超买/超卖水平,然后标出可能正在形成反转的位置。 购买后请直接联系我,我会提供带示例的详细说明,以及在你自己的 EA 中正确调用该指标的方法。 主要功能 自动识别图表上潜在的趋势反转点。 两种内置工作模式:Mode-1(经典算法)和 Mode-2(更新的反转识别算法)。 内置统计:显示历史中每笔仓位的潜在结果(Mode-2 下的 Show Statistic 模式)。 内置过滤器,帮助滤除市场噪音,减少假入场。 信号不重绘:每个信号严格在K线收盘时生成,不会消失,之后也不会重新计算。 可配置信号箭头:多种箭头类型、尺寸,以及独立的 Buy/Sell 颜色。 灵活的提
BlueDigitsFx Easy 1 2 3 System
Ziggy Janssen
4.87 (299)
BlueDigitsFx 官方生态系统入口 获取基础设施更新、交易资源、产品发布信息以及 BlueDigitsFx 官方生态系统访问权限。 Telegram 生态系统 官方网站 MT5 版本 BlueDigitsFx Easy 123 System —— 强大的 MT4 反转与突破识别系统 一体化无重绘交易系统,专为识别市场反转与突破而设计 —— 适合重视市场结构、清晰信号以及确认型交易流程的交易者。 BlueDigitsFx Easy 123 System 是一款可视化 MT4 指标,并带有提醒功能,可帮助交易者轻松识别市场结构变化、突破以及趋势反转。 该指标遵循结构化的“123”交易模型: 步骤 1 :通过大箭头识别潜在衰竭区域中的新高或新低。 步骤 2 :发出市场结构突破信号,确认潜在趋势反转。 步骤 3 :通过小箭头和支撑/阻力点提供入场确认。 注意 :大箭头在K线收盘前可能会重绘,因为它会根据实时市场结构变化进行调整。 小箭头一旦出现后则为 100% 无重绘信号。 功能特点 大箭头:识别强烈的市场结构变化及潜在反转机会。 小箭头:100% 无重绘趋势信号。 支撑与阻力点
通过单一图表监控每个交易品种和每个时间周期,并使用您最喜爱的指标。终极指标仪表板为您提供完整的多品种、多指标、多时间周期视图——全部集中在一个简洁、可拖动的面板中。 不再需要在图表之间来回切换。一眼即可查看所有交易品种的 RSI、MACD、Bollinger Bands、Ichimoku、ATR、成交量等指标。颜色编码信号精准显示交易机会所在,智能提醒在条件变化时及时通知您——让您再也不会错过任何交易机会。 想使用仪表板中没有的指标? 联系我 ,我会看看能否轻松为您添加! === 为什么交易者喜爱这款仪表板 === • 在单一图表上同时查看多达 30 个品种和 8 个指标 • 每列均可独立配置——在任意时间周期上选择任意指标 • 颜色编码单元格即时突出显示看涨、看跌、超买和超卖状态 • 智能提醒支持每格和每列静音控制——再也不会被提醒刷屏 • 可拖动至图表任意位置——完全自由定位 • 适用于您的券商提供的任何品种——外汇、指数、大宗商品、加密货币 • 可自动从市场监控列表拉取品种,或自定义品种列表 • 轻量级交错更新——不会拖慢您的终端 === 17 个内置指标 === 可配置最
PZ Trend Trading
PZ TRADING SLU
4.8 (5)
许多盈利交易者不仅知道如何识别市场趋势,而且也能把握趋势建立后的交易机会。 Pz 趋势交易 指标设计用来在趋势行情中尽可能的赚取利润。 已建立的趋势提供了一揽子交易机会,但大多数趋势交易指标完全忽视了它们,让交易者在趋势行情时完全不知道该如何做!一般趋势指标只通知有关的趋势变化,但根本不足以得到卓越的回报. Pz 趋势交易 指标比一般趋势指标显示多达 20 倍的交易 , 因为它注重所谓的市场时机。它不仅显示当前的市场趋势,也有回调,内柱线的突破和调整。它令您在趋势回调之后介入,安全的柱线内突破金字塔加仓,以及发现潜在的反转,和已知的调整。 趋势改变 一个趋势改变在市场方向变化时发生。趋势变化在图表上用带数字的彩色圆圈显示。蓝色 (1) 信号为上涨开始, 而红色 (1) 信号为下跌开始。趋势变化并非评估当前价格动作的结果, 它意味着交易设置是不定时地。如果您正确使用本指标, 在趋势变化时, 您将将已经入场 (参看下面的调整)。 回调 但凡趋势在运动中,行情上下抖动,盈利者收割利润,且其它参与者入场。趋势回调代表好的买入机会,通常是由主力获利离场导致。如果行情在回调后回归上行, 指标将
Storm Prices
Andriy Sydoruk
The Storm Prices indicator is trendy, arrow family. It is easy to work and understand when the first red arrow appears, you need to buy, when the first blue arrow appears, sell. The indicator is used for scalping and pipsing. The indicator makes calculations based on several technical indicators. Determines the direction of the trend and gives a fairly clear indication of the position. The indicator allows you to determine the opportunities for entering the market for a short time. There is a sw
Prop Firm Sniper
Mohamed Hassan
4.33 (6)
Prop Firm Sniper MT4  is a professional market structure indicator that automatically identifies high-probability BUY and SELL opportunities using BOS and CHoCH analysis. Recommended Timeframes: For backtesting, use the indicator on   M5 or M15   for Gold (XAUUSD), and   M15 or H1   for more volatile Forex pairs such as   GBPUSD, USDJPY, EURGBP , and similar markets. CONTACT ME AFTER PURCHASE TO CLAIM YOUR FREE BONUSES! Prop Firm Sniper  is a professional market structure indicator designed t
Currency Strength Exotics
Bernhard Schweigert
4.88 (33)
目前8折优惠! 对任何新手或专家交易者来说都是最好的解决方案! 这个指标是专门用来显示任何符号的货币强度,如异国货币对、商品、指数或期货。它是同类产品中的第一个,任何符号都可以添加到第9行,以显示黄金、白银、石油、DAX、US30、MXN、TRY、CNH等的真实货币强度。这是一个独特的、高质量的、负担得起的交易工具,因为我们已经纳入了一些专有的功能和一个新的公式。想象一下,你的交易将如何改善,因为你能够准确地确定新趋势或剥头皮机会的触发点? 用户手册:点击这里   https://www.mql5.com/en/blogs/post/708876 它适用于所有时间框架。你将很快能够看到TREND! 根据新的基础算法设计,它使识别和确认潜在交易变得更加容易。这是因为它以图形方式显示了8种主要货币和一种符号的强弱。 该指标显示了8种主要货币(澳元加元瑞士法郎欧元英镑日元新西兰美元)的强弱线,再加上一个符号! 该指标显示了符号的真实价值。例如:对于XAUUSD(黄金):价格以美元报价。如果黄金在上涨,你怎么能知道是黄金的强势还是美元的弱势?只有当黄金走强时,我们才会进行交易。该指
KURAMA GOLD SIGNAL PRO(MT4)— 7层过滤 · 自动止盈止损 · 质量评分 · 信号历史保存 | 完整的XAUUSD交易系统 实时不重绘。信号出现的瞬间,箭头、入场、止盈、止损当场锁定,之后绝不移动。你交易的就是这个实时信号。而且在v7.20中,每一个真正发出的信号都会自动保存,并在重启后精确还原。 购买者专属赠品 购买永久授权,即可免费获得 AI Zone Radar(价值$59)+ 完整PDF手册。在产品价格之外,额外附赠价值$59的赠品。购买后在MQL5上给我留言即可。 AI Zone Radar: https://www.mql5.com/en/market/product/175834 在黄金交易者社区中被实际使用,因精度与易用性而广受好评。 你的难题 —— 以及解决方案 黄金一天波动$30–$50。你知道机会就在那里。但这些情况是否似曾相识: - 入场太早,价格逆行$10后才朝你的方
Dynamic Forex28 Navigator
Bernhard Schweigert
4.43 (7)
Dynamic Forex28 Navigator - 下一代外汇交易工具。 当前 49% 折扣。 Dynamic Forex28 Navigator 是我们长期流行的指标的演变,将三种功能合二为一: 高级货币强度 28 指标 (695 条评论)+ 高级货币 IMPULSE 带警报 (520 条评论)+ CS28 组合信号(奖励)。 有关指标的详细信息 https://www.mql5.com/en/blogs/post/758844 下一代强度指标提供什么? 您喜欢的原始指标的一切,现在通过新功能和更高的精度进行了增强。 主要特点: 专有货币强度公式。  所有时间范围内的平滑和准确的强度线。 非常适合识别趋势和精确进入。 动态市场斐波那契水平(市场斐波那契)。  此指标独有的独特功能。 斐波那契应用于货币强度,而不是价格图表。 适应实时市场活动以获得准确的反转区域。 实时市场动量。  第 9 行显示市场是活跃还是被动。 对于定时交易至关重要。 全面的警报和显示。  每种货币最强的买入和卖出动量。 ​​28 对的双重动量买入和卖出。 超买/超卖警告外部范围和止损。 反转
Change In State Delivery (CISD) Indicator - ICT Concepts 停止猜测市场反转,开始利用价格行为中真正的算法转变进行交易。 Change In State Delivery (CISD) 指标是一款高级图表工具,专为使用 Inner Circle Trader (ICT) 和 Smart Money Concepts (SMC) 的交易者精心设计。 该工具是您精确定位做市商何时将交付方向从买方转向卖方(反之亦然)所需的决定性优势。通过自动化最强大的 ICT 概念之一,该指标完全消除了您图表分析中的情绪、主观性和猜测。 CISD 在 ICT 概念中的力量: 在算法交易理论中,当底层市场算法改变其程序时,就会发生 Change in State Delivery。它不仅仅是标准的支撑或阻力突破;它是主导的机构订单流发生反转的准确时刻。 当特定的反向蜡烛被位移 (displacement) 破坏和突破时,价格交付的状态就会改变。该指标自动识别这些确切的起始蜡烛,绘制高度精确的 CISD 基线,并严格等待真实的实体突破以确认机构的转变。一旦确
Advanced Supply Demand
Bernhard Schweigert
4.91 (302)
现在优惠 30%! 任何新手或专业交易者的最佳解决方案! 该指标是一款独特、高质量、且价格合理的交易工具,因为我们已经整合了许多专有功能和新公式。 依据此更新,您将能够显示双重时间帧区域。 您不仅可以显示一个较高的时间帧,还可以同时显示图表时间帧,加上更高的时间帧:显示嵌套时区。 供需双方所有交易者都会喜欢它。 :) 重要信息披露 高级供需的最大潜力,请访问 https://www.mql5.com/zh/blogs/post/720245   想象您的交易如何得以改善,是因为您能够精准定位入场或目标位吗? 构建于新的底层算法,它可以更轻松地识别出买卖双方之间的潜在失衡。 这是因为它以图形方式展示供需最强劲区域,及其过去的表现(显示旧区域)。 这些功能旨在帮助您更轻松地发现最佳入场区域和价位。 现在您可以针对您的交易品种和时间帧来优化和编辑区域强度! 高级供需指标适用于所有产品和时间帧。 它是一个新的公式,非常新的功能是两个区域强度函数可由用户输入进行调整! 这在交易中是一大优势。 当您学习如何使用专有功能,例如带有价格游离最小 X 因子的区域强度时,您能够判断该区域强劲与否。 供需
Oversold and Overbought Candles, Trendlines, and BUY-SELL arrows in the single Indicator. Built from 8 default MT4 Indicators. Stochastic,RSI,SAR,CCI,RVI,DeMarker,WPR and MA. It is " NON REPAINT " indicator. All buffers do not repaint.  Double Trendline buffers that can also be used to identify sideway market and support resistance area.  Any timeframes and any currency pairs. Parameters: Show Trend . TRUE/FALSE to show trendlines on the chart Follow Trend. If TRUE , Dapitrend will show only
Signal From Level
Yaroslav Varankin
Binary Options Support Resistance Indicator This indicator is designed for binary options trading and effectively shows retracements from support and resistance levels. Signals appear on the current candle. A red arrow pointing downwards indicates a potential selling opportunity, while a blue arrow pointing upwards suggests buying opportunities. All that needs adjustment is the color of the signal arrows. It is recommended to use it on the M1-M5 timeframes as signals are frequent on these timef
UPD1 Murrey Math Combo Levels
Vitaliy Kuznetsov
5 (14)
该指标背后的想法是在所有时间范围内找到穆雷水平并将它们组合成组合水平,其中包括基于强穆雷水平  (+2, +1, 8, 4, 0, -1, -2). 时间范围越短,您立即看到组合级别的机会就越大。 它将以颜色突出显示。 当您将光标悬停在任何数字上时,将显示该级别所属的时间范围的提示。 但您将始终将当前时间范围视为最左边的时间范围。 智能警报可帮助您传达与信号组合级别相关的价格。 视频中的仪表板不是声明的功能,也不包含在此处! 仍在开发中。 交易建议。 不建议在没有额外技术分析的情况下交易组合水平的反弹。 从蓝色和红色水平反弹的概率较高。 价格被磁力吸引至组合水平,但价格尚未对其进行测试(128 根蜡烛前)。在这种情况下,建议使用趋势策略,并采取水平取向(高/低一个水平)。 当价格向红色或蓝色水平移动时,不要在沿途反弹时交易黄色(这会破坏势头)。 强烈建议初学者在组合水平反弹时进行交易,除非有相反的组合水平。 最好在趋势方向反弹时进行交易。 在博客链接阅读更多内容  -   Murrey Math Trading with UPD1 . 设置说明。 主要设置。 Period
As traders, we know that identifying price contractions and consolidations is crucial for profitable trading. Fortunately, we have a powerful tool at our disposal. The indicator to trade price consolidation is designed to identify price contraction and alerts us on formation. It does this by analyzing historical price data and identifying price action patterns. The algorithm then uses this information to mark the zone , potential targets and liquidity lines, giving us valuable insights into mark
作者的更多信息
Line Alerter Free
Tomoyuki Nakazima
5 (1)
This indicator alerts you when indicator-created lines are "touched" by price, You can change the interval between alerts. You can change colors and styles of lines as you want. However, lines must be named "Upper" and "Lower. There is a  more powerful PRO version . Input Parameters WaitTime: Interval between alarm. How To Use Place lines wherever you want to add alarms.
FREE
PRO VERSION This free indicator change timeframe of charts(up to 3) at the same time,by clicking a label. If you click the label(shown below),timeframe of charts will change. If you click again,timeframe of charts restore. You can change the position of the label. You can change charts up to 3 charts(a paid version enables up to15 charts). You can add second,third timeframe changer label. This indicator is very useful for speed trading. There is a more powerful PRO VERSION . The paid versio
FREE
New Bar Alarm Free
Tomoyuki Nakazima
This indicator alerts you when/before new 1 or 5 minute bar candle formed. In other words,this indicator alerts you every 1/5 minutes. This indicator is especially useful for traders who trade when new bars formed. *This indicator don't work propery in strategy tester.Use this in live trading to check functionality. There is more powerful Pro version .In Pro version,you can choose more timeframe and so on. Input Parameters Alert_Or_Sound =Sound ----- Choose alert or sound or both to notify y
FREE
MTF ATR with alert
Tomoyuki Nakazima
5 (1)
A.Indicator description This indicator tells you ATRs of various time-frame and how much ATR is filled. If ATR is completely filled,this indicator alerts you. Font,color and font size is customizable. B.Why do you need ATR? ATR tells you how much bars propbably would move. You can use this indicator to set stoploss and take-profit,or enter counter-trend setup. But it is risky to enter trades based on ATR alone. So,you should use ATR with other indicator and price action. C. Input Parameters Al
This indicator makes objects(HLine,VLine,etc.) invisible in chosen  timeframes. Objects to be invisible are determined by color. If you delete this indicator from the chart,the vanished  object will be visible again. This indicator is especially useful for trader that utilize a lot of lines. Vanishable Object:HLine,VLine,ChannnelLine,LABEL,TEXT,arrow. *In strategy tester,you can't change timeframe.Use template in order to know full ability of this indicator. *There is a free version. Input P
Line Alerter Pro
Tomoyuki Nakazima
This indicator alerts you when lines are touched by price. You can change the interval between alerts. You can change colors and styles of lines as you want. However, lines must be named "Upper" and "Lower .Or "Third" and "Fourth". *There is a free version . Functions Additionaly,you can add third and fourth aletable line. You can calculate distances in charts between Upper and Lower lines. You can depict arrows in charts when alerts is activated. You can make every HLine and TLine alertable
This indicator change timeframe of charts(up to 15) at the same time,by clicking a label. If you click the label(shown below),timeframe of charts will change. If you click again,timeframe of charts restore. You can change the position of the label. You can change charts up to 15 charts. You can add second,third timeframe changer label. This indicator is very useful for speed trading. *This indicator don't work propery in strategy tester.Use Free version to know the real potential. Input Par
New Bar Alarm Pro
Tomoyuki Nakazima
This indicator alerts you when/before new candle bar formed. In other words,this indicator alerts you every 1/5/30/60/240 minutes. This indicator is especially useful for traders who trade when new bars formed. *This indicator don't work propery in strategy tester.Use Free Version to check functionality in live trading. Input Parameters Alert_Or_Sound =Sound ----- Choose alert or sound or both to notify you when new bar is coming. Enable_1mBarAlert ----- Enable alert for 1 min bar diff_1m --
Miracle GMMA
Tomoyuki Nakazima
1 (1)
The EA is based on trend following strategy. By mainly using GMMA,this EA catches the trend. Trades is closed if the trend is changed according to GMMA. Simply put,you can win big by using this EA and keep losses minimum. What is GMMA? GMMA means "Guppy Multiple Moving Average". This strategy utilizes 12 moving averages. Because of that,GMMA is more robust and profitable than simple moving average strategy. PAIR AND TIMEFRAME The EA is especially made for EURUSD and Daily chart. It is importa
The beast
Tomoyuki Nakazima
The EA utilizes Fear and Greed of market. That's why this EA works on almost all market. Specifically,this EA searches for extreme prices and exploit that. This EA does not use Martingale,Grid or other risky systems. As default,all trades have a StopLoss level. PAIRS,TIMEFRAME AND BROKER The EA is well suited for Forex. Any pair will do,but I recommend major pairs. Higher timeframes like H1 is best.But this EA can be used for scalping too(with low Profit Factor). Any broker will do,but lower s
This is triangular moving average(TMS). TMS uses Simple Moving Averages for moving average calculation. If TMA periods is 5,five SMAs are used for calculation. TMA weights middle part of the price series. In other words,TMA is less noisy and more accurate . Input Parameters TMAPeriods ----- Defines perids for TMA calculation. ModeForTMA ----- Defines mode for TMA calculation.This is normally SMA. AppliedPriceForTMA ----- Defines applied price for TMA calculation. ShowNormalMA -----Show normal m
Command Prompt
Tomoyuki Nakazima
This is Command Prompt(CP) for MT4. By using this,you can access info that only brokers and programmers can access. For example,do you know your freeze level,margin mode,or how much memory used by MT4? Knowing these info,you can improve your trading. How to Use Type following commands into command prompt box(Shown in photos.) and press Enter. For example,if you want to know maximum permitted amount of a lot,then type "maxlot". By typing "info",CP will show all commands available. By typing "hel
Dreadnought
Tomoyuki Nakazima
Feature No Martingale, grid trading or averaging in this EA. Logic is original,sound and robust. Augmented by machine learning. Fixed Stoploss and Takeprofit = Safe. Win rate is 99%. ProfitFactor is over 5. One trade at a time. The Ultimate EA Finally,the EA with real edge has come to MQL5 Market. This EA is easy to use.No Optimization is needed. Currency Pairs This EA works on USDJPY. On strategy tester and live trading,choose symbol "USDJPY". Parameters Parameter name Description LotsMet
Architect
Tomoyuki Nakazima
Feature No Martingale, grid trading or averaging in this EA. Logic is original,sound and robust. Augmented by machine learning. ProfitFactor is over 7. Perfect EA The Ultimate EA Finally,the EA with real edge has come to MQL5 Market. This EA is easy to use.No Optimization is needed. Your money will increase so fast,I promise you. Currency Pairs This EA works on USDJPY. On strategy tester and live trading,choose symbol "USDJPY". Parameters Parameter name Description LotsMethod There are two
筛选:
无评论
回复评论