Engulfing Scanner
- 指标
- 版本: 1.0
- 激活: 5
This indicator was created to spot potential reversals in the market. It will help you find the edge while trading which is required to be profitable. The indicator does what its good at, processing data objectively and presents you with the results once a new setup has been formed. It can send you a notification or email and such, so you are not required to follow the market every move. This, coupled with the edge it gives, give you the time and rest to take the appropriate action.
The Engulfing Pattern is a candlestick pattern which can normally be found after a period of up or down pressure. A Bullish Engulfing Pattern is normally to be found close at the end of the down movement while a bearish Engulfing Pattern will beat the top of a rising up movement.
When an Engulfing Pattern has been formed, the idea behind it is that the investor sentiment has changed from either bullish to bearish or from bearish to bullish.
This is the point where we get ready for a potential reversal which can lead to good results.
Parameters
- MaxBarsLookBack - how many bars back do you want the indicator to start monitoring? This is helpful for practicing and to see what happened before.
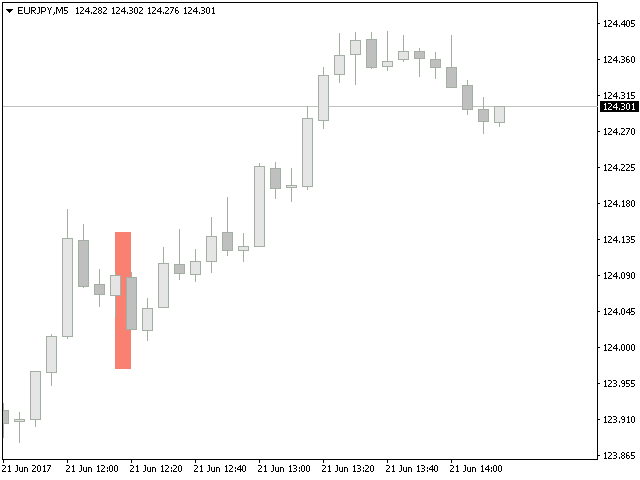
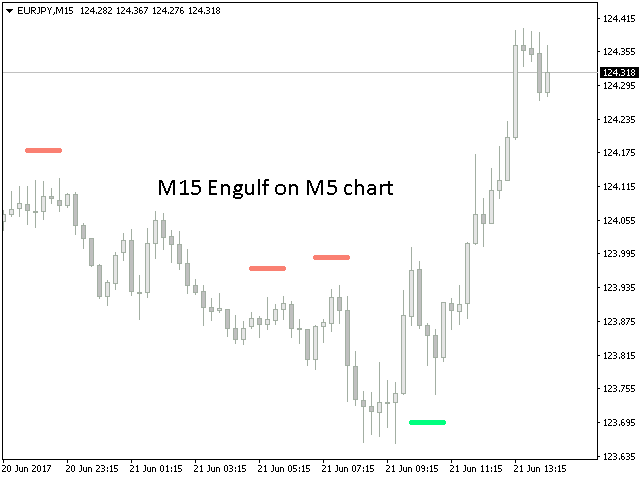
- CustomPeriod - let the indicator monitor for Engulfing Patterns on a timeframe other than the current chart like:
- Current_TF
- M1
- M5
- M15
- M30
- H1
- H4
- D1
- WK1
- MN1
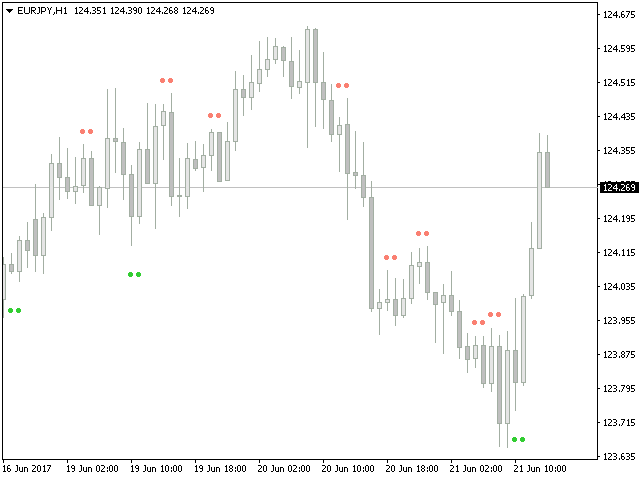
- StyleOutput - choose the output of any found Engulfing Pattern. You can choose from:
- OUTPUT_ENGULF_DOT
- OUTPUT_ENGULF_ARROW
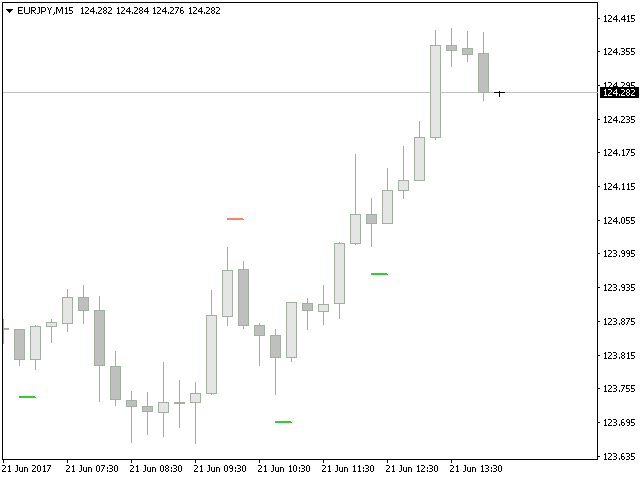
- OUTPUT_ENGULF_RECTANGLE
- OUTPUT_ENGULF_LINE
- StyleBearishEngulfingColor - color of any found Bearish Engulfing Patterns.
- StyleBullishEngulfingColor - color of any found Bullish Engulfing Patterns.
- StyleWidth - width of the output being shown.
- StyleBorder - when the StyleOutput is set to OUTPUT_ENGULF_RECTANGLE or OUTPUT_ENGULF_LINE, you can set the border to:
- BORDER_SOLID
- BORDER_DASH
- BORDER_DOT
- BORDER_DASHDOT
- BORDER_DASHDOTDOT
- StyleFilled - when the StyleOutput is set to OUTPUT_ENGULF_RECTANGLE, you can set the background to be filled or not.
- StylePipsOffSet - pips being added/subtracted to the output position which makes the output better visible and/or the charts cleaner.
- DoSendNotification - send a notification when a new Engulfing Pattern has been formed (please enable MetaTrader 4 → Tools → Options → Notifications).
- DoSendMail - send an email when a new Engulfing Pattern has been formed (please enable MetaTrader 4 → Tools → Options → Email and fill in required fields).
- DoShowAlert - show an alert and play a sound when a new Engulfing Pattern has been formed.
- DoShowComment - show a comment in the left upper corner of the chart when a new Engulfing Pattern has been formed.