Fast Switching Symbols Periods Keyboard

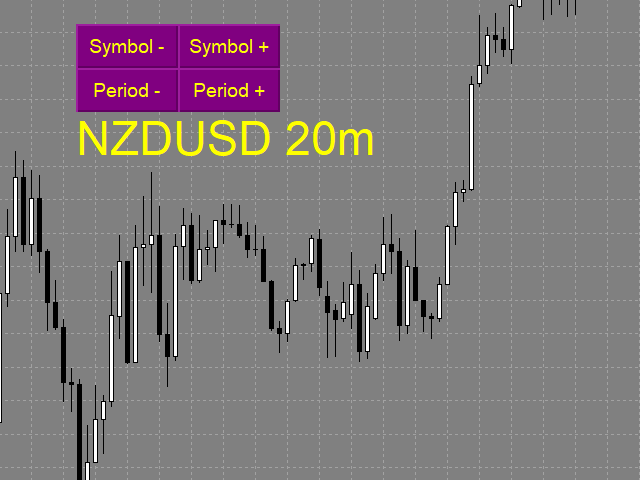
The indicator allows you to quickly switch from one instrument to another, from one time period to another using the keyboard or buttons on the monitor. Each command can be assigned a hot key from 0-9, a-Z (case-insensitive) and VK_OEM_COMMA ("<" on the keyboard) and VK_OEM_PERIOD (">" on the keyboard).

This can help you to operate the maximum number of instruments that are available at your broker, analyze more instruments/periods in less time.

This product cannot be tested in the tester, because the tester does not have the ability to change the symbol and period of the chart(on the chart where the test is already running).
All the functionality is shown in full in the video, description, and screenshots.

You can also save a default template with the added buttons, then they will be automatically added to the newly opened charts.

You can use the on-screen buttons or keyboard buttons to switch between different tools and time periods.
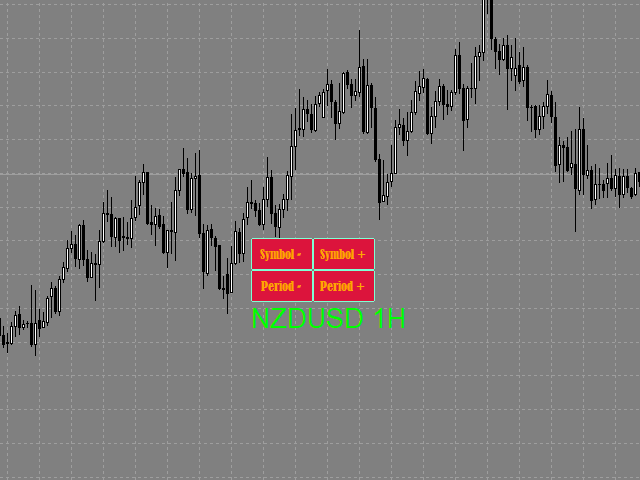
On-screen buttons can be dragged with the mouse. The text label "tool/period" moves along with the buttons.
You can hide on-screen buttons. In this case, the text label is moved to the upper-left corner. you can select the text label with the mouse and move it to any convenient location.
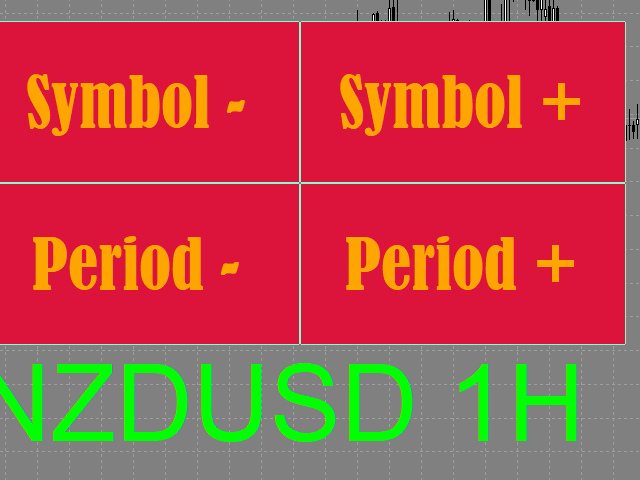
The size of on-screen buttons depends on their font and font size.
Keyboard shortcuts work regardless of whether there are on-screen buttons.


Settings

  • Buttons_Hide - hide/display on-screen buttons.
  • Button_Text_Color - the text color of the buttons.
  • Button_Background_Color - buttons background color (if Button_Background_Color=clrNONE, the buttons background is the same as the graph background color).
  • Button_Border_Color - the border color of the buttons.
  • Button_FontSize - button font size.
  • Button_Font - the font of the buttons.
  • Tag_Symbol_Period_Color - color of the caption on the chart of the current symbol/time period.
  • Tag_Symbol_Period_FontSize - font size of the caption on the chart of the current symbol / time period.
  • Tag_Symbol_Period_Font font of the caption on the chart of the current symbol / time period.

Description of the actions performed by the hot keys:

Each action can be assigned a hot key from 0-9, A-Z (case-insensitive) and VK_OEM_COMMA ("<" on the keyboard) and VK_OEM_PERIOD (">" on the keyboard).

  • Prev_Symbol (< by default) - switches the instrument to the next one (listed in Market Watch) from bottom to top (if the instrument is the first, switches to the last one, thus cycling in a loop).
  • Next_Symbol (> by default) - switches the instrument to the next one (listed in Market Watch) from top to bottom (if the instrument is the last, switches to the first one, thus cycling in a loop).
  • Period_Down (Z by default) - switches the time frame from the higher to the smaller (month - minute).
  • Period_Up (X by default) - switches the time frame from the smaller to the higher (minute - month).
    추천 제품
    Buy Sell Multiple Panel - Execute Bulk Orders in a Single Click! Description: Save time and seize market opportunities instantly. This powerful panel allows you to place multiple buy or sell orders simultaneously, each with custom lot sizes, take-profit, and stop-loss levels. Perfect for sophisticated entry strategies and managing complex trades efficiently. Key Features: Bulk Order Execution:   Open multiple market orders at once with just one click. Flexible Lot Sizing:   Set individual lot
    Скрипт используется для сбора статистики по переходам цены между уровнями сетки, размер которой задается в настройках (смотрите индикатор Transitions between levels ). Данные записываются в CSV файл. Есть два режима сбора статистики: SeparateTransition - учитывается каждый отдельный переход (смотрите скриншот 2). Время перехода - время, когда цена коснулась нового уровня. Accumulation - в файл записывается количество однонаправленных переходов  (смотрите скриншот 4). Например, -7 - семь пеерех
    Order Blocks Breaker
    Suvashish Halder
    5 (2)
    Introducing Order Blocks Breaker , a brand-new way to identify and leverage order blocks in your trading strategy. After developing multiple order block tools with unique concepts, I’m proud to present this tool that takes things to the next level. Unlike previous tools, Order Blocks Breaker not only identifies order blocks but also highlights Breaker Order Blocks —key areas where the price is likely to retest after a breakout. MT5 -  https://www.mql5.com/en/market/product/124102/ This tool inco
    Trend Ray
    Andriy Sydoruk
    The indicator shows the potential trend direction by cyclical-wave dependence. Thus, all the rays of the intersection will be optimal rays, in the direction of which the price is expected to move, taking into account the indicator period. Rays can be used as a direction for potential market movement. But we must not forget that the approach must be comprehensive, the indicator signals require additional information to enter the market.
    CorrelationUSD
    Andriy Sydoruk
    CorrelationUSD is a basic indicator, which is located on the chart. This tool allows you to monitor the relationship between assets, it reliably determines the patterns of quotation changes of one relative other asset. What is the indicator? All basic assets are interconnected, first of all, by a full complex of essential fundamental factors. For example, most currency pairs have a strong influence on measurements of each other’s quotes. Trends of this kind create macroeconomic news.
    红盘手交易助手,该EA不会自动交易,属于辅助工具,参考4小时图表波动率参数,自动给订单设置止损和止盈,以及追踪止损。策略带有风控标准,如下<1K为50 >1K<1W为100, >1W<5W为500, >5W<10W为1000, >10<20为2000。最大的特色是资金管理和风控功能。显示信号为5日平滑均线方向,布林线中轨平仓功能,开仓警报提醒功能,手数资金恢复功能,该EA可以在历史数据测试时下单,所以它相当于复盘工具。注意EA会修改所不带止损和止盈品种的定单,并执行风控标准。EA参数经过实盘反复验证和优化,可以直接使用默认参数。        参数与功能: FixBuy_target 指定后统一修改当前品种所有多单的止盈价; FixSell_target 指定后统一修改当前品种所有空单的止盈价; 一比一恢复资金 默认不启用,启用盈利按固定亏损金额数字平仓; Boll_close_order 默认不启用,启用后价格遇到布林线(周期30)中轨平仓; Lots 设置固定手数,开启UseMM后无效; UseMM 默认启用资金管理; 风险系数 启用; ATR止损基数 默认按4小时
    SwitchRefresh
    Ahmet Metin Yilmaz
    Switch & Refresh Charts This Script shows all the charts open on your MT4 platform in sequence with a delay of the second you specify, and refreshes the displayed charts if desired. When it comes to the first chart you started, it waits for the minute you specify and starts the same cycle again. The file you downloaded is located in the 'Scripts' section and when you come to the graphic you started to finalize, it should be removed from the chart as seen in the screenshot.
    Auto Fibo Pro m
    DMITRII GRIDASOV
    "Auto FIBO Pro" Crypto_Forex 지표 - 거래에 유용한 보조 도구입니다! - 지표는 자동으로 Fibo 수준과 로컬 추세선(빨간색)을 계산하여 차트에 배치합니다. - Fibonacci 수준은 가격이 반전될 수 있는 주요 영역을 나타냅니다. - 가장 중요한 수준은 23.6%, 38.2%, 50%, 61.8%입니다. - 역전 스캘핑이나 존 그리드 거래에 사용할 수 있습니다. - Auto FIBO Pro 지표를 사용하여 현재 시스템을 개선할 수 있는 기회도 많습니다. - Info Spread Swap Display가 있습니다. 현재 Spread와 Swap이 부착된 외환 쌍을 표시합니다. - 디스플레이에는 계정 잔액, 자본 및 마진도 표시됩니다. - 차트의 어느 모서리에서나 Info Spread Swap Display를 찾을 수 있습니다. 여기를 클릭하여 고품질 트레이딩 로봇과 지표를 확인하세요! 이것은 이 MQL5 웹사이트에서만 제공되는 오리지널 제품입니다.
    Partial Close MT4
    Ahmed Alaoui Chrifi
    This is a very simple, and easy-to-use Trade Manager with features like   Auto Partial Close, Auto Stop-loss, Breakeven. EA  closes a profitable position in partial closes when the price moves first in the direction of profits, and then comes back. EA monitors the position. If the price moves in the direction of profits, then ea establish the first level of rollback price at a distance. If the price continues to move in the direction of profits, this level of profit continues modifying this lev
    Price Magnets
    Ivan Simonika
    Price Magnet — Price Density and Attraction Levels Indicator Price Magnet is a professional analytical tool designed to identify key support and resistance levels based on statistical Price Density. The indicator analyzes a specified historical period and detects price levels where the market spent the most time. These zones act as “magnets,” attracting price action or forming a structural base for potential reversals. Unlike traditional Volume Profile tools, Price Magnet focuses on price-time d
    Trend PA
    Mikhail Nazarenko
    5 (3)
    The Trend PA indicator uses   Price Action   and its own filtering algorithm to determine the trend. This approach helps to accurately determine entry points and the current trend on any timeframe. The indicator uses its own algorithm for analyzing price changes and Price Action. Which gives you the advantage of recognizing, without delay, a new nascent trend with fewer false positives. Trend filtering conditions can be selected in the settings individually for your trading style. The indicator
    Automatically closes orders when profit per lot or total profit reaches your specified level Per a lot : The amount of wins per lot in the selected symbol. Each orders is calculated as 1 lot. Example: If EURUSD total lot is 2.05 and earnings per lot is $ 100, then 100 * 2.05 = 205 $. Orders will be closed when EURUSD has a total profit of $ 205. When the total of all orders on the selected symbol reaches the specified amount, it closes all orders belonging to the symbol. For example: There are 3
    Scalper RS
    Vitalyi Belyh
    Scalper RS - ​​ 은 가격 차트에서 가장 가능성 있는 반전 지점을 식별하도록 설계된 거래 및 분석 지표입니다. 가격 구조를 구성하는 지표 알고리즘을 사용하면 다양한 거래 수단과 시간 프레임에 대한 가격 반전 조합을 결정할 수 있습니다. 가변 매개변수 " Structuring "를 사용하면 원하는 거래 차트와 시간 범위에 맞는 최적의 설정을 선택할 수 있습니다. 처음에는 이 지표가 M1~M5~M15 시간대에서 신호를 수신하도록 만들어졌지만, 필요한 매개변수를 선택하면 H1~H4~D1 시간대에서 장기 추세를 식별하도록 구성할 수 있습니다. 스캘핑과 단기 거래에 적합합니다. 신호 화살표는 다시 그리지 않고도 작동할 수도 있고, 다시 그릴 수 있는 가능성(전환 가능한 매개변수)이 있습니다. 모든 신호는 캔들 마감 시점에 나타납니다. 알림에는 여러 유형이 있습니다. 지표 신호는 추세 방향으로 사용할 수도 있고 추세 반대 방향으로 사용할 수도 있습니다. 이 지표는 별도의 시스템으
    Virtual Exchange Reserve Equity Monitor In an environment where exchanges offer increasingly high leverage ratios, it is all the more important for traders to tightly regulate their level of equity .  This software is designed to be run in the background on any virtual private server that can run Meta Trader 4/5.  It implements basic equity control functions ahead of the broker---allowing users to set their own equity trailing stop, an equity limit to lock-in a certain profit margin, and a unive
    FREE
    Trade statistics
    Makarii Gubaydullin
    선택한 기간 동안의 상세한 트레이딩 통계 내  #1 트레이드 매니저 를 확인하세요: 66+ 기능, 확장 통계 포함  |   문의하기 궁금한 점이 있으면 통계 표시 모드: 선택한 통화 쌍/트레이딩 도구 모든 거래   에 대한 통계 (" ALL ") 통계를 얻고 싶은 기간을 선택할 수 있습니다: 1 일 1 주 1 개월 2  개월 3  개월 6  개월 1 년 2 년 전체 트레이딩 기록 표시되는 정보:  총 이익 총 손실 총 이익/손실 거래 수 구매 거래의 수익 비율 판매 거래의 수익 비율 전체 수익 거래 비율 평균 보유 시간 수익 거래의 평균 보유 시간 손실 거래의 평균  보유 시간 인터페이스의 장점: 패널을  접어 차트 공간을 확보할 수 있습니다: (버튼 (^)); 패널을  이동  하여 차트의 어느 곳에나 배치할 수 있습니다: (버튼 < MOVE >); 다크 / 라이트 인터페이스 테마 : (스위치 " Dark ");
    Magic Balance
    Daniil Evstratenko
    The indicator shows which trading pairs, strategies, robots and signals that you use are profitable and which are not. The statistic of trades and balance graph are displayed in the account currency and pips - to switch simply click on the graph. button "$"(top left) - minimize/expand and move the indicator panel button ">"(bottom right) - stretching and resetting to the original size Statistic of trades 1 line - account balance, current profit and lot of open trades; 2 line - the number of all
    Trade History Exporter automatically exports trade history to a CSV (comma separated values) file. Trade History Exporter: - automatically exports trade history every time a trade is closed - allows you to manually force an export by using the "W" key on your keyboard - can use Order Comments as Magic Numbers - useful for instance when using a Trade Copier - calculates the Net Profit per trade
    Download link for the sound files, it is to be placed in the MQL4 Sound Folder. https://www.mql5.com/en/blogs/post/762237 Simplify your trading with   Ultimate Price Alert , a lightweight and powerful utility tool designed for MetaTrader 4. This intuitive tool allows traders to set price alerts for all 28 major and cross forex pairs plus gold (XAUUSD) on a single chart, eliminating the need to open multiple charts and streamlining your workflow. Key Features: Multi-Pair Alerts on One Chart :
    Hello Traders! Version 3.0 of the script has been released!  What's new?  Thanks to your suggestions I have inserted these changes to the tool: 1 - Data input are now date picker, it will be easier and faster to set the data export period; 2 - A message box will check that there is not a file with the same name in your folder; 3 - Error message to check that data insert are correct. If you like this product, take a look to the FULL INTERFACE!   MT4 To Excel Interface This script is a very usefu
    This tool will allow you to export MetaTrader indicators data (Buffers) for any financial instrument present in your MetaTrader 4. You can download multiple Symbols and Timeframes in the same csv file. Also, you can schedule the frequency of download (every minute, 5 minutes, 60 minutes, etc.). No need to open a lot of charts in order to get the last data, the tool will download the data directly. The CSV File will be stored in the folder:   \MQL4\Files . MetaTrader 5 version :  https://www.
    FREE
    Risk Manager Pro MT4
    Jhojan Alberto Tobon Monsalve
    Risk Manager Pro is a simple utility that calculates the necessary lots with the risk percentage and the pips of stop loss, before opening positions. The web calculators can be useful in some cases but they are not efficient to open operations in real time. In the trading days, there are few opportunities to open positions and when the opportunity arises, the seconds make the difference. This is not possible with conventional web calculators, since to calculate the size of an operation regarding
    "Adjustable Fractals"는 프랙탈 지표의 고급 버전으로, 매우 유용한 거래 도구입니다! ................................................................................................. - 알다시피 표준 프랙탈 MT4   지표에는 설정이 전혀 없습니다. 이는 거래자에게 매우 불편합니다. - Adjustable Fractals는 이 문제를 해결했습니다. 필요한 모든 설정이 있습니다. - 지표의 조정 가능한 기간(권장 값 - 7 이상). - 가격의 고점/저점으로부터 조정 가능한 거리. - 프랙탈 화살표의 조정 가능한 디자인. - 표시기에는 모바일 및 PC 알림 기능이 내장되어 있습니다. 여기를 클릭하여 고품질 트레이딩 로봇과 지표를 확인하세요! 이 MQL5 웹사이트에서만 제공되는 오리지널 제품입니다.
    The utility is designed to close several types of orders. Closing is done by pressing the hot key. How to place and delete orders by voice using the utilities of this type, see the video below the description.  https://www.youtube.com/channel/UCTpVWJkEic6TzoXr0qc9RIw/featured Provided closing options: KEY "1" DELETE BUY STOP. KEY "2" DELETE SELL STOP. KEY "3" DELETE BUY AND SELL STOP. KEY "4" DELETE BUY LIMIT. KEY "5" DELETE SELL LIMIT. KEY "6" DELETE BUY AND SELL LIMIT. KEY "7" DELETE ALL PEND
    FREE
    MQL5 블로그: https://www.mql5.com/en/blogs/post/761446 MT4 버전: https://www.mql5.com/en/market/product/136790 MT5 버전: https://www.mql5.com/en/market/product/136791 Time Wizard는 속도, 타이밍, 실행 제어 기능을 하나의 깔끔한 대시보드에서 필요로 하는 트레이더를 위해 설계된 전문 트레이딩 어시스턴트입니다. 이 Expert Advisor는 이벤트 기반 트레이딩, 예약 실행, 빠른 반자동 주문 관리 기능을 제공합니다. 주문을 미리 준비하고, 정확한 실행 시간을 지정하고, 계층형 대기 주문을 설정하고, 손절매 및 이익 실현으로 위험을 관리하고, 차트의 간편한 인터페이스에서 모든 것을 모니터링할 수 있습니다. 경제 이벤트, 개장 시간, 돌파 시점 또는 사용자 지정 일정 등 어떤 시점을 기준으로 거래하든 Time Wizard는 체계적이고 규율 있는 실행을
    Indicator Values Panel
    AL MOOSAWI ABDULLAH JAFFER BAQER
    Indicator Values Panel – Your Ultimate Indicator Monitoring Solution! Are you tired of constantly switching between indicators to check values? Want a simple, elegant, and real-time solution that puts all key indicator readings in one place? Indicator Values Panel is the ultimate utility for traders who want a clear and concise display of important indicator values – directly on their chart! What is Indicator Values Panel? Indicator Values Panel is a sleek, easy-to-use utility that provides rea
    This indicator is useful for monitoring the performance of individual strategies or even everything of the entire portfolio of strategies directly on your MT4. In this way you can view the equity line and the balance line directly on the chart. In addition, you can set a line based on the percentage number of DD Max that the individual strategy can reach. Try it.
    Data Downloader
    Mounir Cheikh
    5 (1)
    This tool will allow you to export candles data (Open, High, Low, Close, Volume) for any financial instrument present in your MetaTrader 4. You can download the data of multiple Symbols and TimeFrames in the same csv file at once. You can schedule the frequency, simply choose the refresh interval (1 minute minimum, if 0 then the extraction will be done once) and the tool will do the work. No need to open a lot of charts in order to get the last sync, the tool will download the data directly. The
    FREE
    The indicator detects and displays М. Gartley's Butterfly pattern. The pattern is plotted by the extreme values of the ZigZag indicator (included in the resources, no need to install). After detecting the pattern, the indicator notifies of that by the pop-up window, a mobile notification and an email. The pattern and wave parameters are displayed on the screenshots. The default parameters are used for demonstration purposes only in order to increase the amount of detected patterns. Parameters z
    This product is a full-screen dashboard that constantly monitors account performance based on historical trading history. It has a graphical line for balance and equity, and displays wins, losses, and percentages for the current and past day, month, week, and year. When there are no open positions, the balance and equity lines are superimposed; when a position is opened, the yellow equity line is also visible.
    FFx Momentum
    Eric Venturi-Bloxs
    4 (1)
    The purpose of this new version of the MT4 standard indicator provided in your platform is to display in a sub-window multiple timeframes of the same indicator. See the example shown in the picture below. But the display isn’t like a simple MTF indicator. This is the real display of the indicator on its timeframe. Here's the options available in the FFx indicator: Select the timeframes to be displayed (M1 to Monthly) Define the width (number of bars) for each timeframe box Alert pop up/sound/ema
    FREE
    이 제품의 구매자들이 또한 구매함
    Trade Manager EA에 오신 것을 환영합니다. 이 도구는 거래를 보다 직관적이고 정확하며 효율적으로 만들기 위해 설계된 궁극적인 리스크 관리 도구 입니다. 단순한 주문 실행 도구가 아닌, 원활한 거래 계획, 포지션 관리 및 리스크 제어를 위한 종합 솔루션입니다. 초보자부터 고급 트레이더, 빠른 실행이 필요한 스캘퍼에 이르기까지 Trade Manager EA는 외환, 지수, 상품, 암호화폐 등 다양한 시장에서 유연성을 제공합니다. Trade Manager EA를 사용하면 복잡한 계산은 이제 과거의 일이 됩니다. 시장을 분석하고 진입, 손절 및 익절 수준을 차트의 수평선으로 표시한 후 리스크를 설정하면, Trade Manager가 이상적인 포지션 크기를 즉시 계산하고 SL 및 TP 값을 실시간으로 표시합니다. 모든 거래가 간편하게 관리됩니다. 주요 기능: 포지션 크기 계산기 : 정의된 리스크에 따라 거래 크기를 즉시 결정합니다. 간단한 거래 계획 : 진입, 손절, 익절을 위한
    수동 매매를 위한 전문가용 트레이딩 패널로, 정밀한 진입부터 계좌 보호까지 매매의 전 과정을 차트 위 하나의 창에 담았습니다. 정해진 리스크에 정확히 맞춰 모든 포지션의 거래량을 산정하고, RR Tool로 차트에 직접 라인을 그려 거래를 설계하며, Market 주문과 예약 주문은 물론 Grid와 OCO까지 사용할 수 있습니다. 포지션 관리는 패널이 대신 처리합니다. 최대 다섯 단계 부분 청산, 여섯 가지 트레일링 스탑, 브레이크이븐, Virtual SL/TP를 지원합니다. 일간·주간·월간 한도가 예치금을 지키며, 기준을 넘기는 즉시 자동으로 발동됩니다. 가이드와 무료 Live 데모 무료 Live 데모 버전은 여기에서 이용할 수 있습니다 ( Free Live Demo ). 제품 사용 가이드는 여기에서 확인할 수 있습니다 ( User Manual ). NT Trade Manager는 트레이더의 모든 작업 흐름을 차트 위 작고 간결한 패널 하나에 모아, 터미널 창을 오갈 필요도, 진입할
    News Filter EA: Advanced Algo Trading Assistant News Filter EA is an advanced algo trading assistant designed to enhance your trading experience. By using the   News Filter EA , you can integrate a Forex economic news filter into your existing expert advisor, even if you do not have access to its source code. In addition to the news filter, you can also specify   trading days   and   hours   for your expert. The News Filter EA also includes   risk management   and   equity protection   features
    목표 수익 도달 시 자동 수익 실현 EquityTargetCloser   — 는 MetaTrader 5용 유틸리티 전문가 어드바이저(EA)로,   순자산(Equity)이 현재 잔고를 지정된 수익 금액만큼 초과하면 모든 시장 포지션을 청산하고 예약 주문을 삭제합니다. 모든 포지션을 청산한 후 목표는 자동으로 상향 조정됩니다. 새 임계값 = 새 잔고 + 지정된 수익. EA는 거래를 시작하지 않고 기존 포지션만 관리하여 수익을 확실하게 고정하고 축적된 자금을 보호합니다. MT5-version:  https://www.mql5.com/en/market/product/169839 작동 방식 전문가 어드바이저는   순자산(Equity)   을 동적 목표와 지속적으로 비교합니다. 목표 =   현재 잔고(Balance) + plusMoney   (미국 달러). 순자산이 이 금액 이상이 되면 보호 기능이 작동합니다.   모든 시장 포지션   (모든 심볼)을 청산합니다. 매개변수   Delete p
    Telegram to MT4 Multi-Channel Copier 는 Telegram 채널의 트레이딩 신호를 자동으로 MetaTrader 4로 직접 복사합니다. 봇도, 브라우저 확장 프로그램도, 수동 복사도 필요 없습니다. Telegram에서 신호를 받으면 EA가 몇 초 안에 터미널에서 거래를 엽니다. 본 제품은 두 가지 구성 요소로 구성되어 있습니다: Telegram 채널을 감시하는 Windows 애플리케이션과 MT4 터미널에서 신호를 실행하는 이 Expert Advisor입니다. MT5 버전도 제공됩니다. 설정 가이드 및 애플리케이션 다운로드: https://www.mql5.com/en/blogs/post/768988 작동 방식 Windows 애플리케이션은 봇이 아닌 사용자 자신의 API 자격 증명을 사용하여 Telegram에 연결됩니다. 이는 프라이빗 및 VIP 채널을 포함하여 구독 중인 모든 채널, 그룹 또는 주제를 읽을 수 있음을 의미합니다. 신호를 감지하면 이를 파싱하여
    The product will copy all telegram signal to MT4   ( which you are member  ) , also it can work as remote copier.  Easy to set up, copy order instant, can work with almost signal formats, image signal, s upport to translate other language to English Work with all type of channel or group, even channel have "Restrict Saving Content", work with  multi channel, multi MT5 Work as remote copier: with signal have ticket number, it will copy exactly via ticket number. Support to backtest signal. How to
    TradePanel MT4
    Alfiya Fazylova
    4.84 (95)
    Trade Panel은 다기능 거래 도우미입니다. 이 애플리케이션에는 50개 이상의 수동 거래 기능이 포함되어 있으며 대부분의 거래 작업을 자동화할 수 있습니다. 구매하기 전에 데모 계정에서 데모 버전을 테스트할 수 있습니다. 데모 계정용 애플리케이션 체험판 다운로드: https://www.mql5.com/en/blogs/post/750865 . 전체 지침 여기 . 거래. 한 번의 클릭으로 거래를 수행할 수 있습니다: 리스크 자동 계산과 함께 예약 주문 및 포지션 열기. 한 번의 클릭으로 여러 주문 및 포지션 열기. 주문 그리드 열기. 예약 주문 및 포지션을 그룹별로 닫기. 포지션 방향 전환 (Buy 닫기 > Sell 열기, Sell 닫기 > Buy 열기). 포지션 잠금 (부족한 포지션을 열어 Buy와 Sell 포지션의 수량을 동일하게 만들기). 모든 포지션 한 번의 클릭으로 부분적으로 닫기. 모든 포지션의 테이크 프로핏과 스톱로스를 같은 가격 수준에 설정. 모든 포지션의 스톱로스를
    Strategy Builder offers an incredible amount of functionality. It combines a trade panel with configurable automation (covert indicators into an EA), real-time statistics (profit & draw down) plus automatic optimization of SL, TP/exit, trading hours, indicator inputs. Multiple indicators can be combined into an single alert/trade signal and can include custom indicators, even if just have ex4 file or purchased from Market. The system is easily configured via a CONFIG button and associated pop-up
    MT4 to Telegram Signal Provider 는 사용하기 쉽고 완전히 사용자 정의가 가능한 도구로, 텔레그램으로 신호를 보내어 계정을 신호 제공자로 변환할 수 있습니다. 메시지 형식은 완전히 사용자 정의가 가능합니다! 그러나 간단한 사용을 위해 미리 정의된 템플릿을 선택하고 메시지의 특정 부분을 활성화하거나 비활성화할 수도 있습니다. [ 데모 ]  [ 매뉴얼 ] [ MT5 버전 ] [ 디스코드 버전 ] [ 텔레그램 채널 ]  New: [ Telegram To MT5 ] 설정 단계별 사용자 가이드 가 제공됩니다. 텔레그램 API에 대한 지식이 필요 없으며, 개발자가 필요한 모든 것을 제공합니다. 주요 기능 구독자에게 보낸 주문 세부 정보를 사용자 정의할 수 있는 기능 예를 들어 브론즈, 실버, 골드와 같은 계층 구독 모델을 만들 수 있습니다. 골드 구독은 모든 신호 등을 받게 됩니다. ID, 심볼 또는 코멘트별 주문 필터링 주문이 실행된 차트의 스크린샷을 포함 보낸
    PZ Trade Pad Pro MT4
    PZ TRADING SLU
    3.67 (3)
    Effortlessly calculate lot sizes and manage trades to save time and avoid costly errors The Trade Pad Pro EA is a tool for the Metatrader Platform that aims to help traders manage their trades more efficiently and effectively. It has a user-friendly visual interface that allows users to easily place and manage an unlimited number of trades, helping to avoid human errors and enhance their trading activity. [ Installation Guide | Update Guide | Troubleshooting | FAQ | All Products ] One of the k
    TradeMirror 은 MT4/MT5 플랫폼을 위해 특별히 설계된 현지화된 주문 복사 도구로, 실시간 거래 작업을 동기화합니다. 튜토리얼 더 많은 튜토리얼을 보려면 Trademirror 튜토리얼 링크를 클릭하세요. 제품 장점 금융 소프트웨어의 보안성, 안정성 및 개인정보 보호에 대한 높은 표준 요구사항을 기반으로, 우리는 세 가지 핵심 차원에서 심층 최적화를 수행했습니다: 직관적이고 간결한 그래픽 인터페이스로 누구나 쉽게 조작 가능 강화된 개인정보 보호 메커니즘으로 금융 환경의 민감한 데이터 격리 요구 충족 밀리초 단위의 주문 동기화로 신호 분배의 정확성과 지연 없음 보장 MT4/MT5 양 플랫폼과 완전히 호환되어 다양한 거래 환경에 원활하게 적용 지능형 시스템 모니터링과 이메일 알림을 결합하여 거래 안정성을 실시간으로 보장 핵심 기능 특성 제품은 다음과 같은 전문적인 복사 기능을 탑재하고 있습니다: 다중 계정 병렬 연결 이메일 실시간 푸시 맞춤형 로트 크기 조정 신호 필터링 메커
    Trade Copier Global
    Laszlo Tormasi
    5 (15)
    Trade Copier Global: The name speaks for itself. This copier allows you to copy orders between MT4 terminals even if they are not installed on the same computer. Features Copying trades between MT4 terminals around the world with a short delay. Automatically recognizes symbol prefixes. Can connect many Slaves to the same Master. Supports pending and market orders. Supports partial order close (with limitations, see below) Can send messages and notifications to the Slaves from the Master Several
    복사기->편리하고 빠른 인터페이스 상호작용으로 사용자가 바로 사용 가능       ->>>> Windows 컴퓨터 또는 VPS Windows에서 사용하는 것이 좋습니다. 특징: 다양하고 개인화된 복사 거래 설정: 1. 다양한 신호 소스에 대해 다양한 로트 모드를 설정할 수 있습니다. 2. 다양한 신호 소스를 포워드 및 리버스 복사 거래에 대해 설정할 수 있습니다. 3. 신호는 주석으로 설정할 수 있습니다. 4. 계약 로트에 따라 로트를 교정할지 여부 다양하고 개인화된 복사 주문 설정 2: 1. 다양한 품종에 대해 다양한 로트 모드를 설정할 수 있습니다. 2. 정방향 및 역방향 복사 주문에 대해 다양한 품종을 설정할 수 있습니다. 3. 주석으로 신호를 설정할 수 있습니다. 4. 계약 로트에 따라 로트를 교정할지 여부 댓글 필터링, MAGIC 필터링, 시그널 로트 필터링, 로컬 제품 필터링 근무시간 설정 역동기화 SLAVE 닫힘 주문 바인딩 기능: 모든 주문은 설정된 신호 소스 주문
    Простая в управлении Торговая панель обеспечит безопасную торговлю. Вычислит объём сделки от заданного уровня Stop Loss и величины убытка. Поможет рассчитать сейф, и в ноль закрыть неверную сделку. Интуитивно понятный интерфейс делает панель удобной в управлении, освобождая внимание трейдера для принятия решения о входе в сделку. Программа сделает все расчёты за вас. Поэтому работа с помощью панели Снайпер - оптимальное решение для торговли с соблюдением Мани-менеджмента. А это главный ключ к по
    Trader Evolution MT4
    Siarhei Vashchylka
    5 (2)
    " Trader Evolution " - A utility designed for traders who use wave and technical analysis in their work. One tab of the utility is capable of money management and opening orders, and the other can help in making Elliott wave and technical analysis. Manual (Be sure to read before purchasing) | Version for MT5 Advantages 1. Trading in a few clicks. Immediate and pending orders are available in the panel 2. Money management. The program automatically selects the appropriate lot size 3. Simplifies
    Auto Trade Copier
    Vu Trung Kien
    4.76 (85)
    Auto Trade Copier is designed to copy trades to multiple MT4, MT5 and cTrader accounts/terminals with 100% accuracy. The provider and receiver accounts must be on the same PC/VPS. With this tool, you can copy trades to receiver accounts on the same PC/VPS. All trading actions will be copied from provider to receiver perfectly. This version can be used on MT4 accounts only. For MT5 accounts, you must use Auto Trade Copier for MT5 . Reference: - For MT4 receiver, please download Trade Receiver Fre
    Telegram to MT4 Coppy
    Sergey Batudayev
    4.09 (11)
    Telegram에서 MT4로:   최고의 신호 복사 솔루션 최첨단 유틸리티인   Telegram to MT4를   사용하여 거래를 간소화하세요. DLL 없이도 Telegram 채널과 채팅에서 MetaTrader 4 플랫폼으로 거래 신호를 직접 복사할 수 있습니다. 이 강력한 솔루션은 탁월한 정밀도와 맞춤 설정 옵션을 통해 원활한 신호 실행을 보장하여 시간을 절약하고 효율성을 높여줍니다. [ Instructions and DEMO ] 주요 특징 직접 Telegram API 통합 전화번호와 보안 코드를 통해 인증하세요. 사용자 친화적인 EXE 브리지를 사용하여 채팅 ID를 손쉽게 가져오고 관리하세요. 여러 채널/채팅을 추가, 삭제, 새로 고침하여 동시에 신호를 복사합니다. 고급 필터를 사용한 신호 파싱 사용자 정의 예외 단어(예: "보고서", "요약")가 포함된 원치 않는 신호를 건너뜁니다. 유연한 SL 및 TP 형식을 지원합니다: 가격, 핍 또는 포인트. 신호가 가격 대신 지점을 지정
    Custom Alerts AIO: 다중 시장을 동시에 모니터링 – 설정 없이 즉시 사용 가능 개요 Custom Alerts AIO 는 복잡한 설정 없이 즉시 사용할 수 있는 통합 시장 모니터링 도구입니다. FX Power, FX Volume, FX Dynamic, FX Levels, IX Power 등 필요한 모든 지표가 내장되어 있어 별도의 설치나 구성 없이 알림 기능을 바로 사용할 수 있습니다. 차트 그래픽 없이 작동하며, Forex, 금속, 지수, 암호화폐 등 주요 자산군을 모두 지원합니다. 주식(Symbols)은 별도로 입력하여 추가할 수 있으나, MetaTrader에서는 일반적으로 제한적으로만 사용됩니다. 1. 왜 Custom Alerts AIO를 선택해야 하나요? 추가 라이선스가 필요 없습니다 • 모든 Stein Investments 지표가 내장되어 있어 별도 구매가 필요 없습니다. • 즉시 알림 기능을 시작할 수 있어 빠르고 간편합니다. 모든 시장을 하나의 도구로
    MACD Divergence Scanner is a multi-timeframe and multi-symbol dashboard and alert that checks all timeframes and symbols to find regular and hidden divergences between price chart and MACD indicator. This divergence scanner is integrated with support and resistance zones so you can check the MACD divergences in the most important areas of the chart to find trend reversals in the price chart. Download demo version   (works on M 1,M5,M30,W1   timeframes) Full description of scanner parameters ->  
    Candlestick Pattern Scanner is a multi-timeframe and multi-symbol dashboard and alert system that checks all timeframes and currency pairs for different candlestick patterns that are formed in them. Scanner is integrated with support and resistance zones so you can check the candlestick patterns in the most important areas of the chart to find breakout and reversal patterns in the price chart. Download demo version   (works on M30,D1,W1 timeframes and 20 symbols of Market Watch window) Read the
    The News Filter
    Leolouiski Gan
    5 (25)
    이 제품은 뉴스 시간 동안 모든 전문가 어드바이저 및 수동 차트를 필터링하여 수동 거래 설정이나 다른 전문가 어드바이저가 입력한 거래가 파괴될 수 있는 급격한 가격 상승으로부터 걱정하지 않아도 됩니다. 이 제품은 또한 뉴스 발표 전에 열린 포지션과 대기 주문을 처리할 수 있는 완전한 주문 관리 시스템이 함께 제공됩니다. The News Filter  를 구매하면 더 이상 내장 뉴스 필터에 의존할 필요가 없으며 이제부터 모든 전문가 어드바이저를 여기서 필터링할 수 있습니다. 뉴스 선택 뉴스 소스는 Forex Factory의 경제 캘린더에서 얻어집니다. USD, EUR, GBP, JPY, AUD, CAD, CHF, NZD 및 CNY와 같은 어떤 통화 기준으로 선택할 수 있습니다. Non-Farm (NFP), FOMC, CPI 등과 같은 키워드 식별을 기준으로 선택할 수도 있습니다. 저, 중, 고 영향을 가지는 뉴스를 필터링할 수 있도록 선택할 수 있습니다. 차트와 관련된 뉴스만 선택하
    EasyInsight AIO MT4
    Alain Verleyen
    4 (2)
    EASY Insight AIO – 스마트하고 손쉬운 트레이딩을 위한 올인원 솔루션 개요 외환, 금, 암호화폐, 지수, 심지어 주식까지 — 전 시장을 몇 초 만에, 수동 차트 확인이나 복잡한 설치, 인디케이터 설정 없이 스캔할 수 있다고 상상해 보세요. EASY Insight AIO 는 AI 기반 트레이딩을 위한 궁극의 플러그 앤 플레이(Plug & Play) 데이터 내보내기 도구입니다. 단 하나의 깔끔한 CSV 파일로 전체 시장 스냅샷을 제공하며, ChatGPT, Claude, Gemini, Perplexity 등 다양한 AI 플랫폼에서 즉시 분석할 수 있습니다. 창 전환, 복잡함, 차트 오버레이는 더 이상 필요 없습니다. 자동으로 내보내지는 순수하고 구조화된 데이터 인사이트만으로, 반복적인 차트 감시 대신 데이터 기반의 스마트한 의사결정에 집중할 수 있습니다. 왜 EASY Insight AIO인가요? 진정한 올인원 • 별도의 설정, 인디케이터 설치, 차트 오버레이가 필요 없습
    RSI Divergence Scanner is a multi-timeframe and multi-symbol dashboard and alert that checks all timeframes and symbols to find divergences between price chart and RSI indicator. This divergence scanner is integrated with support and resistance zones so you can check the RSI divergences in the most important areas of the chart to find trend reversals in the price chart. Download demo version   (works on M 1,M5,M30,W1 timeframes) Full description of scanner parameters ->   click here . How to get
    Trade Manager MT4 DaneTrades
    Levi Dane Benjamin
    4.09 (11)
    거래 관리자는 위험을 자동으로 계산하는 동시에 거래를 빠르게 시작하고 종료하는 데 도움을 줍니다. 과잉 거래, 복수 거래 및 감정 거래를 방지하는 데 도움이 되는 기능이 포함되어 있습니다. 거래를 자동으로 관리할 수 있으며 계정 성과 지표를 그래프로 시각화할 수 있습니다. 이러한 기능은 이 패널을 모든 수동 거래자에게 이상적으로 만들고 MetaTrader 4 플랫폼을 향상시키는 데 도움이 됩니다. 다중 언어 지원. MT5 버전  |  사용자 가이드 + 데모 트레이드 매니저는 전략 테스터에서 작동하지 않습니다. 데모를 보려면 사용자 가이드로 이동하세요. 위기 관리 % 또는 $를 기준으로 위험 자동 조정 고정 로트 크기 또는 거래량과 핍을 기반으로 한 자동 로트 크기 계산을 사용하는 옵션 RR, Pips 또는 Price를 사용한 손익분기점 손실 설정 추적 중지 손실 설정 목표 달성 시 모든 거래를 자동으로 마감하는 최대 일일 손실률(%)입니다. 과도한 손실로부터 계정을 보호하고 과도한
    Unlimited Trade Copier Pro is a tool to copy trade remotely to multiple MT4, MT5 and cTrader accounts at different computers/locations over internet. This is an ideal solution for you if you are a signal provider and want to copy your trades to other receivers globally on your own rules. One provider can copy trades to multiple receivers and one receiver can get trade from multiple providers as well. The provider can even set the subscription expiry for each receiver, so that receiver will not b
    In the current version this filter will only work with my   night scalpers and the EA Profitection Filter  or with other EAs that utilize the global variables set by this EA.  An MT5 version is availalble   here .  Many scalpers these days have a "normal" news filter, which filters calendar news such as interest rate decisions or CPI releases.  However, this breaking news filter is able to filter non-standard breaking news. It will check every minute for news and if it finds a news event, it w
    ManHedger MT4
    Peter Mueller
    5 (2)
    THIS EA IS A SEMI-AUTO EA, IT NEEDS USER INPUT. Manual & Test Version Please TEST this product before   BUYING  and watch my video about it. Contact me for user support or bug reports, or if you want the MT5 version! MT5 Version I do not guarantee any profits or financial success using this EA. With this Expert Advisor, you can: Implement your own   Zone Recovery   strategy to capitalize on trending markets. Create   Grid   trading strategies, to profit from ranging markets. Place orders easil
    Close by percentage MT4
    Konstantin Kulikov
    5 (1)
    Hello friends. I wrote this utility specifically for use in my profile with a large number of Expert Advisors and sets ("Joint_profiles_from_grid_sets" https://www.mql5.com/en/blogs/post/747929 ). Now, in order to limit losses on the account, there is no need to change the "Close_positions_at_percentage_of_loss" parameter on each chart. Just open one additional chart, attach this utility and set the desired percentage for closing all trades on the account. The utility has the following function
    VirtualTradePad PRO SE MT4 — MetaTrader 4용 고급 트레이딩 패널 및 차트 워크스페이스 VirtualTradePad PRO SE 는 MetaTrader 4 용 전문 트레이딩 패널이자 거래 관리 워크스페이스입니다. 하나의 차트 기반 인터페이스에서 거래를 더 빠르게 열고, 관리하고, 보호하고, 닫고, 분석할 수 있도록 도와줍니다. 이 제품은 단순한 버튼 모음 이상의 기능이 필요한 적극적인 수동 트레이더를 위해 만들어졌습니다. PRO SE는 원클릭 실행, 예약 주문, 포지션 제어, 부분 청산, 바스켓 손익 로직, 평균가 레벨, ATM 규칙, 신호 모니터링, 시장 정보, 전략 테스터 워크플로, VPS 중심 준비를 하나의 구조화된 워크스페이스로 통합합니다. MT5 버전 | 전체 설명 및 스크린샷 | 구입 방법 | 설치 방법 | 로그 파일을 얻는 방법 | 테스트 및 최적화 방법 | Expforex의 모든 제품 일반 수동 트레이딩 대비 장점 여러 창 대신 하나의 워
    Elevate Your Trading Signals with Our Advanced Telegram Bridge EA It’s time to captivate your audience with real-time trading updates that are both professional and visually appealing. Contact me to receive a trial and see the demo channel! We have significantly invested in user friendly features that create a unique experience for customers and providers.  SIGNAL BRIDGE is able to deliver 100% COPIER FRIENDLY SIGNALS for all business cases, even bypassing Metatrader logics where other EAs stru
    제작자의 제품 더 보기
    Running along Lines MT5
    Pavel Verveyko
    5 (1)
    The indicator draws support and resistance lines on an important part of the chart for making decisions. After the trend line appears, you can trade for a breakout or rebound from it, as well as place orders near it. Outdated trend lines are deleted automatically. Thus, we always deal with the most up-to-date lines. The indicator is not redrawn . Settings: Size_History  - the size of the calculated history. Num_Candles_extremum  - the number of candles on each side of the extremum. Type_Arrow
    Ichimoku Map MT5
    Pavel Verveyko
    Ichimoku Map (instant look at the markets) - built on the basis of the legendary Ichimoku Kinko Hyo indicator. The task of the Ichimoku Map is to provide information about the market strength on the selected time periods and instruments, from the point of view of the Ichimoku indicator. The indicator displays 7 degrees of buy signal strength and 7 degrees of sell signal strength. The stronger the trend, the brighter the signal rectangle in the table. The table can be dragged with the mouse. The
    Turn
    Pavel Verveyko
    The indicator shows the market turning points (entry points). Reversals allow you to track rebound/breakout/testing from the reverse side of the lines of graphical analysis or indicators. Reversals can be an independent signal. The indicator allows you to determine reversals taking into account the trend and without it. You can choose a different period for the movement preceding the reversal, as well as the volatility coefficient. When plotting reversals, the indicator takes into account volati
    Length Movement
    Pavel Verveyko
    5 (1)
    Measures the length of the selected movement in points, shows the duration of the movement, as well as the speed of movement.   Outputs the average value of each dimension. It is designed to calculate the expected target based on typical market movements. The intended goal will provide information about the ratio of the stop size to the possible profit and will allow you not to open positions with a small expected profit. It will also help you determine the point at which it is more logical to c
    Ratio TP SL
    Pavel Verveyko
    5 (1)
    This indicator allows you to measure the profitability of each specific transaction (the ratio of Stop and Profit). The indicator allows you to adjust the ratio by step size and number of steps. You can build an unlimited number of ratios to compare the risks from different movements. Note: in MT4, the number of horizontal lines in a single ratio cannot exceed 32. Building a line : click the " Ratio " button and draw a line (mouse click - the first point of the line, where the mouse is release
    Corporate Report
    Pavel Verveyko
    5 (1)
    The script displays info about the share's corporate reports and dividends. The data is downloaded from   investing.com : Report date Profit per share (EPS) Revenue Market capitalization Amount of dividends Date of payment of dividends Dividend income The product cannot be tested in the tester (since it is not possible to receive data from the Internet). Before launching:  Add 2   URL   https://ru.investing.com/earnings-calendar/Service/getCalendarFilteredData  and   https://ru.investing.com/di
    Channel FTF
    Pavel Verveyko
    The Envelopes indicator determines the presence of a trend or flat. It has 3 types of signals, shows the probable retracement levels and levels of the possible targets. The Fibonacci coefficients are used in the indicator's calculations. Signals (generated when touching the lines or rebounding from lines): Trend - the middle line of the Envelopes has a distinct inclination; the lines below the channel's middle line are used for buy trades, the lines above the middle line and the middle line itse
    Mr Big
    Pavel Verveyko
    The indicator shows and highlights the chart candles, which are formed as a result of large players entering the market in large volumes. Such candles can also be formed after achieving a certainty on the market, when most of the participants hold positions in the same direction. The movement is likely to continue in that direction after such candles. The indicator highlights the significant candles from the existing ones on the chart; The indicator allows identifying the trends based on candles
    Splash
    Pavel Verveyko
    The indicator identifies the most suitable moment for entering the market in terms of market volatility, when the market has the strength to move (the signal is indicated by an arrow under the candle). For each of the signals, the presence of trends on the current and higher timeframes is determined, so that the signal is in the direction of the majority of positions opened on the market (denoted near the signal by abbreviations of timeframes with a trend present). The signal appears after the c
    The indicator displays the key support and resistance levels on the chart. The significance of these levels lies in that the price may reverse or strengthen the movement when passing such levels, since they are formed as a consequence of the natural reaction of market participants to the price movement, depending on which positions they occupied or did not have time to occupy. The psychology of the level occurrence: there always those who bought, sold, hesitated to enter or exited early. If the
    This indicator is a multitimeframe trading strategy. It has the levels for stop loss, take profit and entry point. The order level can also be set manually. The indicator uses the regularity of the market, which manifests itself on all instruments, and does not require adjustment of the parameters. The strategy uses a proprietary approach to determining: trend, volatility, hierarchy of timeframe significance, the size of the history period (the number of candles), which is important for making a
    Trend Sync
    Pavel Verveyko
    5 (1)
    The indicator shows the trend of 3 timeframes: higher timeframe; medium timeframe; smaller (current) timeframe, where the indicator is running. The indicator should be launched on a chart with a timeframe smaller than the higher and medium ones. The idea is to use the trend strength when opening positions. Combination of 3 timeframes (smaller, medium, higher) allows the trend to be followed at all levels of the instrument. The higher timeframes are used for calculations. Therefore, sudden change
    The indicator detects important peaks and troughs (extremes) on the chart. These points can be used to plot support/resistance levels and trend lines, as well as any other graphical analysis. These points can serve as reference points for setting trading orders. The indicator does not redraw . Settings: Size_History  - the size of the calculated history. Num_Candles_Right  - number of candles to the right of the peak or trough. Num_Candles_Left  - number of candles to the left of the peak or
    Running along Lines
    Pavel Verveyko
    3 (2)
    The indicator draws support and resistance lines on an important part of the chart for making decisions. After the trend line appears, you can trade for a breakout or rebound from it, as well as place orders near it. Outdated trend lines are deleted automatically. Thus, we always deal with the most up-to-date lines. The indicator is not redrawn . Settings: Size_History  - the size of the calculated history. Num_Candles_extremum  - the number of candles on each side of the extremum. Type_Arrow
    Key Volumes
    Pavel Verveyko
    1 (1)
    The indicator shows key volumes confirmed by the price movement. The indicator allows you to analyze volumes in the direction, frequency of occurrence, and their value. There are 2 modes of operation: taking into account the trend and not taking into account the trend (if the parameter Period_Trend = 0, then the trend is not taken into account; if the parameter Period_Trend is greater than zero, then the trend is taken into account in volumes). The indicator does not redraw . Settings History_S
    Catch Impulse
    Pavel Verveyko
    This trading system is based on market impulses of varying complexity.   To generate a signal, the indicator uses the moments when the direction of the pulse and the necessary section of the trend coincide. The indicator also takes into account the current market volatility. Stop_loss tags can be set with the parameter "0" or "1", then Stop_Loss will take into account market volatility.   Take_Profit tags can be set with the parameter "0", then Take_Profit will take into account market volatil
    Indexes
    Pavel Verveyko
    The stocks that make up the index are one of the drivers of the movement. Analyzing the financial performance of all elements of the index, we can assume further development of the situation. The program (script) displays corporate reports of shares that are part of the index selected in the settings.   "Indexes" cannot be tested in the tester (since there is no way to get information from the Internet). Information is downloaded from the site investing.com: Report Date Earnings per share (E
    Fibo World
    Pavel Verveyko
    The indicator builds a graphical analysis based on the Fibonacci theory. Fibo Fan is used for the analysis of the impulses and corrections of the movement. Reversal lines (2 lines at the base of the Fibonacci fan) are used to analyze the direction of movements. The indicator displays the of 4 the target line in each direction. The indicator takes into account market volatility. If the price is above the reversal lines, it makes sense to consider buying, if lower, then selling. You can open posi
    The indicator determines the state of the market: trend or flat. The state of the market is determined by taking into account volatility. The flat (trading corridor)is displayed in yellow. The green color shows the upward trend. The red color shows the downward trend. The height of the label corresponds to the volatility in the market. The indicator does not redraw . Settings History_Size   - the amount of history for calculation. Period_Candles  - the number of candles to calculate the indicat
    The indicator plots flexible support and resistance levels (dots). A special phase of movement is used for construction. Levels are formed dynamically, that is, each new candle can continue the level or complete it. The level can provide resistance or support to the price even where it is no longer there. Also, support and resistance levels can change roles. The importance of levels is affected by: the amount of time the level is formed and the number of touches. The significance of these lev
    The indicator is a trading system for short-term trading. Scalper Assistant helps to determine the direction of the transaction, and also shows the entry and exit points. The indicator draws two lines (possible points for opening positions). At the moment of the breakdown of the upper line up (and when all trading conditions are met), an up arrow appears (a buy signal), as well as 2 goals. At the moment of the breakdown of the lower line down (and when all trading conditions are met), a down ar
    Gold n XAU
    Pavel Verveyko
    The trading system is designed to work with gold on time periods: 30M, 1H. The indicator allows you to adjust to the market situation. Parameters for 1H :   PERIOD=9F ,   FILTER=300 .   Parameters for  30M :   PERIOD=22B ,   FILTER=450 .   A small adjustment to a specific broker is allowed .   If you change the amount of history displayed, you may also need to adjust the parameters. The indicator is not redrawn.     "Gold n XAU" uses different rules for entering a trade and different rules fo
    The indicator builds "psychological levels": levels of round numbers and intermediate levels of round numbers. Round numbers play an important role in forming support and resistance levels. There is a pattern in which the decline or growth of the price can stop at round numbers. The level whose price ends at 0 is the level of a round number of the first order. Intermediate level, this is the level between two round levels, for example, between 10 and 20 this is level 15. In the " Num_Zeros "
    Ichimoku Map
    Pavel Verveyko
    Ichimoku Map (instant look at the markets) - built on the basis of the legendary Ichimoku Kinko Hyo indicator. The task of the Ichimoku Map is to provide information about the market strength on the selected time periods and instruments, from the point of view of the Ichimoku indicator. The indicator displays 7 degrees of buy signal strength and 7 degrees of sell signal strength. The stronger the trend, the brighter the signal rectangle in the table. The table can be dragged with the mouse. The
    The indicator displays a stock chart of a non-standard type, in which the price and time have the same value. The usual chart of Japanese candlesticks does not take into account all the information that the time analysis can give. Renko charts do not use all the information that price can give in relation to time. The "Chart Price and Time" indicator takes into account price and time equally and shows the predominance of price or time. Taking into account price and time equally gives an idea
    The indicator tracks sharp volatility (moments when the market has shown increased activity and movement may occur), on the selected instruments and time periods. The information is displayed as colored rectangles. Thus, it is possible to assess at a glance which tool should be given priority attention. The indicator will be useful for scalpers when they need a quick reaction or for traders working with a large number of instruments. The indicator does not redraw. The indicator displays 8 degree
    Alert Creator
    Pavel Verveyko
    The Alert Creator indicator is designed to create alerts for selected conditions. You can select one or several indicators for the notification. If several conditions are selected, the alert is triggered when all the selected conditions are met. The signals can be configured separately for buying and separately for selling. Example, a buy alert: the closing price is above the moving average, the RSI is below 20. (In this example, 2 indicators are used to generate an alert: MA and RSI) At the
    Trend Arithmetic
    Pavel Verveyko
    The indicator determines the strength of the trend and its possible reversal points, based on the author's arithmetic approach . Each new peak or trough is a trend development. Such peaks and troughs are numbered so that the strength of the trend development can be seen. Attempts to change the trend are also numbered. This gives an understanding of a possible change in the direction of the trend. Indicator signals are generated when trying to change the trend . In the settings, it is possible
    Jumping along Levels is dedicated to the most important aspect of trading: support and resistance levels. This indicator is built using a unique technology based on proprietary development and testing algorithms. The indicator has a built-in intelligent market situation assessment system. It can automatically adjust to varying market volatility. Jumping along Levels simultaneously displays levels from different time periods on the current chart. It has a graphical table for working with comple
    필터:
    hkarram
    288
    hkarram 2021.12.05 15:56 
     

    사용자가 평가에 대한 코멘트를 남기지 않았습니다

    mambobody
    462
    mambobody 2019.07.21 22:41 
     

    사용자가 평가에 대한 코멘트를 남기지 않았습니다

    리뷰 답변