PSAR Parabolic SAR Signal Arrow MultiFilter Trend

PSAR Parabolic SAR Signal Arrow MultiFilter Trend

Overview

Parabolic SAR Multi Filter No Repaint Signal MT4 is a technical analysis indicator engineered for the MetaTrader 4 platform. The tool combines classical Parabolic Stop and Reverse (PSAR) directional reversal detection with a modular 15-filter confirmation architecture and automated Average True Range (ATR) target mapping. It is designed to help traders identify confirmed directional shifts on closed candlesticks while filtering out low-momentum or counter-trend price fluctuations across multiple market regimes.
All signal calculations are strictly anchored to completed historical bars, ensuring that plotted BUY and SELL entry arrows do not repaint, shift, or disappear once a candlestick has closed. In addition to directional signal arrows, the indicator dynamically renders horizontal reference levels for Entry, Stop Loss (SL), and three risk-reward Take Profit targets (TP1, TP2, TP3) directly on the price chart, paired with a multi-channel notification system for real-time market monitoring.

Operating Principle and Signal Logic
The indicator operates through a sequential four-stage technical pipeline executed on each newly closed bar:
- Primary Parabolic SAR Reversal Engine: The core module continuously tracks Parabolic SAR acceleration dots relative to candlestick price extremes using configurable step and maximum acceleration parameters. A potential directional transition is registered only when the Parabolic SAR polarity flips from one side of price action to the opposite side across consecutive completed candles.
- Strict Closed-Bar Non-Repainting Architecture: Signal evaluation is restricted exclusively to closed bars (bar index 1 and older). The currently forming live candle (bar index 0) is intentionally excluded from signal arrow plotting. Consequently, no tentative intra-bar arrows appear before candle close, and every confirmed signal arrow remains permanently fixed at its historical bar coordinate.
- Bullish (BUY) Signal Generation Conditions: A BUY arrow is generated upon candle close when the Parabolic SAR dots transition from above price action to below price action, confirming an upward directional shift, AND all user-activated confirmation filters simultaneously validate bullish market alignment on that same closed bar. When all active criteria are satisfied, a BUY arrow is plotted below the signal candle low at a configurable ATR-proportioned offset.
- Bearish (SELL) Signal Generation Conditions: A SELL arrow is generated upon candle close when the Parabolic SAR dots transition from below price action to above price action, confirming a downward directional shift, AND all user-activated confirmation filters simultaneously validate bearish market alignment on that same closed bar. When all active criteria are satisfied, a SELL arrow is plotted above the signal candle high at a configurable ATR-proportioned offset.
- Modular 15-Filter Confluence Gate: Before any Parabolic SAR flip is validated as an actionable chart arrow, the candidate bar passes through an independent multi-filter verification suite. Each of the 15 built-in filter modules evaluates a distinct technical dimension—including oscillator threshold crossovers, directional trend strength, single and dual moving average alignment, Ichimoku cloud boundaries, macro-momentum midlines, Awesome Oscillator histogram dynamics, secondary SAR alignment, Heiken Ashi smoothed candle polarity, Commodity Channel Index regimes, Relative Vigor Index crossovers, MACD histogram and zero-axis polarity, dynamic Support/Resistance zones, Fibonacci retracement clusters, and ATR-based Supertrend direction. Disabled filters are bypassed automatically, while enabled filters operate in logical conjunction so that every active condition must agree before a signal is emitted.
- Dynamic ATR Volatility Risk and Reward Projection: Whenever a valid BUY or SELL signal is confirmed, the indicator samples the signal bar ATR value multiplied by a user-defined risk factor to establish the initial 1R risk distance. From the signal candle closing price, it automatically projects a horizontal Entry level, a protective Stop Loss level at 1R, and three progressive Take Profit levels at 1R (TP1), 2R (TP2), and 3R (TP3).

Key Technical Features
- Closed-Bar Signal Integrity: Evaluates and locks BUY and SELL arrows strictly after candlestick closure, preventing intra-bar signal flickering or historical recalculation drift.
- 15 Independent Confirmation Modules: Integrates 15 distinct technical filters inside a unified input panel, allowing traders to combine trend, momentum, volatility, and price-structure confirmations without attaching external indicators to the chart.
- Automated ATR Target Visualization: Draws clean horizontal segments and right-aligned price labels for Entry, Stop Loss, TP1 (1R), TP2 (2R), and TP3 (3R) anchored to the most recent confirmed signal.
- Granular Visual Customization: Provides full control over Wingdings arrow symbols, arrow line widths, candle-range vertical offsets, target line styles, label font sizes, and individual color assignments for every graphical element.
- Synchronized Multi-Channel Alerts: Supports MetaTrader pop-up alert windows, custom WAV sound playback, mobile push notifications via MetaQuotes ID, and SMTP email alerts triggered once per closed signal bar.
- Lightweight Single-Chart Execution: Encapsulates all 15 filter engines internally within a single compiled indicator file, eliminating template clutter and external file dependencies.

Graphical Interface, Alerts, and Computational Efficiency
- On-Chart Visual Elements and Color Legend:
  - Parabolic SAR Dots (Default: DodgerBlue): Dotted trajectory tracking trailing acceleration levels above or below price bars.
  - BUY Entry Arrow (Default: Aqua, Wingdings 233): Upward arrow plotted below the confirmed bullish signal candle low.
  - SELL Entry Arrow (Default: Red, Wingdings 234): Downward arrow plotted above the confirmed bearish signal candle high.
  - Entry Reference Line (Default: Gold, Solid): Horizontal line marking the closing price of the most recent valid signal bar, accompanied by a right-aligned BUY or SELL price label.
  - Stop Loss Reference Line (Default: Red, Dashed): Horizontal line indicating the 1R ATR-based invalidation level with an exact SL price label.
  - Take Profit Target Lines (Default: LimeGreen for TP1, MediumSeaGreen for TP2, DodgerBlue for TP3, Dashed): Three horizontal reward projection lines displaying 1R, 2R, and 3R price targets.
- Multi-Channel Alert System Behavior:
  - Alerts are dispatched exclusively when a newly closed bar (bar index 1) produces a validated BUY or SELL arrow.
  - Built-in duplicate suppression tracks the timestamp of the last alerted bar so that each confirmed signal triggers at most one notification per channel, regardless of incoming tick frequency.
  - Each alert message includes the signal direction, instrument symbol, active chart timeframe, and exact signal bar timestamp.
- Computational Performance and Terminal Resource Management:
  - The indicator requires a minimum history of 100 loaded bars on the active chart to stabilize long-period filters and volatility buffers.
  - After initial historical loading, incremental calculation updates only newly formed bars rather than recalculating the entire chart history on every tick.
  - On-chart SL/TP lines and labels are rendered only for the single most recent confirmed signal and are automatically removed when the indicator is detached or chart parameters reset, keeping chart object counts minimal.
  - When running the indicator simultaneously across numerous open charts with computationally intensive structural filters active (such as Fibonacci ZigZag swing scanning or Support/Resistance lookbacks), users are advised to limit the number of simultaneously open charts according to workstation CPU and memory capacity.

Operation and Setup Recommendations
- Supported Financial Instruments: Suitable for major and minor Forex currency pairs (such as EURUSD, GBPUSD, USDJPY, AUDUSD, USDCAD), precious metals (such as XAUUSD), stock indices, and liquid CFDs. Traders should evaluate instrument-specific spread and volatility characteristics before deployment.
- Recommended Timeframes: Compatible with all standard MetaTrader 4 timeframes from M1 to MN1. Intraday traders commonly apply the indicator on M5, M15, and M30 charts using tighter ATR multipliers, while swing traders generally favor H1, H4, and D1 timeframes for broader directional filtering.
- Broker Account and Execution Environment: Operates seamlessly on standard, ECN, and Raw Spread MT4 accounts across both Hedging and Netting account structures. For lower timeframes (M1 to M15), a low-spread ECN broker environment is recommended so that spread costs remain proportional to the projected 1R ATR Stop Loss distance.
- Practical Filter Configuration Workflow: All 15 confirmation filters are disabled by default so users can first observe baseline Parabolic SAR reversal signals. Rather than enabling all 15 filters simultaneously—which can overly restrict signal frequency—traders are encouraged to activate 1 to 3 complementary filters from non-overlapping categories (for example, pairing one macro-trend filter such as Double MA or Supertrend with one momentum filter such as ADX or MACD).

Input Parameters Documentation
All configuration parameters available in the MetaTrader 4 Inputs tab are organized into functional groups below:

Group 1: PSAR Entry Logic Parameters (Section Header: InpGroup1)
- InpStep (Default: 0.02) - Acceleration factor step increment governing how rapidly Parabolic SAR dots converge toward price action during a trend (unit: decimal factor).
- InpMaximum (Default: 0.20) - Upper ceiling limit for the Parabolic SAR acceleration factor (unit: decimal factor).

Group 2: Display Settings (Section Header: InpGroup2)
- InpSARColor (Default: clrDodgerBlue) - Color applied to the primary Parabolic SAR dotted curve plotted on the main chart (unit: color).
- InpBuyColor (Default: clrAqua) - Color applied to confirmed bullish BUY signal arrows (unit: color).
- InpSellColor (Default: clrRed) - Color applied to confirmed bearish SELL signal arrows (unit: color).
- InpArrowCodeBuy (Default: 233) - Wingdings character code defining the graphical icon shape for BUY arrows (unit: integer Wingdings code).
- InpArrowCodeSell (Default: 234) - Wingdings character code defining the graphical icon shape for SELL arrows (unit: integer Wingdings code).
- InpArrowWidth (Default: 2) - Rendering thickness size of BUY and SELL signal arrows, valid from 1 to 5 (unit: pixel width level).
- InpOffsetATR (Default: 0.3) - Vertical spacing offset between the signal candle high/low and the plotted arrow, scaled as a fraction of the signal candle range (unit: candle-range multiplier).

Group 3: Alerts and Notifications (Section Header: InpGroup3)
- InpAlerts (Default: true) - Enables or disables standard MetaTrader terminal pop-up alert dialog boxes on closed-bar signal confirmation (unit: boolean true/false).
- InpAlertSound (Default: true) - Enables or disables audible WAV sound alerts when a valid signal triggers (unit: boolean true/false).
- InpAlertPush (Default: true) - Enables or disables mobile push notifications delivered to iOS/Android MetaTrader apps via MetaQuotes ID (unit: boolean true/false).
- InpAlertEmail (Default: false) - Enables or disables email signal alerts dispatched through the terminal SMTP mail configuration (unit: boolean true/false).
- InpSoundFile (Default: "alert.wav") - Name of the audio file inside the MetaTrader Sounds folder played during sound alerts (unit: text string filename).

Group 4: ATR and Target Levels SL/TP (Section Header: InpGroup4)
- InpShowLines (Default: true) - Toggles on-chart rendering of Entry, Stop Loss, and Take Profit horizontal target lines for the latest signal (unit: boolean true/false).
- InpATRPeriod (Default: 7) - Lookback bar period used to compute the Average True Range volatility baseline at the signal candle (unit: bars).
- InpATRMult (Default: 1.5) - Multiplier applied to the signal bar ATR value to define the 1R Stop Loss risk distance (unit: ATR multiplier).
- InpLineExtendBars (Default: 1) - Number of chart bars to extend the Entry, SL, and TP horizontal lines to the right beyond the current bar (unit: bars).
- InpFontSize (Default: 8) - Typographic font size for the right-aligned price labels attached to Entry, SL, and TP lines (unit: font points).
- InpColorEntry (Default: clrGold) - Color of the solid horizontal Entry price reference line and text label (unit: color).
- InpColorSL (Default: clrRed) - Color of the horizontal Stop Loss reference line and text label (unit: color).
- InpColorTP1 (Default: clrLimeGreen) - Color of the first Take Profit target line and label set at 1R reward distance (unit: color).
- InpColorTP2 (Default: clrMediumSeaGreen) - Color of the second Take Profit target line and label set at 2R reward distance (unit: color).
- InpColorTP3 (Default: clrDodgerBlue) - Color of the third Take Profit target line and label set at 3R reward distance (unit: color).
- InpTargetLineStyle (Default: STYLE_DASH) - Line drawing style (solid, dash, dot, dash-dot) applied to SL, TP1, TP2, and TP3 lines (unit: ENUM_LINE_STYLE enumeration).
- InpLineWidth (Default: 1) - Line thickness applied to Entry, SL, and TP horizontal lines (unit: pixel width).

Filter Module 1: RSI Cross Filter (Section Header: InpFilter1)
- Use_RSI_Cross_Filter (Default: false) - Enables or disables Relative Strength Index threshold crossover validation (unit: boolean true/false).
- RSI_Length (Default: 14) - Averaging lookback period for the RSI oscillator calculation (unit: bars).
- RSI_Price_Source (Default: PRICE_CLOSE) - Applied candlestick price series used for RSI calculation (unit: ENUM_APPLIED_PRICE enumeration).
- RSI_Oversold (Default: 30.0) - Lower RSI boundary level used to confirm bullish recovery crossovers (unit: RSI index points, 0 to 100).
- RSI_Overbought (Default: 70.0) - Upper RSI boundary level used to confirm bearish reversal crossovers (unit: RSI index points, 0 to 100).

Filter Module 2: ADX Trend Filter (Section Header: InpFilter2)
- Use_ADX_Filter (Default: false) - Enables or disables Average Directional Movement Index trend-strength filtering (unit: boolean true/false).
- ADX_Period (Default: 10) - Lookback period for calculating the ADX main strength line (unit: bars).
- ADX_Min_Level (Default: 20.0) - Minimum ADX reading required to confirm active directional trend strength (unit: ADX index points).

Filter Module 3: Single MA Filter (Section Header: InpFilter3)
- Use_MA_Filter (Default: false) - Enables or disables single Moving Average directional price-position filtering (unit: boolean true/false).
- MA_Period (Default: 50) - Lookback averaging period for the baseline Moving Average (unit: bars).
- MA_Method (Default: MODE_SMA) - Averaging smoothing method such as SMA, EMA, SMMA, or LWMA (unit: ENUM_MA_METHOD enumeration).
- MA_Shift (Default: 0) - Horizontal bar shift offset applied to the Moving Average series (unit: bars).

Filter Module 4: Ichimoku Senkou Span B Filter (Section Header: InpFilter4)
- Use_Ichimoku_Filter (Default: false) - Enables or disables Ichimoku Kinko Hyo Senkou Span B cloud boundary trend filtering (unit: boolean true/false).
- Ichimoku_Tenkan (Default: 9) - Tenkan-sen (Conversion Line) calculation period (unit: bars).
- Ichimoku_Kijun (Default: 26) - Kijun-sen (Base Line) calculation period (unit: bars).
- Ichimoku_SenkouB (Default: 52) - Senkou Span B (Leading Span B) calculation period defining the primary cloud boundary (unit: bars).

Filter Module 5: RSI 75 Filter (Section Header: InpFilter5)
- Use_RSI75_Filter (Default: false) - Enables or disables long-period RSI 50-midline macro-trend bias filtering (unit: boolean true/false).
- RSI_Filter_Period (Default: 75) - Extended lookback period for the macro-momentum RSI filter (unit: bars).

Filter Module 6: Double MA Filter (Section Header: InpFilter6)
- Use_DoubleMA_Filter (Default: false) - Enables or disables dual Moving Average directional alignment filtering (unit: boolean true/false).
- MA_A_Period (Default: 30) - Lookback period for the faster Moving Average A (unit: bars).
- MA_A_Method (Default: MODE_EMA) - Smoothing method for the faster Moving Average A (unit: ENUM_MA_METHOD enumeration).
- MA_A_Applied (Default: PRICE_CLOSE) - Applied price source for the faster Moving Average A (unit: ENUM_APPLIED_PRICE enumeration).
- MA_A_Shift (Default: 0) - Horizontal bar shift offset for the faster Moving Average A (unit: bars).
- MA_B_Period (Default: 140) - Lookback period for the slower Moving Average B (unit: bars).
- MA_B_Method (Default: MODE_EMA) - Smoothing method for the slower Moving Average B (unit: ENUM_MA_METHOD enumeration).
- MA_B_Applied (Default: PRICE_CLOSE) - Applied price source for the slower Moving Average B (unit: ENUM_APPLIED_PRICE enumeration).
- MA_B_Shift (Default: 0) - Horizontal bar shift offset for the slower Moving Average B (unit: bars).

Filter Module 7: Awesome Oscillator Filter (Section Header: InpFilter7)
- Use_AO_Filter (Default: false) - Enables or disables the Bill Williams Awesome Oscillator momentum filter group (unit: boolean true/false).
- Use_AO_Volume_Filter (Default: false) - Enables or disables minimum histogram amplitude threshold checks within the AO filter (unit: boolean true/false).
- AO_Buy_Min (Default: 4.0) - Minimum positive AO histogram threshold required for bullish validation when amplitude filtering is active (unit: oscillator points).
- AO_Sell_Max (Default: -4.0) - Maximum negative AO histogram threshold required for bearish validation when amplitude filtering is active (unit: oscillator points).
- Use_AO_Color_Filter (Default: false) - Enables or disables bar-to-bar AO histogram directional slope confirmation (unit: boolean true/false).
- Use_AO_Zero_Filter (Default: false) - Enables or disables zero-line polarity and directional slope confirmation on the AO histogram (unit: boolean true/false).

Filter Module 8: Parabolic SAR Filter (Section Header: InpFilter8)
- Use_SAR_Filter (Default: false) - Enables or disables a secondary Parabolic SAR trend-confirmation filter with independent sensitivity parameters (unit: boolean true/false).
- SAR_Step (Default: 0.02) - Acceleration factor step increment for the secondary Parabolic SAR filter (unit: decimal factor).
- SAR_Maximum (Default: 0.2) - Maximum acceleration factor ceiling for the secondary Parabolic SAR filter (unit: decimal factor).

Filter Module 9: Heiken Ashi Filter (Section Header: InpFilter9)
- Use_HeikenAshi_Filter (Default: false) - Enables or disables smoothed Heiken Ashi candle body polarity confirmation (unit: boolean true/false).

Filter Module 10: CCI Trend Filter (Section Header: InpFilter10)
- Use_CCI_Filter (Default: false) - Enables or disables Commodity Channel Index zero-axis directional trend filtering (unit: boolean true/false).
- CCI_Period (Default: 50) - Lookback period for the trend-bias CCI calculation (unit: bars).
- CCI_Applied (Default: PRICE_CLOSE) - Applied candlestick price source for the trend-bias CCI calculation (unit: ENUM_APPLIED_PRICE enumeration).

Filter Module 11: CCI OB and OS Filter (Section Header: InpFilter11)
- Use_CCI_OBOS_Filter (Default: false) - Enables or disables Commodity Channel Index extreme momentum threshold filtering (unit: boolean true/false).
- CCI_OBOS_Period (Default: 14) - Lookback period for the overbought/oversold CCI calculation (unit: bars).
- CCI_OBOS_Applied (Default: PRICE_CLOSE) - Applied candlestick price source for the overbought/oversold CCI calculation (unit: ENUM_APPLIED_PRICE enumeration).
- CCI_Overbought (Default: 100.0) - Upper CCI threshold level required for bullish momentum confirmation (unit: CCI index points).
- CCI_Oversold (Default: -100.0) - Lower CCI threshold level required for bearish momentum confirmation (unit: CCI index points).

Filter Module 12: RVI Filters (Section Header: InpFilter12)
- Use_RVI_Filter (Default: false) - Enables or disables Relative Vigor Index main-line zero-level directional filtering (unit: boolean true/false).
- RVI_Period (Default: 75) - Lookback period for the RVI zero-level trend filter (unit: bars).
- Use_RVI_Signal_Filter (Default: false) - Enables or disables RVI main-line versus signal-line directional alignment filtering (unit: boolean true/false).
- RVI_Signal_Period (Default: 20) - Lookback period for the RVI main and signal line comparison (unit: bars).

Filter Module 13: MACD Filters (Section Header: InpFilter13)
- Use_MACD_Filter (Default: false) - Enables or disables Moving Average Convergence Divergence histogram polarity filtering (unit: boolean true/false).
- MACD_FastEMA (Default: 12) - Fast exponential moving average period for MACD calculation (unit: bars).
- MACD_SlowEMA (Default: 26) - Slow exponential moving average period for MACD calculation (unit: bars).
- MACD_SignalSMA (Default: 9) - Signal line simple moving average period for MACD calculation (unit: bars).
- MACD_Applied (Default: PRICE_CLOSE) - Applied candlestick price source for MACD calculation (unit: ENUM_APPLIED_PRICE enumeration).
- Use_MACD_Zero_Filter (Default: false) - Enables or disables MACD main-line zero-axis directional trend filtering (unit: boolean true/false).

Filter Module 14: SR and Fibonacci Filters (Section Header: InpFilter14)
- Use_SR_Filter (Default: false) - Enables or disables dynamic lookback Support and Resistance proximity zone validation (unit: boolean true/false).
- SR_Period (Default: 50) - Historical bar lookback window scanned to determine local Support and Resistance extremes (unit: bars).
- SR_Zone_Points (Default: 80) - Proximity tolerance band around detected Support or Resistance levels within which signal candles are validated (unit: broker points).
- Use_Fib_Filter (Default: false) - Enables or disables automatic swing-based Fibonacci retracement zone validation (unit: boolean true/false).
- Fib_Level_1 (Default: 0.382) - First Fibonacci retracement ratio boundary defining the active pullback zone (unit: decimal ratio).
- Fib_Level_2 (Default: 0.618) - Second Fibonacci retracement ratio boundary defining the active pullback zone (unit: decimal ratio).
- ZigZag_Depth (Default: 12) - Minimum bar depth parameter used to identify structural swing highs and lows for Fibonacci anchoring (unit: bars).
- ZigZag_Deviation (Default: 5) - Minimum price deviation threshold required to confirm a new swing pivot (unit: broker points).
- ZigZag_Backstep (Default: 3) - Minimum bar separation required between consecutive swing pivots (unit: bars).

Filter Module 15: Supertrend Filter (Section Header: InpFilter15)
- Use_Supertrend_Filter (Default: false) - Enables or disables ATR-based Supertrend directional regime filtering (unit: boolean true/false).
- ST_AtrPeriod (Default: 10) - Smoothed ATR lookback period used to compute Supertrend volatility bands (unit: bars).
- ST_Factor (Default: 3.0) - ATR band multiplier governing Supertrend trailing sensitivity (unit: ATR multiplier).

Risk Disclaimer
Trading foreign exchange, commodities, indices, and other leveraged financial instruments carries a high level of risk and may not be suitable for all investors. Past performance and historical signal behavior do not guarantee future results. This indicator is an analytical software utility designed solely to assist traders with technical chart analysis and does not constitute financial or investment advice, nor does it guarantee financial profit. Always test the indicator thoroughly on a demo account to understand its operational behavior and parameter interactions before applying it in a live trading environment.
推荐产品
ALBA V2K: The Genius Striker [VIP Edition] Precision Algorithmic Warfare – Designed for XAUUSD Welcome to the apex of targeted algorithmic trading. ALBA V2K (The Striker) is a highly specialized, institutional-grade Expert Advisor developed by AF-Vision Systems. Built upon our legendary Tick-Throttle engine, this VIP edition is not designed for continuous trading; it is engineered to strike with lethal precision when market mechanics align perfectly. If you demand an algorithm that calculates, w
Neon Crossover Signal
Leandro Bernardez Camero
Neon Crossover – 动量反转智能指标 加入频道,获取最新更新: https://www.mql5.com/en/channels/forexnewadvisor Neon Crossover 是一个多功能指标,专为精准识别市场动量反转和极端情况而设计。它通过价格压力计算逻辑、动态平滑与布林带组合分析市场行为。适用于 EURUSD、GBPUSD、USDJPY 和 GBPJPY 等交易对,在 M1 - M5 - M15 - M30 和 H1 时间周期下表现出色,同时也适用于任何资产和时间周期。 核心逻辑包括: 基于价格极值的自定义压力值计算 使用SMA、EMA等平滑方法对信号线降噪 使用布林带分析市场波动与突破 多级阈值判断:超买、超卖、极端超买/超卖 当指标值突破阈值时,系统将绘制箭头并(可选)发出警报。 工作原理 信号生成基于以下逻辑: 压力不平衡: 计算一定控制周期内价格的上涨/下跌累积不平衡,以识别多头或空头趋势。 平滑滤波: 通过用户选择的移动平均方法(SMA/EMA等)对原始值进行平滑处理。 波动压缩: 通过布林带判断市场是否正在收敛或即将突破。 阈值交叉:
Most indicators never ask the most important question: is there actually a cycle running right now? Prisma asks it on every bar. When the answer is no, it stays silent. When the answer is yes, it tells you exactly where inside that cycle price currently sits — and signals the crossover at the right moment. The result is an oscillator that filters out the noise that destroys most fixed-period indicators, and fires only when three independent scientific systems agree. Three Scientific Layers 1. Eh
FST Super MACD
Benoit Dumont
Introducing our cutting-edge product, an innovative MACD Oscillator with a dynamic level enhanced by a decimal point Moving Average (MA) also with the versatility of multiple moving average modes. This advanced trading tool brings precision and flexibility to your technical analysis, offering a seamless experience for traders seeking a competitive edge in the financial markets. Key Features: Dynamic Level Precision Our MACD Oscillator is equipped with a dynamic level feature, providing traders
Magic Flash is going to be a strong investent weapon for you.  Follow your established personal settings.  This EA can be turned into a fast and efficient but relatively high-risk EA,  it can also become a medium or low risk but slower profit.  High growth in a short period of time when in the right market conditions.  But if the market conditions are not right, the "Martingale Stop Loss" function to decisively leave the scene.  This EA is very varied and malleable.  This EA is built on the Sc
PureDailyEA
Ahmet Metin Yilmaz
Expert's signal link has been working on 25 different instruments since 09.07.2019. It will be stopped after a while. https://www.mql5.com/en/signals/605823 This expert advisor works well on daily charts. Opens a pending order based on daily price movements and may revise this pending order based on price movements during the day.  It can keep the current order by following the price movements and can open two different types of additional orders as soon as it sees the opportunity. If he sees t
GoldStar MT4
Marek Kvarda
GoldStar EA is a fully automated trading program (Expert Advisor) designed exclusively for trading gold (XAU/USD). It analyzes multiple timeframes to detect high-probability trading opportunities and integrates advanced trade management tools — all while remaining easy to set up and operate . Key Advantages of GoldStar EA Advanced algorithm scanning multiple timeframes for optimal entry signals. Built-in money management and capital protection to minimize risk. Stable and consistent results ba
Cool Monkey
Sze Yu Ma
4 (1)
Cool Monkey is a fully automatic, highly customizable EA based on Volatility, MACD and RSI to select optimal entry points. It uses a specialized grid structure  to achieve a high winning rate with improved safety. All tests are performed with 99.90% tick data, with simulated spread, execution delay, commission and swap. Trading and optimization experience required if you wish to optimize it. Limited time to buy Cool Monkey for USD30 ! Recommendations: Default settings works on EURUSD M1 chart Cu
New Ea with indicator TWO MA PLUS. Open order BUY : If MA1 > MA2. Open order SELL : If MA1 < MA2. The advantages of EA TWO MA PLUS are: It is equipped with various filters, including: maxspread, maxlot, takeprofit, stop loss, profit target per day, and many more. Setting_Indicator TWO MA = Ma1_Period=14; Ma2_period=28; Ma_Mode=0; EA_indicators=TWO MA ; Hedging=false; ==> true/false Use_MaxSpread=true; MaxSpread=50; ==> Maximal Spread MaxLot=1; ==> Maximal lot Target_profit_perday=50; ==> can wo
Secret Scalper
Burcak Sengezer
Secret Scalper EA is a fully automated Expert Advisor. The EA is a medium-term scalper. Our EA has been created to work confidentially. So, it can close orders with actual account currency value at profit or loss. Also works with stop loss. The EA's strategy has been improved to make reasonable and low-medium risk profit. But, you can also increase your risk, although we do not recommend doing that. The EA's logic is little bit complicated. However, easy to use. Most of settings are set by the E
EZT Bollinger Trendline Indicator based on multiple settings of Bollinger Band. In the menu you can choose the similar settings than bollinger band indicator. Trend period and trend deviations. Also paint and arrow on chart when direction change. Three different kind of alert , such as pop up, e-mail and push notification. Try different settings on different timeframes. Please help my work and rate and comment my products!
Auto Optimized Bollinger Bands – 适用于真实市场的自适应波动性工具 Auto Optimized Bollinger Bands 是一款先进的 MT4 指标,通过历史交易模拟,自动选择最优的布林带周期和偏差设置,从而改进了传统的布林带方法。 该指标不是使用固定参数,而是实时优化,根据实际市场行为寻找最有效的设置,使布林带能够根据波动性和价格结构的变化动态调整,无需手动调节。 主要功能: 基于历史表现自动寻找最优布林带参数 在关键价格反转点显示自适应买入/卖出箭头信号 内置提示功能:声音、弹窗、推送通知 优化深度、显示方式和信号参数均可自定义 适用于外汇、黄金、指数、加密货币等市场 本工具非常适合日内交易者和波段交易者,提供比传统固定设置更智能的波动性交易方式。
MBFX Timing
Mohamed Hassan
5 (3)
After purchase, contact me in private to get 7 days of FREE testing with EA Forex Proton where the robot automatically takes the trade alerts from MBFX Timing! MBFX Timing is an indicator that was developed and created by Mostafa Belkhayate, one of the best traders in the world. We decided to create a modified version that takes inspiration from the Stochastic Oscillator and the Relative Strength Quality Index indicators to improve your trading.  One of the main reasons we released MBFX Timing
A trend indicator based on the Ichimoku Kinko Hyo and MACD. The ICloud Scalper Trend Indy is an improved variant of the Ichimoku Kinko Hyo and MACD, which shows the moment of trend following quite accurately. It is often used as a signal filter. Combination of two indicators makes a better use of these advantages: Ichimoku Kinko Hyo identifies the trend, while MACD determines the short-term movements and signals in the trend direction. Messages/Sounds (Notifications and sound settings) ON/OFF -
Fong Sai Yuk
Robert Winata
Overview Fong Sai Yuk is an advanced and robust automated trading system designed for MetaTrader 4 (MT4). Built around a multi-layered filtering approach, this Expert Advisor combines trend strength evaluation, institutional price zones, and adaptive candlestick pattern recognition to execute high-probability trades with precision. Key Features ATR Rope Filter: Dynamically filters market noise using Average True Range (ATR) parameters to ensure trades are aligned with the prevailing trend direct
Three MA Alert
Thushara Dissanayake
三重移动平均线交叉预警指标 是一款 移动平均线交叉指标, 旨在通过结合 快速移动平均线 、 常规移动平均线 和 慢速移动平均线 来分析市场方向。该指标 通过清晰的三重移动平均线结构, 帮助交易者识别 市场趋势 的变化 、潜在的 看涨和看跌行情 以及重要的价格波动区域。该 外汇指标 结合了 技术分析 、 趋势分析 和可自定义的 交易预警 功能 , 为使用 趋势跟踪 、 日内交易 、 超短线交易 和 波段交易 策略 的交易者提供了一种基于图表的简单方法 。三重移动平均线交叉预警指标适用于分析 外汇货币对 、 黄金(XAUUSD)   、 指数 、 加密货币 以及其他使用移动平均线来研究价格行为和市场动能的差价合约工具的交易者。 核心功能 该指标使用三条可自定义的 移动平均线 来构建市场走势的结构化视图。快速移动平均线对近期价格变化反应更迅速,普通移动平均线代表中期走势,而慢速移动平均线则有助于识别更广泛的市场趋势。 当三条移动平均线重合时,该指标会突出显示当前的市场结构,并在图表上直接显示视觉信号。此 移动平均线交叉指标 可帮助交易者观察短期动能相对于长期趋势的变化。 该指标使用用户自定
VJ Pivot Levels
Vijayaratna Kumar Boda
4.25 (4)
Introduction: Whatever trading method you use, it is important to know the Pivot levels to take the key attention for your entries & exits. This indicator has been made using the standard classic formula for Auto drawing the Pivot levels. Also based on the previous day trading range, the probable expected today trading range has been highlighted in a different color for your reference. Output of the Indicator: This Indicator gives the Pivot level Different resistance Levels Different Support le
Wolf Signal EA
AL MOOSAWI ABDULLAH JAFFER BAQER
Wolf Signal EA – A Powerful Semi-Automated Trading Solution Important: This Expert Advisor is not optimized and is designed for traders who want to fine-tune it to match their own strategies. You have full control over the parameters to adapt it to different market conditions. Overview Wolf Signal EA is a sophisticated tool designed for traders looking to automate their entries using the Parabolic SAR indicator. The EA follows a logic-based approach, ensuring a disciplined entry strategy while
ForexEagle
Hadj Ahmed Slimani
ForexEagle - Elevate Your Trading Experience to New Heights Ready to revolutionize your trading game? Introducing ForexEagle, the ultimate Expert Advisor meticulously crafted to dominate the GBPUSD, AUDCAD, USDCAD markets on the M5 timeframe. With a winning combination of advanced Price Action strategy and trend detection algorithm, ForexEagle is your go-to tool for unlocking the full potential of GBPUSD, AUDCAD, USDCAD trading. The EA operates during specific hours, from 12:01 AM to 11:59 PM. G
PZ Divergence Trading
PZ TRADING SLU
5 (2)
棘手的发现和频率稀缺是最可靠的交易方案之一。该指标使用您喜欢的振荡器自动查找并扫描常规和隐藏的发散。 [ 安装指南 | 更新指南 | 故障排除 | 常见问题 | 所有产品 ] 容易交易 发现常规和隐藏的分歧 支持许多知名的振荡器 根据突破实现交易信号 显示适当的止损和获利水平 可配置的振荡器参数 可自定义的颜色和尺寸 按条形过滤大小差异 实现绩效统计 它实现了电子邮件/声音/视觉警报 为了提供广阔的市场前景,可以使用不同的振荡器在同一张图表中多次加载该指标,而不会产生干扰。该指标支持以下振荡器: RSI CCI MACD OSMA 随机 动量 很棒的振荡器 加速器振荡器 威廉姆斯百分比范围 相对活力指数 由于差异可能会扩大很多,尤其是在外汇市场中,因此该指标产生了转折:它在等待交易突破之前等待donchian突破确认差异。最终结果是带有非常可靠的交易信号的重新粉刷指示器。 输入参数 幅度:用于寻找差异的之字形周期 振荡器-选择要加载到图表的振荡器。 突破期-交易信号的突破期,以柱为单位。 发散类型-启用或禁用发散类型:隐藏,常规或两者。 最小散度单位为条形-最小散度单位为条形
Most traders don’t lose because their strategy is bad. They lose because they trade at the wrong time. The same strategy that works in a strong trend will fail in a choppy or unstable market. AEGIS Market Regime Detector shows you exactly what type of market you are in — in real time — so you can avoid bad conditions and trade only when your edge is present. --- ## Why Market Regimes Matter Every trading strategy performs differently depending on market conditions. • Trend-based s

Reversal Edge System是一款专为MetaTrader 4打造的专业顶底工具指标。它识别潜在趋势信号区域,输出清晰的交易信号,并通过多周期趋势分析做信号滤波,简化想象交易形态。 指标实时展现市场情绪:强烈看多强烈看空偏多偏空多空闭合 每个信号都涉及预设止盈(TP)与止损(SL)价位,做好风险管理。指标内置信号回测功能,统计核心数据:胜率、信号总数,交易者可以直接在图表上可视化评估历史表现。 核心功能: 顶底信号 多周期(MTF)趋势确认过滤器 实时市场情绪标签 每个信号自带止盈与止损 信号回测模拟 胜率与信号总数统计 支持外汇、加密货币、指数与商品 无重绘提示 借助可验证的食谱格局与内置风控,更智能地交易,获得您的交易优势。
WSN Edge RSI MA Forex EA
Michael Ferreira Da Silva
MT4 EA WSN Edge RSI-MA Multi v1.1 Automate your Forex trading with a complete Expert Advisor for MetaTrader 4 (Windows) . This EA executes an automated strategy using RSI + Moving Averages (MA) —ideal for traders who want disciplined, rules-based entries/exits. ️ Key Features RSI + MA signals for more assertive entries Risk/Reward 1:2 by default Automatic Trailing Stop to lock profits Light martingale (max. 2 steps) for controlled recovery Daily profit target : closes all orders once the t
Garuda Fire MT4
Maldini Yoga Pratama
EA Garuda Fire MT4 .This is the logical development of EA Dragon Fire ultimate, with the addition of better logic and confirmation than before.   EA Garuda Fire MT4   is a trend following system for swing trading based on PLT indicator filtered by I-gentor LSMA. no need to add any indicators because everything is included in this EA code, so the trading decisions are simple and immediate without confusion that can result from the use of many indicators Only   10 download  of the EA left  at $69
Golge Guardian
Ismail Demirci
ENGLISH VERSION GOLGE GUARDIAN – Professional Gold Scalping EA Trade Gold with Precision GOLGE GUARDIAN is a professional Expert Advisor developed specifically for MetaTrader 4. It is designed to trade XAUUSD (Gold) on the 5-minute timeframe using an advanced algorithmic price engine and proprietary mathematical models . Unlike simple indicator-based robots, GOLGE GUARDIAN evaluates multiple market conditions before opening a trade. Every position is opened only after several technical filters a
RSI strategy EA MT4
Biswarup Banerjee
介绍 Relative Strength Index(RSI) Strategy EA MT4,这是一款专为 MetaTrader 4 设计的自动化交易解决方案。该专家顾问利用相对强弱指数 (RSI) 的力量,根据超买和超卖条件执行交易,非常适合希望通过自动化提升交易策略的交易者。 使用 Relative Strength Index(RSI) Strategy EA MT4,用户可以享受高级交易功能,如可自定义参数、多时间框架支持和强大的风险管理工具。这个 EA 使交易者能够有效利用市场波动,同时最小化人工干预,非常适合希望优化交易表现的新手和经验丰富的交易者。 MQL产品安装指南 | 在 MT4/MT5 上更新已购买的MQL产品 | 常见故障排除指南 | 常规设置/输入指南 | 指标设置 | 回测和设置文件 主要特点 核心交易策略:使用 RSI 根据市场动量识别潜在的买入和卖出机会。 多时间框架支持:在不同时间框架内交易,以在不同市场条件下提供更大的灵活性和适应性。 风险管理:结合止损、止盈和移动止损选项来保护您的资本。 入场过滤器:包括 spread 过滤器、会话时间和新闻过滤器
PipFinite EA Breakout EDGE
Karlo Wilson Vendiola
5 (5)
The Official Automated Version of the Reliable Indicator PipFinite Breakout EDGE EA Breakout EDGE takes the signal of PipFinite Breakout EDGE indicator and manages the trade for you. Because of numerous financial instruments to consider, many traders want the signals to be fully automated. The EA will make sure all your trades are executed from entry to exit. Saving you time and effort while maximizing your profits. The Edge of Automation Effortless price action trading is now possible acros


TT Macd Dashboard
Tomislav Turcin
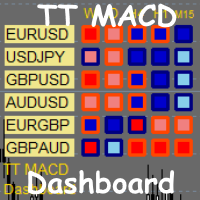
TT MACD Dashboard is multi-time frame and multi-currency market scanner. It is telling you the value of MACD and MACD histogram (a difference between MACD line and Signal line) in a form of small rectangle. If MACD value is above zero (MACD is bullish). Rectangle border color is bullish (Navy by default).  If MACD value is below zero (MACD is bearish). Rectangle border color is bearish (OrangeRed by default). If MACD histogram is rising and above zero (Bullish histogram). Rectangle color is bull
Crusher
Evgeniy Zhdan
The Expert Advisor uses the dissonance analysis strategy between the wave formation of the price movement of the lower level and the fractals of two consecutive upper levels. The data of the Stochastic indicator are confirmatory and decisive when making a decision to enter a transaction. Each trading position has a stop loss and take profit. Dangerous trading methods are not used. The Expert Advisor has a non-linear trailing stop system. Recommended trading tools for defaults: 15M: EURGBP, E
PZ ABCD Retracement
PZ TRADING SLU
4 (5)
该指标找到AB = CD回撤形态。 AB = CD回调模式是一种4点价格结构,其中初始价格区间被部分回调,然后与回调完成后等距移动,这是所有谐波模式的基本基础。 [ 安装指南 | 更新指南 | 故障排除 | 常见问题 | 所有产品 ] 可定制的图案尺寸 可定制的AC和BD比率 可定制的突破时间 可定制的线条,颜色和大小 它根据CD纤维水平显示SL和TP水平 视觉/声音/推送/邮件警报,用于模式和突破 AB = CD Retracements可以扩展和重新绘制很多内容。为了使事情变得更容易,该指标实施了一个转折:它在向交易发出信号之前等待正确方向的Donchian突破。最终结果是带有非常可靠的交易信号的重新粉刷指示器。输入donchian突破时段作为输入。 看涨回撤是蓝色的 空头回撤是红色的 请注意,价格模式(例如AB = CD)可以扩展,指标必须重新绘制以跟随该模式的扩展。如果图案重涂超出了参数中输入的AC / BD / AB = CD比率,则该图案将消失,因为它将不再有效。要交易这些模式,请求助于donchian突破信号。 输入参数 幅度:AB = CD模式的大小 突围
该产品的买家也购买
Currency Strength Wizard
Oleg Rodin
4.85 (61)
货币强度向导是一个非常强大的指标,为您提供成功交易的一体化解决方案。该指标使用多个时间范围内所有货币的数据来计算这个或那个外汇对的力量。此数据以易于使用的货币指数和货币电力线的形式表示,您可以使用它们来查看这种或那种货币的力量。 您所需要的只是将指标附加到您要交易的图表上,该指标将向您显示您交易的货币的真实强度。该指标还向您显示买卖量压力的极值,您可以在顺势交易时利用这些压力。该指标还显示了基于斐波那契的可能目标。该指标可用于各种交易时间范围。该指标支持各种货币对的交易。 该指标为您提供所有类型的警报,包括推送通知。 购买后请联系我。我将与您分享我的交易技巧,并免费为您提供丰厚的红利指标! 祝您交易愉快,获利丰厚!
Trend SniperX MT4
Sarvarbek Abduvoxobov
5 (6)
Trend Sniper X 是一款用于 MetaTrader 5 的多周期趋势追踪指标,旨在帮助交易者清晰、精准地识别趋势方向及潜在的反转点。 适用于 MT5: https://www.mql5.com/en/market/product/181101 价格信息: 当前价格为促销价,随着后续更新和新功能的推出,价格可能会发生变动。 Code2Profit 频道 通过多周期分析掌控市场! 如何使用 Trend Sniper X 最大化胜率:关键规则与交易时段技巧 技术规格 交易平台 MetaTrader 5 指标类型 多周期趋势指标 运行时间周期 任意图表周期,支持独立选择更高周期(M1–MN1) 主要交易品种 外汇、黄金 (XAUUSD) 及其他 CFD 差价合约 推荐账户 任何账户类型 可视化呈现 彩色趋势 K 线(买入/卖出/弱势/转变)+ 买入/卖出信号箭头 附加模块 市场交易时段框(悉尼、东京、伦敦、纽约) 核心功能 多周期趋势分析: 将更高周期的趋势方向直接投影到当前图表上,提供清晰的宏观视角。 弱势/不确定 K 线检测: 高亮显示趋势状况不明确的 K 线,帮助交易者远离震
M1 Sniper
Oleg Rodin
4.97 (30)
M1 SNIPER 是一款易于使用的交易指标系统。它是一个专为 M1 时间框架设计的箭头指标。该指标可以作为独立的系统在 M1 时间框架下进行剥头皮交易,也可以作为您现有交易系统的一部分使用。虽然该交易系统专为 M1 时间框架交易而设计,但它也可以用于其他时间框架。我最初设计此方法是为了交易 XAUUSD 和 BTCUSD。但我发现这种方法在其他市场交易中也同样有用。 指标信号既可以顺势交易,也可以逆势交易。我教授一种特殊的交易技巧,帮助您利用指标信号进行双向交易。该方法基于使用特殊的动态支撑位和阻力位区域。 购买后,您可以立即下载 M1 SNIPER 箭头指标。此外,我还为所有 M1 SNIPER 工具用户免费提供下方屏幕截图所示的 Apollo Dynamic SR 指标!这两个指标的组合可以帮助您更轻松、更准确地利用 M1 时间框架进行交易。 购买后请联系我,免费获取交易提示和奖励指标! 祝您交易成功!
Smart Trend Trading System
Issam Kassas
4.82 (11)
Smart Trend Trading System 是适用于 MetaTrader 4 的图表指标,将趋势信息、入场和出场信号以及价格水平集中呈现在同一图表上。 它将 10 多种交易工具 整合到一个系统中,包括趋势检测、反转区域、Smart Cloud、移动止损逻辑、支撑与阻力、K线着色、提醒以及多周期分析。 该系统旨在帮助您应对不同的市场环境: 趋势市场: 识别主要趋势,发现回调,跟随动能,并通过止损指导和移动止损选项寻找更清晰的入场机会。 震荡市场: 识别区间震荡状态,寻找价格反应区域,并在价格触及重要水平时获得更清晰的信号。 剥头皮和日内交易: 使用快速信号、K线颜色、提醒和多周期确认,辅助短线交易决策。 主要功能: • 10 多个指标整合为一个交易系统 • 7 多种策略和信号组合 • 趋势跟随、反转、剥头皮、日内交易和波段交易模式 • 入场和出场箭头 • Smart Cloud • Smart Reversal Zones • 支撑和阻力水平 • Smart Trailing Stop • 多周期趋势分析 • 成交量、趋势和反转K线着色 • 手机、电子邮件和终端提醒 •
SIO Oscillator:自优化半方差失衡振荡器 购买指标,即可免费获得基于该指标的智能交易系统(EA)。 大多数振荡器对所有价格波动一视同仁。SIO 将上行压力与下行压力分开,并衡量两者之间的失衡程度,清楚显示究竟是买方还是卖方在真正掌控市场。当失衡达到极值时,SIO 会给出明确的信号,并附带入场价、止损(Stop Loss)和止盈(Take Profit)水平。 SIO 的独特之处在于它不依赖固定参数。内置的自优化器会持续寻找适合当前品种和周期的参数,并在使用之前对其进行验证。 两种信号模式 均值回归(Mean Reversion):在失衡极值处交易,预期价格回归平衡。 趋势跟随(Trend Following):顺着持续、占主导地位的失衡方向交易。 自动模式:由优化器根据近期数据选择表现更好的模式。 具备真实验证的自优化器 滚动前推优化(Walk-forward):参数只用历史数据选出,然后应用于之后的K线。 真正的样本外保留期(Hold-out):结果会在优化器从未训练过的数据上得到确认。 平台图(Plateau map):所有测试参数的可视化热力图。SIO 优先选择结果稳
Liquidity Scalper System
Stanislav Konin
5 (4)
Liquidity Scalper System: 基于流动性的指标形式交易系统。 大多数指标只显示一个箭头,止损放在哪里、目标在哪里、信号是否可信,都要交易者自己判断。Liquidity Scalper System 覆盖完整的交易周期:寻找流动性池,在其被突破时给出信号,立即计算 Entry、Stop Loss 和三个目标,并在面板上显示统计数据以及新数据上的验证结果。系统自行选择设置,并每天更新。 工作原理 1. 系统寻找流动性池:市场参与者止损单聚集的价位。 2. 当价格突破流动性池,且突破经由动能(必要时还经由成交量)确认后,图表上出现 BUY 或 SELL 箭头。 3. 立即绘制 Entry、Stop Loss、TP1、TP2 和 TP3 水平,并填充区域。 4. 右侧构建流动性分布图:可以看到价格上方和下方大成交量集中的位置。 与众不同之处 • 自动优化取代手动调参。 系统在历史数据上测试 32 种设置组合,为当前品种和周期选出最佳组合。优化目标可选:Win Rate、净利润或盈利因子。 • 新数据验证。 设置在一部分历史上训练,并在优化器未见过的更新数据上检验(out
Gann Made Easy
Oleg Rodin
4.84 (174)
Gann Made Easy 是一个专业且易于使用的外汇交易系统,它基于使用先生理论的最佳交易原则。 W.D.江恩。该指标提供准确的买入和卖出信号,包括止损和获利水平。您甚至可以使用推送通知在旅途中进行交易。 购买后请联系我,即可免费获得交易指导和超棒的额外指标! 您可能已经多次听说过江恩交易方法。通常 Gann 的理论不仅对于新手交易者而且对于那些已经有一定交易经验的人来说都是非常复杂的东西。这是因为江恩的交易方法在理论上并不那么容易应用。我花了几年时间来完善这些知识,并将最好的原则应用到我的外汇指标中。 该指标非常易于应用。您所需要的只是将其附加到您的图表并遵循简单的交易建议。该指标不断进行市场分析工作并寻找交易机会。当它检测到一个好的入口点时,它会为您提供一个箭头信号。该指标还显示止损和获利水平。 换句话说,当您像先生一样进行交易时,该指标会为您提供最佳江恩建议。江恩亲自告诉你此时此刻该做什么。但最好的部分是您不需要了解任何有关江恩交易原则的知识,因为该指标会为您完成整个市场分析工作。
Advanced Supply Demand
Bernhard Schweigert
4.91 (302)
现在优惠 30%! 任何新手或专业交易者的最佳解决方案! 该指标是一款独特、高质量、且价格合理的交易工具,因为我们已经整合了许多专有功能和新公式。 依据此更新,您将能够显示双重时间帧区域。 您不仅可以显示一个较高的时间帧,还可以同时显示图表时间帧,加上更高的时间帧:显示嵌套时区。 供需双方所有交易者都会喜欢它。 :) 重要信息披露 高级供需的最大潜力,请访问 https://www.mql5.com/zh/blogs/post/720245   想象您的交易如何得以改善,是因为您能够精准定位入场或目标位吗? 构建于新的底层算法,它可以更轻松地识别出买卖双方之间的潜在失衡。 这是因为它以图形方式展示供需最强劲区域,及其过去的表现(显示旧区域)。 这些功能旨在帮助您更轻松地发现最佳入场区域和价位。 现在您可以针对您的交易品种和时间帧来优化和编辑区域强度! 高级供需指标适用于所有产品和时间帧。 它是一个新的公式,非常新的功能是两个区域强度函数可由用户输入进行调整! 这在交易中是一大优势。 当您学习如何使用专有功能,例如带有价格游离最小 X 因子的区域强度时,您能够判断该区域强劲与否。 供需
本指标是实践实战交易完善的波浪自动分析的指标 !  案例... 注: 波浪分级用西方叫法不习惯,因受到缠论(缠中说禅)命名方式习惯的影响,我是将基础波浪命名为 笔 ,将二级波段命名为 段 ,同时具有趋势方向的段命名为 主趋段 (以后笔记中都是这种命名方式,先告知大家),但是算法上和缠论关系不大切勿混淆.反映的是本人分析盘面总结的 千变万化纷繁复杂的运行规律 . 对波段进行了标准化定义,不再是不同人不同的浪  ,    对人为干扰的画法进行了排除,在严格分析进场起到了关键的作用 . 使用这个指标,等于将交易界面提升美感,抛弃最原始的K线交易带你进入新的交易层次.如果不是为了交易,在宣传上也将使客户观感提升层次. 指标内容: 1. 基础波浪 (笔) : 首先我们找出了价格波动过程中的基础波动拐点,当然他的有序性低,为下一步的计算提供基础. 2. 二级波段( 段 ) :在基础波浪的基础上,通过算法分析得到层级更明显的二级波段,二级波段为波浪提供了分析基础 3. 波浪( 浪 ): 有着更清晰的趋势,更清晰直观的方向.分析一个波浪是否延续,需要看二级波段的形态,分析二级的构成,可以得出波浪
目前八折优惠! 对任何新手或专家交易者来说都是最好的解决方案! 这个仪表板软件适用于28种货币对。它基于我们的两个主要指标(高级货币强度28和高级货币冲动)。它对整个外汇市场提供了一个伟大的概述。它显示高级货币强度值,货币运动速度和28个外汇对在所有(9)时间段的信号。想象一下,当你可以使用图表上的单一指标观察整个市场,以确定趋势和或剥头皮的机会时,你的交易将得到改善 我们已经在这个指标中建立了一些功能,使你更容易识别强势和弱势货币,同时识别和确认潜在的交易。该指标以图形方式显示货币的强势或弱势是增加还是减少,以及它在所有时间段的表现。 增加的新功能是动态市场斐波那契水平,它适应当前的市场条件变化,这是一个已经在我们的高级货币强度28和高级货币冲动指标中使用的成熟的加分项。 在交易时,总是将弱势货币和强势货币配对,这个新指标将帮助你做到这一点。 用户手册:点击这里  https://www.mql5.com/en/blogs/post/708783 特点  显示每个时间段的ACS28和GAP-speed(冲动)的货币强度值。 列:颜色代码以7种颜色显示货币强度:强势
Non repaint MT4
Yan Zhen Du
5 (2)
This is a professional chart indicator designed for traders focused on stability and clear price action. It helps filter market noise and provides clear visual entry and exit zones for your trading decisions. Price Information: The current price is promotional and is subject to change as upcoming updates and new features are released. MQL5 public channel:  CLICK HERE for MT5:  Non-repainting MT5 version Core Features: Strictly Non-Repainting: The system is built with strict non-repaint logic. W
Scalper Vault
Oleg Rodin
4.9 (41)
Scalper Vault 是一套功能强大且配置完善的交易系统,专为追求日内交易稳定性的交易者而设计。 作为一套完整且独立的交易系统,该高精度指标能够为外汇和二元期权交易者提供机构级的市场分析。 购买后请联系我,获取我的独家交易技巧以及一份超值赠品! Scalper Vault 能够消除凭感觉交易和复杂的各种手动分析,让您只需专注于执行交易,并运用简单易行的交易技巧进行操作。 精准的顺势交易信号:其核心算法通过分析市场结构,仅在市场主导趋势的方向上提供高胜率信号,从而大幅减少错误的入场操作。 精确的顶部与底部探测:系统能够识别市场动能耗尽的状态,从而锁定潜在的反转区域。 基于江恩(Gann)理论的买卖区域:系统会自动绘制江恩数学市场点位,让您能清晰洞察大型机构交易者在何处寻求买入或卖出。 100% 不会重绘(Non-Repainting):一旦K线收盘,生成的信号便会永久固定在图表上。绝无动态偏移,绝无虚假信号——您在历史数据中所见,即为该指标的真实表现。 广泛的市场适用性:适用于各类货币对、黄金、指数以及加密货币交易。
介绍 ON Trade Waves Patterns Harmonic Elliot Wolfe,这是一款高级指标,旨在使用手动和自动方法检测各种市场模式。以下是它的工作原理: 谐波模式: 该指标可以识别出现在您图表上的谐波模式。这些模式对于练习谐波交易理论的交易者非常重要,正如Scott Carney的书《谐波交易第1卷和第2卷》所描述的那样。无论您是手动绘制它们还是依赖自动检测,ON Trade Waves Patterns都可以胜任。 控制面板: 我们配备了一个用户友好的控制面板,它会保存您的图表和时间帧设置,使您可以轻松切换不同配置。您甚至可以最小化它以最大化图表空间。如果您更喜欢使用其他分析工具,只需单击关闭按钮即可隐藏所有指标数据。 模板保存: 当您自定义设置或添加其他指标,如移动平均线或布林带时,该指标会自动保存您的模板。这意味着您可以随时轻松加载您喜欢的设置。 优化显示: 对于Windows 10用户,我们建议调整您的DPI设置以获得高清设备上的最佳屏幕体验。右键单击MetaTrader图标,选择“兼容性”,然后选择“更改高DPI设置”,将其设置为“系统(增强)”。
RFI levels PRO
Roman Podpora
5 (2)
RFI LEVELS PRO 可识别反转结构以及关键的价格回归区域,这些区域可能出现大型市场参与者的活跃行为。 指标可以帮助您识别新趋势的形成、寻找潜在入场点,并提前控制风险和利润目标。 MT5 版本   —   与 TREND LINES PRO 配合使用时,可充分发挥指标的功能。 指标显示内容: 在新趋势开始阶段激活的反转结构和反转水平。 沿已识别趋势方向的潜在入场点。 可视化的 TAKE PROFIT 和 STOP LOSS 水平。 基础最低风险收益比为 RR 1:2 。 随着行情发展,Stop Loss 可根据智能逻辑进行动态调整。 趋势分析 RFI LEVELS PRO 可以根据以下两个指标的数据生成反转结构: TREND LINES PRO — 用于识别全局趋势反转。 TREND PRO — 用于识别更快速的趋势反转。 SCANNER 扫描器 内置扫描器实时运行,可帮助快速发现当前活跃的交易机会。 多时间周期品种过滤。 搜索当前激活的反转结构。 显示 LOGIC AI 信号触发后的结果。 显示当日信号已产生盈利的交易品种列表 — RB 按钮。 支持交易终端提醒。 支持向移动
Zoryk Gold mt4
Reda El Koutbane
5 (4)
折扣将在 24 小时后结束——下一价格为 69 美元 联系我获取推荐设置 首发名额有限 ZORYK — MetaTrader 4 专业 XAUUSD 黄金信号与交易计划系统 你一定经历过这种感觉。 你花时间分析黄金,等待入场,终于打开交易后,价格却立即向相反方向移动。你过早平仓,移动止损,或者因为犹豫几秒而错过机会。随后市场在没有你的情况下,准确到达你最初预期的目标。 问题并不总是方向错误。 真正的问题是不确定性。 你不知道真正的入场位置在哪里,不知道交易逻辑在什么位置失效,也不知道应该先保护较小的利润,还是继续等待更大的行情。你甚至不知道当前信号是否足够强,还是自己只是在勉强寻找一笔交易。 黄金移动速度非常快。没有明确计划的正确判断,也可能在几秒钟内变成错误决定。 ZORYK 正是为了解决这个问题而开发。 什么是 ZORYK ZORYK 是一套专门为 MetaTrader 4 和 XAUUSD M5 周期开发的完整黄金信号与交易计划系统。 它不是一个只显示 BUY 或 SELL 箭头,然后让你独自处理所有后续决定的普通指标。 每个确认信号都可以在图表上显示
ShapeRadar MT4
Evgeniy Zhdan
ShapeRadar - 经典图表形态指标 ShapeRadar 可自动识别图表上的经典技术分析形态:双顶、三重顶、双底、三重底,头肩顶/头肩底,上升楔形和下降楔形,矩形,三角形,旗形和三角旗形。当价格收盘突破形态边界时,指标会画出该形态、入场点、止损位和目标位,并在信息面板中汇总所有已识别的形态。 MetaTrader 4 版本: https://www.mql5.com/en/market/product/208462 指标适用于任何品种和周期。信号只在K线收盘后确认,因此已经画出的标记不会消失,也不会在当前K线上重绘。图表上清楚显示形态位置、突破位置以及入场、止损和目标,面板则把所有信息集中在一处。 欢迎订阅我的频道: https://www.mql5.com/en/channels/algotrader 注意 - 赠品!购买后请联系我,即可免费获得我的任意一款指标! 可识别的形态 双顶与双底 三重顶与三重底 头肩顶、头肩底 上升楔形与下降楔形 矩形 对称三角形、上升三角形、下降三角形 看涨旗形与看跌旗形 看涨三角旗与看跌三角旗 图表上显示的内容 形态线条:颈线,或楔形、三角形、
PRO Renko System
Oleg Rodin
5 (31)
PRO Renko Arrow Based System for trading renko charts.  准确的信号交易任何外汇工具. 另外,我将免费提供系统的附加模块! PRO Renko系统是RENKO图表上高度准确的交易系统。该系统是通用的。 该交易系统可应用于各种交易工具。 该系统有效地中和了所谓的市场噪音,打开了获得准确反转信号的通道。 该指标易于使用,只有一个参数负责产生信号。 您可以很容易地使算法适应您感兴趣的交易工具和renko酒吧的大小。 我很乐意通过提供任何咨询支持来帮助所有客户有效地使用该指标。 祝您交易成功!购买后,立即写信给我! 我将与您分享我的建议和我的renko发电机。 另外,我将免费提供系统的附加模块!
SR Liquidity
Oleg Rodin
5 (3)
SR Liquidity 是一款旨在揭示市场流动性高度集中且价格反应最剧烈的隐蔽区域的交易指标。这些特殊的流动性区域充当着强有力的支撑位与阻力位,为您清晰呈现市场最可能发生反转的位置。 SR Liquidity 指标并非简单地绘制常规的支撑/阻力线,而是通过分析实际的价格行为,识别买卖压力积聚的区域。这些区域实际上是推动市场真实波动的流动性池。通过在图表上直观呈现这些区域,该指标能助您在价格反应发生前预判走势——这意味着它实际上能够预测价格方向可能发生的变化。它将原始的价格行为转化为清晰且具实操价值的市场蓝图,标示出那些可能成为市场转折点的关键价位。 该指标适用于任何交易品种和时间周期——包括外汇、指数、金属、加密货币等。支持任意时间周期。 购买后请联系我,以获取交易指南及免费赠送的优质附加指标!
Auto Optimized SpeedAngle 是一款机构级的动量向量化系统,通过持续的前瞻优化(Walk-Forward Optimization, WFO)彻底消除了曲线拟合(curve-fitting)。该指标没有采用在市场 状态转换时容易失效的静态输入参数,而是利用出样外验证(Out-of-Sample, OOS) dynamically 动态重新校准设置,从而确保显示的 信号代表真正的统计优势,而非历史巧合。 核心机构级架构 前瞻优化引擎(Walk-Forward Optimization Engine): 核心算法持续扫描数千种回溯周期(lookback)与阈值组合,严格将数据划分为样本内(in-sample)和样本外(out-of-sample)。只有当参数配置在未知数据环境中证明具备数学优越性时,系统才会对其进行 adoption。 量化目标函数(Quantitative Objective Functions): 优化引擎不一味追求绝对毛利,而是聚焦于机构级的稳定性指标。用户可针对系统质量数(SQN)、期望值(每笔交易的平均 R 倍数)或净 R 值进行优化,从而优
Professional Volume Profile 一款用于 MetaTrader 4 的指标,可直接在价格图表上构建水平成交量分布(Volume Profile)。显示交易最集中的水平,帮助识别支撑/阻力区域并评估市场力量平衡。 指标显示内容 POC(Point of Control)— 成交量最大的水平(红色线)。 VAH / VAL(Value Area High / Low)— 价值区上下边界,70% 的成交量在此区间内成交(橙色虚线)。 成交量直方图 — 成交量在价格水平上的分布(蓝色柱)。价值区以黄色高亮显示。 核心功能 柱上数值:可在分布图上显示成交量数字(或百分比)。支持智能文本对比度和数字缩写(1.5K, 2M)。 灵活绘制样式:可在实心柱和分离线之间选择。可调整粗细和间隙。 可拖动面板:深色设计的统计面板。可用鼠标拖动,并按图表记忆位置。 多语言支持:支持 12 种语言,自动检测终端语言。 交易时段过滤:可仅构建亚洲、伦敦、纽约时段或当日的分布。 智能缩放:分布图自动适应屏幕大小,防止行重叠。 使用方法 将指标附加到图表。在设置中选择分析所用的K线数量( Inp
Italo Volume Indicator
Italo Santana Gomes
4.92 (79)
BUY INDICATOR AND GET EA FOR FREE AS A BONUS + SOME OTHER GIFTS! ITALO VOLUME INDICATOR  is the best volume indicator ever created, and why is that? The Indicator works on all time-frames and assets, indicator built after 7 years of experience on forex and many other markets. You know many volume indicators around the internet are not complete, does not help, and it's difficult to trade, but the Italo Volume Indicator is different , the Italo Volume Indicator shows the wave volume, when market
该指标基于高级数学计算,估算最可能出现的短期价格走势。 功能特点 估算图表时间周期及所有更高时间周期上的即时价格走势; 计算真实的市场趋势; 计算最重要的支撑位和阻力位; 在出现密集区、价格穿越水平位和趋势变化时发出警报; 占用系统资源少:线条和面板只在数值变化时才更新; 自动适应:适用于任何交易品种和任何时间周期,无需调整参数; 可与同一图表上的其他指标、EA 和脚本一起运行。 简介 构成常见交易策略的大多数经典指标都基于简单的数学。这并不是因为在这些指标诞生时没有杰出的数学家,而是因为当时还没有计算机,或者计算机的处理能力太低,无法持续进行复杂的数学运算。如今,任何一部智能手机的性能都远远超过几十年前最强大的计算机。 Advanced Price Movement Predictor(APMP)指标利用当今的计算能力,通过高级的数学、统计和概率方法来捕捉价格波动的本质。 APMP 本身并不提供预测,因为价格走势是一个非平稳的随机过程,因此无法预测。但它会对即时价格走势做出动态估算。 基于同样的分析,APMP 会显示当前市场的真实趋势。迄今为止,趋势几乎总是通过移动平均线、布林带
Atomic Analyst
Issam Kassas
5 (14)
Atomic Analyst — MetaTrader 4 如有产品、设置或技术支持方面的问题,请直接在 MQL5 上给我发消息。 该指标将复杂的市场计算转换为简单的视觉信号、彩色K线、趋势读数、止损水平和多个止盈区域,使交易者能够快速理解并应用于真实市场环境。 主要交易用途: 剥头皮和日内交易: 专为快速决策、清晰箭头、提醒、K线颜色和结构化进出场区域而设计。 日内交易和波段交易: 帮助交易者利用趋势方向、强度、动能和多周期分析跟随更大的市场波动。 主要功能: • 价格行为、强度和动能分析 • 多周期趋势扫描器 • 总体趋势百分比计算 • 买入和卖出箭头 • 止损和多个止盈水平 • 最多 5 个基于斐波那契的止盈水平 • 移动止损逻辑 • 用于趋势和动能的彩色K线 • 实时提醒到终端、手机和电子邮件 • 现代化用户友好面板 • 实时交易监控 • 买入和卖出潜力显示 • 总交易数量显示 • 每日、每周和总利润显示 • 每日佣金计算 • Bid、Ask 和点差显示 • K线计时器、本地时间和服务器时间 • 终端连接状态 • 账户货币显示 • 可直接从面板控制时间周期 • 可手动使用,
Scalping Entry Points
Vitalyi Belyh
5 (1)
Scalping Entry Points - is a manual trading system that can adjust to price movements and give signals to open trades without redrawing. The indicator determines the direction of the trend by the central level of support and resistance. The dot indicator provides signals for entries and exits.  Suitable for manual intraday trading, scalping and binary options. Works on all time frames and trading instruments. The indicator gives several types of alerts. How to use the product The blue line det
Dinapoli Package MT4
Samil Bozuyuk
3 (2)
All in One package includes the  Oscillator Predictor ,  MACD Predictor ,  Thrust Scanner  and  Advanced Fibonacci  indicators which are mandatory for applying  Dinapoli  trade plans.  Please visit below links for detailed explanations of indicators. Advanced Fibonacci Indicator =>  https://www.mql5.com/en/market/product/52834 Thrust Scanner Indicator => https://www.mql5.com/en/market/product/52830 Overbought /Oversold Predictor indicator => https://www.mql5.com/en/market/product/52621 Macd P
True Direction Oscillator
Muhammad Elbermawi
4.85 (364)
或 (TDO),它是一种使用“ 纯动量 ”原理衡量价格变化率的指数。 当证券价格从 10 上涨到 15 时,价格变化率为 150%,但当它从 15 回落到 10 时,价格变化率仅为 33.3%。这就是为什么像“价格变化率”(ROC) 或“动量”这样的技术分析指标给出的上升价格走势读数高于下降价格走势读数的原因。 TDO 解决了这个问题,以帮助交易者正确读取动量。 重要信息 TDO 用户手册: https://www.mql5.com/en/blogs/post/717970 TDO 常见问题: https://www.mql5.com/en/blogs/post/722015 TDO 视频库: https://www.mql5.com/en/blogs/post/722018 TDO Expert Advisor 示例: https://www.mql5.com/en/blogs/post/731141 TDO 特性 TDO 以百分比计算纯动量,因此它用于比较来自不同市场的不同证券。 (例如:将 EURUSD 与 Gold & Dow Jones Industrial 进行比较)
Quantum Imbalance Profiles   是一款平衡与失衡阶段指标。它显示市场在哪些价格成交了成交量、该区域内哪一方占主导,以及价格随后通过哪些水平以脉冲方式扩张。 经典成交量分布只回答一个问题:交易发生在哪里。它不显示每个价格上哪一方占主导、震荡如何结束、市场朝哪个方向突破。Quantum Imbalance Profiles 以 Volume Bid/Ask 模式构建分布——每个水平的成交量被分为卖出和买入——并辅以作者独创的失衡分布,即脉冲扩张在各价格上的分布。成交量分布和 Delta 描述平衡阶段,失衡分布描述从平衡中的突破,K线上的 Delta 气泡标记相对于品种常态的攻击性爆发。 平衡与失衡 市场在两种状态之间交替。平衡时,价格维持在狭窄区间内,成交量集中在有限的水平上,形成成交量密集区——大型参与者在此对着对手方流动性分批建仓。当对手方流动性耗尽时,价格以脉冲方式突破区间——失衡开始。利润产生于失衡,但在平衡中酝酿。指标同时显示两个阶段:不仅能看到成交量在哪里,还能看到市场朝哪个方向兑现了它。 计算无需逐笔历史数据,适用于任何经纪商。分布基于较低时间周期构
Serial Signal Indicator
Vitalyi Belyh
5 (1)
Indicator for manual trading and technical analysis for Forex. It consists of a trend indicator with the opening level of the trading day and a arrow indicator for determining entry points. The indicator does not recolor; it works when the candle closes. Contains several types of alerts for signal arrows. Can be configured to work on any chart, trading instrument or time frame. The work strategy is based on searching for price movements along the trend.  To make " Buy " transactions: The tre
Currency Strength Matrix
Raymond Gilmour
4.5 (26)
THE ONLY CURRENCY STRENGTH INDICATOR BUILT ON PRICE ACTION Most currency strength meters average an oscillator, or measure how far price has travelled. But these are not accurate measures of trend, Currency Strength Matrix measures trend strength, not just if a currency price has gone up or down. Currency Strength Matrix reads market structure . For each of the 28 major pairs it finds the confirmed cycle highs and lows, and decides whether that pair is in an uptrend, a downtrend, or neither. A
Dark Support Resistance  is an Indicator for intraday trading. This Indicator is programmed to identify  Support and Resistance Lines , providing a high level of accuracy and reliability. Key benefits Easily visible lines Only the most important levels will be displayed Automated adjustment for each timeframe and instrument Easy to use even for beginners Never repaints, never backpaints, Not Lag 100% compatible with Expert Advisor development All types of alerts available: Pop-up, Email, Push
作者的更多信息
Parabolic SAR Multi-Filter System MT5: Algorithmic Trend Reversal Engine 1. PRODUCT OVERVIEW & OPERATIONAL ARCHITECTURE Parabolic SAR Multi-Filter System MT5 is a professional multi-component technical analysis indicator engineered for the MetaTrader 5 terminal. The indicator combines J. Welles Wilder's classic Parabolic Time/Price System with an advanced modular filtering architecture comprising 17 distinct secondary validation engines. The primary objective of this software is to eliminate f
Hull Trend Arrows MT5 with Multi-Filter Suite - Technical Documentation 1. Overview and Analytical Purpose Hull Trend Arrows MT5 with Multi-Filter Suite is an algorithmic technical indicator for MetaTrader 5. It integrates the low-lag calculation engine of the Hull Moving Average (HMA) with fourteen modular confirmation filters to identify directional momentum transitions, calculate inflection points, and display non-repainting entry signals on the chart. Standard moving averages introduce sign
FREE
Product Overview: Relative Vigor Index Multi-Filter Technical System The Relative Vigor Index (RVI) Multi-Filter Indicator is a comprehensive technical analysis engine developed for the MetaTrader 5 terminal. Designed to identify cyclical momentum shifts, trend continuations, and structural market turning points, this analytical system couples the classic Relative Vigor Index formula with an advanced multi-layered confirmation matrix consisting of 17 distinct technical filters. Rather than rely
FREE
HA Signal MultiFilter MT5 - Technical Operational Manual & Architecture Guide 1. SYSTEM OVERVIEW & ARCHITECTURAL FOUNDATION HA Signal MultiFilter MT5 is a specialized analytical indicator developed for MetaTrader 5 terminal to identify directional momentum expansions and structural trend continuations[cite: 2]. By synthesizing smoothed Heiken Ashi candlestick price discovery with a modular 15-layer secondary confirmation filter suite, the system extracts high-probability market shifts while fil
FREE
1. OVERVIEW Harmonic Dashboard is a specialized multi-symbol and multi-timeframe analytical indicator designed for MetaTrader 5 (MT5). The software systematically scans financial instruments across multiple timeframes to identify six classical harmonic chart patterns: Gartley, Bat, Butterfly, Crab, Cypher, and Shark. The application consolidates multi-asset scanner results, trend filter validation metrics, price level projections, and interactive chart navigation controls into a single graphic
Overview MACD Signal with Multi Filters is an advanced technical analysis indicator engineered for MetaTrader 5 (MT5). The software combines the classic Moving Average Convergence Divergence (MACD) oscillator architecture with a modular 14-filter confirmation engine (MultiFilterSuite). It is developed to assist manual traders, quantitative analysts, and algorithmic system developers in identifying momentum shifts, trend continuations, and structural turning points while filtering out sideways ma
Overview The MA Cross Scanner Pro is an advanced, highly optimized multi-symbol and multi-timeframe analytical dashboard engineered specifically for the MetaTrader 5 terminal. Designed for technical analysts, systemic traders, and quantitative researchers, this utility serves as a comprehensive market surveillance engine. Its primary objective is to continuously monitor a customized array of financial instruments across numerous timeframes simultaneously, detecting precise moving average crosso
CCI MultiFilter Overbought Oversold Signal Pro MT5 Technical Specification & Operational Manual  1. Overview and System Identity CCI MultiFilter Overbought Oversold Signal Pro MT5 is an institutional-grade technical analysis indicator engineered natively for MetaTrader 5. Developed for quantitative analysts, systematic manual traders, and multi-asset operators, the system provides an objective algorithmic framework to identify cyclical market extremes, momentum shifts, and structural trend cont
WPR Williams Percent Range All Pair Timeframe Scanner Dashboard Overview WPR Scanner Dashboard Pro is a multi-symbol, multi-timeframe market scanning indicator and visual chart overlay utility built for MetaTrader 4 (MT4). The tool monitors Williams Percent Range (WPR) momentum exhaustion and threshold breakouts across multiple currency pairs, metals, indices, and CFDs simultaneously from a single chart window. In addition to its core WPR detection engine, the indicator incorporates an optiona
WAE Waddah Attar Explosion Multi Pair TimeFrame Scanner 1. Overview - WAE Scanner Dashboard is a technical analysis indicator and multi-symbol, multi-timeframe market scanner built for MetaTrader 4 (MT4). - It automates multi-chart monitoring by scanning volatility-driven momentum breakouts based on the Waddah Attar Explosion (WAE) methodology across multiple currency pairs, crosses, indices, or metals simultaneously. - Candidate signals are processed through a modular 15-filter technical conf
UT Bot Trend Multi Pair Timeframe Scan Dashboard Overview UT Bot Scanner Dashboard is a multi-pair and multi-timeframe technical indicator and market scanner developed natively for MetaTrader 4 (MT4). It continuously monitors selected Forex pairs, precious metals, indices, or active Market Watch symbols across multiple timeframes simultaneously to detect dynamic Average True Range (ATR) volatility trailing stop crossovers. Instead of manually cycling through dozens of individual charts to monit
TDI Traders Dynamic Index RSI Scanner All Pair TF Overview TDI & RSI Dynamic Line Dashboard Scanner is a multi-symbol and multi-timeframe analytical indicator designed for MetaTrader 4. The tool monitors multiple currency pairs, commodities, or indices across selected chart timeframes simultaneously to detect crossover events derived from the Traders Dynamic Index (TDI) and dual Relative Strength Index (RSI) Dynamic Lines. Every detected signal is evaluated against an optional 15-module technica
Stochastic Scanner Dashboard for MetaTrader 4 Stochastic Overbought Oversold Scanner Dashboard All Pair Time frame Overview - Stochastic Scanner Dashboard is a multi-symbol and multi-timeframe technical analysis indicator and market scanner built for MetaTrader 4 (MT4). - The tool continuously monitors user-defined currency pairs, metals, or Market Watch symbols across multiple timeframes from one chart. - It detects momentum shifts using configurable Stochastic Oscillator strategies and valida
SSL Channel Trend Scanner Dashboard Multi Pair Multi TimeFrame Overview SSL Channel Multi-Filter Dashboard is a technical analysis indicator and multi-symbol, multi-timeframe market scanner built for MetaTrader 4. It continuously monitors multiple currency pairs, commodities, or other broker instruments across user-selected timeframes to detect directional channel crossovers confirmed by an optional 15-module technical filter suite. Validated signals are organized in an interactive on-chart dash
Relative Vigor Index RVI All Pair and Timeframe Scanner Dashboard Overview RVI Scanner Dashboard is a multi-pair and multi-timeframe technical indicator and interactive scanner panel for MetaTrader 4 (MT4). Built around the Relative Vigor Index (RVI) oscillator, it continuously monitors multiple currency pairs, commodities, or indices across selected timeframes from one chart window. The tool detects directional momentum crossovers, validates setups through an optional 15-module technical conf
RSI Parabolic Overbought Oversold Multi pair Timeframe Scanner 1. Overview - RSI Parabolic Scanner Dashboard is a multi-symbol, multi-timeframe technical analysis indicator and real-time market scanner engineered for MetaTrader 4 (MT4). - It continuously monitors user-defined currency pairs, metals, or visible Market Watch instruments across multiple chart timeframes to identify momentum reversals and overbought or oversold market conditions. - The indicator combines two selectable RSI-based si
RSI Divergence Multi Pair Timeframe Scan Dashboard Overview - Product Type: Multi-symbol, multi-timeframe technical analysis indicator and interactive market dashboard scanner for MetaTrader 4 (MT4). - Core Purpose: Continuously monitors configured currency pairs, precious metals, indices, or active Market Watch symbols across multiple chart timeframes simultaneously to identify Regular and Hidden Relative Strength Index (RSI) divergence setups in one unified terminal window. - Structured Trade
Overview - Product Identity: Pola MultiCandle Scanner Dashboard is a multi-pair and multi-timeframe technical analysis indicator and market scanner developed for MetaTrader 4 (MT4). - Core Purpose: Continuously monitors user-defined currency pairs, precious metals, or Market Watch instruments across multiple timeframes to detect structured multi-candle price action formations, validate setups through a modular 15-indicator confluence suite, calculate volatility-adjusted Stop Loss (SL) and dual
MACD Signal Trend Cross Scanner All Pair Dashboard Overview MACD Scanner Dashboard is a technical analysis utility and multi-symbol, multi-timeframe dashboard indicator designed for MetaTrader 4[cite: 1]. Its primary objective is to monitor MACD crossover events across multiple currency pairs and chart timeframes simultaneously from a single active chart window[cite: 1]. Instead of manually switching between dozens of charts, traders can observe real-time market momentum, directional bias, calc
MA Moving Average Cross Scanner All Pair Timeframe Dashboard Overview MA Cross Scanner is an analytical multi-symbol and multi-timeframe technical indicator equipped with an interactive on-chart dashboard panel for MetaTrader 4[cite: 1]. The tool is engineered to monitor Moving Average (MA) crossover events across multiple currency pairs and timeframes simultaneously, consolidating signal detection, modular trend/momentum filtering, and Average True Range (ATR) risk-reward level calculations in
Ichimoku Tenkan Kijun Cross Scanner All Pair TimeFrame Overview TK Cross Scanner Dashboard is a technical analysis indicator and multi-asset market scanner engineered for the MetaTrader 4 platform. The utility monitors multiple currency pairs, commodities, and timeframes simultaneously to detect Ichimoku Tenkan-sen and Kijun-sen crossovers (TK Cross). In addition to automated signal scanning, the software calculates dynamic Stop Loss (SL) and dual Take Profit (TP1 and TP2) reference levels usin
Ichimoku Senkou Span B Scanner All Pair Timeframe Overview Senkou Span B Scanner Dashboard MT4 is a technical analysis indicator and multi-asset market scanner designed for MetaTrader 4. The tool monitors multiple currency pairs, commodities, and timeframes simultaneously from a single chart window to detect price interactions with the Ichimoku Kinko Hyo Senkou Span B boundary. In addition to scanning for signal candidates, the indicator integrates a 15-module secondary confirmation suite, calc
Heiken Ashi Multi Currency Pair Time Frame Scan Dashboard Overview Heiken Ashi Multi Timeframe Scanner Dashboard is a technical analysis utility and multi-symbol, multi-timeframe market scanner developed for the MetaTrader 4 platform. The tool is designed to monitor multiple currency pairs, commodities, or indices simultaneously from a single chart window. Instead of manually switching between dozens of charts and timeframes to inspect Heiken Ashi candle formations, traders can view active dire
Pro Harmonic Pattern Scanner All Pair Time Frame Dashboard Harmonic Pattern Scanner Dashboard MT4 is an analytical multi-symbol and multi-timeframe technical indicator designed for MetaTrader 4. It automatically scans price action across selected currency pairs, metals, or Market Watch instruments to identify classic XABCD harmonic structures, calculate Fibonacci-based entry, Stop Loss, and Take Profit zones, and validate setups through an integrated modular trend and momentum filter suite. Op
Fractal Breakout Scanner Multi Pair Timeframe Dashboard Overview Fractal Breakout Scanner Dashboard is a technical analysis indicator and multi-symbol, multi-timeframe scanning utility designed for MetaTrader 4. The tool monitors multiple currency pairs, commodities, and indices simultaneously to detect price breakouts beyond confirmed Bill Williams Fractal swing highs and swing lows. Rather than requiring manual chart switching across dozens of instruments, the indicator aggregates real-time b
Institutional Candle Price Engulfing Scan All Pair Timeframe Engulfing Scanner Dashboard is a technical analysis utility and multi-symbol, multi-timeframe candlestick pattern scanner for MetaTrader 4. It detects Bullish Engulfing and Bearish Engulfing setups across multiple currency pairs and timeframes simultaneously, displaying active signals in an interactive on-chart table alongside ATR-based Stop Loss and Take Profit reference levels. 1. Overview and Technical Purpose - Product Category:
Pinbar Marubozu Rejection Candlestick Scanner All Pair Timeframe Overview Candle Pattern Scanner Dashboard is a technical analysis utility and multi-pair, multi-timeframe scanner indicator designed for MetaTrader 4. The indicator continuously monitors multiple currency pairs, commodities, or indices across selected timeframes to detect specific Japanese candlestick price action formations—namely Candle Rejection, Full-Body Marubozu, and Classic Pin Bar structures. When a valid candlestick forma
Chaikin Oscillator Scanner All Pair Timeframe Dashboard Overview Chaikin Oscillator Scanner Dashboard is a technical analysis utility and multi-symbol, multi-timeframe market scanner designed for MetaTrader 4 (MT4)[cite: 1]. The indicator monitors multiple currency pairs, commodities, or indices simultaneously across selected chart timeframes to identify Chaikin Oscillator zero-line crossover events[cite: 1]. Detected setups are presented in an interactive on-chart table complete with automated
CCI Signal Trend Overbought Oversold Scanner All Pair TimeFrame Dashboard CCI Multi Timeframe Scanner Dashboard is a technical analysis utility and multi-symbol market scanner developed for MetaTrader 4. The indicator monitors multiple currency pairs and timeframes simultaneously using Commodity Channel Index (CCI) calculations combined with an optional multi-indicator confirmation suite and Average True Range (ATR) volatility projections. 1. Operating Principle and Signal Validity - Core Cal
BB Bollinger Bands Breakout Scanner All Pair Time Frame Bollinger Bands Breakout Scanner Dashboard is a technical analysis utility and multi-symbol, multi-timeframe market scanner engineered for MetaTrader 4 (MT4). The software continuously monitors multiple currency pairs, commodities, or indices across user-defined timeframes to detect confirmed Bollinger Bands breakout setups. Every detected signal is evaluated through an optional modular confirmation suite and automatically paired with vola
筛选:
无评论
回复评论