PSAR Parabolic SAR Signal Arrow MultiFilter Trend

PSAR Parabolic SAR Signal Arrow MultiFilter Trend

Overview

Parabolic SAR Multi Filter No Repaint Signal MT4 is a technical analysis indicator engineered for the MetaTrader 4 platform. The tool combines classical Parabolic Stop and Reverse (PSAR) directional reversal detection with a modular 15-filter confirmation architecture and automated Average True Range (ATR) target mapping. It is designed to help traders identify confirmed directional shifts on closed candlesticks while filtering out low-momentum or counter-trend price fluctuations across multiple market regimes.
All signal calculations are strictly anchored to completed historical bars, ensuring that plotted BUY and SELL entry arrows do not repaint, shift, or disappear once a candlestick has closed. In addition to directional signal arrows, the indicator dynamically renders horizontal reference levels for Entry, Stop Loss (SL), and three risk-reward Take Profit targets (TP1, TP2, TP3) directly on the price chart, paired with a multi-channel notification system for real-time market monitoring.

Operating Principle and Signal Logic
The indicator operates through a sequential four-stage technical pipeline executed on each newly closed bar:
- Primary Parabolic SAR Reversal Engine: The core module continuously tracks Parabolic SAR acceleration dots relative to candlestick price extremes using configurable step and maximum acceleration parameters. A potential directional transition is registered only when the Parabolic SAR polarity flips from one side of price action to the opposite side across consecutive completed candles.
- Strict Closed-Bar Non-Repainting Architecture: Signal evaluation is restricted exclusively to closed bars (bar index 1 and older). The currently forming live candle (bar index 0) is intentionally excluded from signal arrow plotting. Consequently, no tentative intra-bar arrows appear before candle close, and every confirmed signal arrow remains permanently fixed at its historical bar coordinate.
- Bullish (BUY) Signal Generation Conditions: A BUY arrow is generated upon candle close when the Parabolic SAR dots transition from above price action to below price action, confirming an upward directional shift, AND all user-activated confirmation filters simultaneously validate bullish market alignment on that same closed bar. When all active criteria are satisfied, a BUY arrow is plotted below the signal candle low at a configurable ATR-proportioned offset.
- Bearish (SELL) Signal Generation Conditions: A SELL arrow is generated upon candle close when the Parabolic SAR dots transition from below price action to above price action, confirming a downward directional shift, AND all user-activated confirmation filters simultaneously validate bearish market alignment on that same closed bar. When all active criteria are satisfied, a SELL arrow is plotted above the signal candle high at a configurable ATR-proportioned offset.
- Modular 15-Filter Confluence Gate: Before any Parabolic SAR flip is validated as an actionable chart arrow, the candidate bar passes through an independent multi-filter verification suite. Each of the 15 built-in filter modules evaluates a distinct technical dimension—including oscillator threshold crossovers, directional trend strength, single and dual moving average alignment, Ichimoku cloud boundaries, macro-momentum midlines, Awesome Oscillator histogram dynamics, secondary SAR alignment, Heiken Ashi smoothed candle polarity, Commodity Channel Index regimes, Relative Vigor Index crossovers, MACD histogram and zero-axis polarity, dynamic Support/Resistance zones, Fibonacci retracement clusters, and ATR-based Supertrend direction. Disabled filters are bypassed automatically, while enabled filters operate in logical conjunction so that every active condition must agree before a signal is emitted.
- Dynamic ATR Volatility Risk and Reward Projection: Whenever a valid BUY or SELL signal is confirmed, the indicator samples the signal bar ATR value multiplied by a user-defined risk factor to establish the initial 1R risk distance. From the signal candle closing price, it automatically projects a horizontal Entry level, a protective Stop Loss level at 1R, and three progressive Take Profit levels at 1R (TP1), 2R (TP2), and 3R (TP3).

Key Technical Features
- Closed-Bar Signal Integrity: Evaluates and locks BUY and SELL arrows strictly after candlestick closure, preventing intra-bar signal flickering or historical recalculation drift.
- 15 Independent Confirmation Modules: Integrates 15 distinct technical filters inside a unified input panel, allowing traders to combine trend, momentum, volatility, and price-structure confirmations without attaching external indicators to the chart.
- Automated ATR Target Visualization: Draws clean horizontal segments and right-aligned price labels for Entry, Stop Loss, TP1 (1R), TP2 (2R), and TP3 (3R) anchored to the most recent confirmed signal.
- Granular Visual Customization: Provides full control over Wingdings arrow symbols, arrow line widths, candle-range vertical offsets, target line styles, label font sizes, and individual color assignments for every graphical element.
- Synchronized Multi-Channel Alerts: Supports MetaTrader pop-up alert windows, custom WAV sound playback, mobile push notifications via MetaQuotes ID, and SMTP email alerts triggered once per closed signal bar.
- Lightweight Single-Chart Execution: Encapsulates all 15 filter engines internally within a single compiled indicator file, eliminating template clutter and external file dependencies.

Graphical Interface, Alerts, and Computational Efficiency
- On-Chart Visual Elements and Color Legend:
  - Parabolic SAR Dots (Default: DodgerBlue): Dotted trajectory tracking trailing acceleration levels above or below price bars.
  - BUY Entry Arrow (Default: Aqua, Wingdings 233): Upward arrow plotted below the confirmed bullish signal candle low.
  - SELL Entry Arrow (Default: Red, Wingdings 234): Downward arrow plotted above the confirmed bearish signal candle high.
  - Entry Reference Line (Default: Gold, Solid): Horizontal line marking the closing price of the most recent valid signal bar, accompanied by a right-aligned BUY or SELL price label.
  - Stop Loss Reference Line (Default: Red, Dashed): Horizontal line indicating the 1R ATR-based invalidation level with an exact SL price label.
  - Take Profit Target Lines (Default: LimeGreen for TP1, MediumSeaGreen for TP2, DodgerBlue for TP3, Dashed): Three horizontal reward projection lines displaying 1R, 2R, and 3R price targets.
- Multi-Channel Alert System Behavior:
  - Alerts are dispatched exclusively when a newly closed bar (bar index 1) produces a validated BUY or SELL arrow.
  - Built-in duplicate suppression tracks the timestamp of the last alerted bar so that each confirmed signal triggers at most one notification per channel, regardless of incoming tick frequency.
  - Each alert message includes the signal direction, instrument symbol, active chart timeframe, and exact signal bar timestamp.
- Computational Performance and Terminal Resource Management:
  - The indicator requires a minimum history of 100 loaded bars on the active chart to stabilize long-period filters and volatility buffers.
  - After initial historical loading, incremental calculation updates only newly formed bars rather than recalculating the entire chart history on every tick.
  - On-chart SL/TP lines and labels are rendered only for the single most recent confirmed signal and are automatically removed when the indicator is detached or chart parameters reset, keeping chart object counts minimal.
  - When running the indicator simultaneously across numerous open charts with computationally intensive structural filters active (such as Fibonacci ZigZag swing scanning or Support/Resistance lookbacks), users are advised to limit the number of simultaneously open charts according to workstation CPU and memory capacity.

Operation and Setup Recommendations
- Supported Financial Instruments: Suitable for major and minor Forex currency pairs (such as EURUSD, GBPUSD, USDJPY, AUDUSD, USDCAD), precious metals (such as XAUUSD), stock indices, and liquid CFDs. Traders should evaluate instrument-specific spread and volatility characteristics before deployment.
- Recommended Timeframes: Compatible with all standard MetaTrader 4 timeframes from M1 to MN1. Intraday traders commonly apply the indicator on M5, M15, and M30 charts using tighter ATR multipliers, while swing traders generally favor H1, H4, and D1 timeframes for broader directional filtering.
- Broker Account and Execution Environment: Operates seamlessly on standard, ECN, and Raw Spread MT4 accounts across both Hedging and Netting account structures. For lower timeframes (M1 to M15), a low-spread ECN broker environment is recommended so that spread costs remain proportional to the projected 1R ATR Stop Loss distance.
- Practical Filter Configuration Workflow: All 15 confirmation filters are disabled by default so users can first observe baseline Parabolic SAR reversal signals. Rather than enabling all 15 filters simultaneously—which can overly restrict signal frequency—traders are encouraged to activate 1 to 3 complementary filters from non-overlapping categories (for example, pairing one macro-trend filter such as Double MA or Supertrend with one momentum filter such as ADX or MACD).

Input Parameters Documentation
All configuration parameters available in the MetaTrader 4 Inputs tab are organized into functional groups below:

Group 1: PSAR Entry Logic Parameters (Section Header: InpGroup1)
- InpStep (Default: 0.02) - Acceleration factor step increment governing how rapidly Parabolic SAR dots converge toward price action during a trend (unit: decimal factor).
- InpMaximum (Default: 0.20) - Upper ceiling limit for the Parabolic SAR acceleration factor (unit: decimal factor).

Group 2: Display Settings (Section Header: InpGroup2)
- InpSARColor (Default: clrDodgerBlue) - Color applied to the primary Parabolic SAR dotted curve plotted on the main chart (unit: color).
- InpBuyColor (Default: clrAqua) - Color applied to confirmed bullish BUY signal arrows (unit: color).
- InpSellColor (Default: clrRed) - Color applied to confirmed bearish SELL signal arrows (unit: color).
- InpArrowCodeBuy (Default: 233) - Wingdings character code defining the graphical icon shape for BUY arrows (unit: integer Wingdings code).
- InpArrowCodeSell (Default: 234) - Wingdings character code defining the graphical icon shape for SELL arrows (unit: integer Wingdings code).
- InpArrowWidth (Default: 2) - Rendering thickness size of BUY and SELL signal arrows, valid from 1 to 5 (unit: pixel width level).
- InpOffsetATR (Default: 0.3) - Vertical spacing offset between the signal candle high/low and the plotted arrow, scaled as a fraction of the signal candle range (unit: candle-range multiplier).

Group 3: Alerts and Notifications (Section Header: InpGroup3)
- InpAlerts (Default: true) - Enables or disables standard MetaTrader terminal pop-up alert dialog boxes on closed-bar signal confirmation (unit: boolean true/false).
- InpAlertSound (Default: true) - Enables or disables audible WAV sound alerts when a valid signal triggers (unit: boolean true/false).
- InpAlertPush (Default: true) - Enables or disables mobile push notifications delivered to iOS/Android MetaTrader apps via MetaQuotes ID (unit: boolean true/false).
- InpAlertEmail (Default: false) - Enables or disables email signal alerts dispatched through the terminal SMTP mail configuration (unit: boolean true/false).
- InpSoundFile (Default: "alert.wav") - Name of the audio file inside the MetaTrader Sounds folder played during sound alerts (unit: text string filename).

Group 4: ATR and Target Levels SL/TP (Section Header: InpGroup4)
- InpShowLines (Default: true) - Toggles on-chart rendering of Entry, Stop Loss, and Take Profit horizontal target lines for the latest signal (unit: boolean true/false).
- InpATRPeriod (Default: 7) - Lookback bar period used to compute the Average True Range volatility baseline at the signal candle (unit: bars).
- InpATRMult (Default: 1.5) - Multiplier applied to the signal bar ATR value to define the 1R Stop Loss risk distance (unit: ATR multiplier).
- InpLineExtendBars (Default: 1) - Number of chart bars to extend the Entry, SL, and TP horizontal lines to the right beyond the current bar (unit: bars).
- InpFontSize (Default: 8) - Typographic font size for the right-aligned price labels attached to Entry, SL, and TP lines (unit: font points).
- InpColorEntry (Default: clrGold) - Color of the solid horizontal Entry price reference line and text label (unit: color).
- InpColorSL (Default: clrRed) - Color of the horizontal Stop Loss reference line and text label (unit: color).
- InpColorTP1 (Default: clrLimeGreen) - Color of the first Take Profit target line and label set at 1R reward distance (unit: color).
- InpColorTP2 (Default: clrMediumSeaGreen) - Color of the second Take Profit target line and label set at 2R reward distance (unit: color).
- InpColorTP3 (Default: clrDodgerBlue) - Color of the third Take Profit target line and label set at 3R reward distance (unit: color).
- InpTargetLineStyle (Default: STYLE_DASH) - Line drawing style (solid, dash, dot, dash-dot) applied to SL, TP1, TP2, and TP3 lines (unit: ENUM_LINE_STYLE enumeration).
- InpLineWidth (Default: 1) - Line thickness applied to Entry, SL, and TP horizontal lines (unit: pixel width).

Filter Module 1: RSI Cross Filter (Section Header: InpFilter1)
- Use_RSI_Cross_Filter (Default: false) - Enables or disables Relative Strength Index threshold crossover validation (unit: boolean true/false).
- RSI_Length (Default: 14) - Averaging lookback period for the RSI oscillator calculation (unit: bars).
- RSI_Price_Source (Default: PRICE_CLOSE) - Applied candlestick price series used for RSI calculation (unit: ENUM_APPLIED_PRICE enumeration).
- RSI_Oversold (Default: 30.0) - Lower RSI boundary level used to confirm bullish recovery crossovers (unit: RSI index points, 0 to 100).
- RSI_Overbought (Default: 70.0) - Upper RSI boundary level used to confirm bearish reversal crossovers (unit: RSI index points, 0 to 100).

Filter Module 2: ADX Trend Filter (Section Header: InpFilter2)
- Use_ADX_Filter (Default: false) - Enables or disables Average Directional Movement Index trend-strength filtering (unit: boolean true/false).
- ADX_Period (Default: 10) - Lookback period for calculating the ADX main strength line (unit: bars).
- ADX_Min_Level (Default: 20.0) - Minimum ADX reading required to confirm active directional trend strength (unit: ADX index points).

Filter Module 3: Single MA Filter (Section Header: InpFilter3)
- Use_MA_Filter (Default: false) - Enables or disables single Moving Average directional price-position filtering (unit: boolean true/false).
- MA_Period (Default: 50) - Lookback averaging period for the baseline Moving Average (unit: bars).
- MA_Method (Default: MODE_SMA) - Averaging smoothing method such as SMA, EMA, SMMA, or LWMA (unit: ENUM_MA_METHOD enumeration).
- MA_Shift (Default: 0) - Horizontal bar shift offset applied to the Moving Average series (unit: bars).

Filter Module 4: Ichimoku Senkou Span B Filter (Section Header: InpFilter4)
- Use_Ichimoku_Filter (Default: false) - Enables or disables Ichimoku Kinko Hyo Senkou Span B cloud boundary trend filtering (unit: boolean true/false).
- Ichimoku_Tenkan (Default: 9) - Tenkan-sen (Conversion Line) calculation period (unit: bars).
- Ichimoku_Kijun (Default: 26) - Kijun-sen (Base Line) calculation period (unit: bars).
- Ichimoku_SenkouB (Default: 52) - Senkou Span B (Leading Span B) calculation period defining the primary cloud boundary (unit: bars).

Filter Module 5: RSI 75 Filter (Section Header: InpFilter5)
- Use_RSI75_Filter (Default: false) - Enables or disables long-period RSI 50-midline macro-trend bias filtering (unit: boolean true/false).
- RSI_Filter_Period (Default: 75) - Extended lookback period for the macro-momentum RSI filter (unit: bars).

Filter Module 6: Double MA Filter (Section Header: InpFilter6)
- Use_DoubleMA_Filter (Default: false) - Enables or disables dual Moving Average directional alignment filtering (unit: boolean true/false).
- MA_A_Period (Default: 30) - Lookback period for the faster Moving Average A (unit: bars).
- MA_A_Method (Default: MODE_EMA) - Smoothing method for the faster Moving Average A (unit: ENUM_MA_METHOD enumeration).
- MA_A_Applied (Default: PRICE_CLOSE) - Applied price source for the faster Moving Average A (unit: ENUM_APPLIED_PRICE enumeration).
- MA_A_Shift (Default: 0) - Horizontal bar shift offset for the faster Moving Average A (unit: bars).
- MA_B_Period (Default: 140) - Lookback period for the slower Moving Average B (unit: bars).
- MA_B_Method (Default: MODE_EMA) - Smoothing method for the slower Moving Average B (unit: ENUM_MA_METHOD enumeration).
- MA_B_Applied (Default: PRICE_CLOSE) - Applied price source for the slower Moving Average B (unit: ENUM_APPLIED_PRICE enumeration).
- MA_B_Shift (Default: 0) - Horizontal bar shift offset for the slower Moving Average B (unit: bars).

Filter Module 7: Awesome Oscillator Filter (Section Header: InpFilter7)
- Use_AO_Filter (Default: false) - Enables or disables the Bill Williams Awesome Oscillator momentum filter group (unit: boolean true/false).
- Use_AO_Volume_Filter (Default: false) - Enables or disables minimum histogram amplitude threshold checks within the AO filter (unit: boolean true/false).
- AO_Buy_Min (Default: 4.0) - Minimum positive AO histogram threshold required for bullish validation when amplitude filtering is active (unit: oscillator points).
- AO_Sell_Max (Default: -4.0) - Maximum negative AO histogram threshold required for bearish validation when amplitude filtering is active (unit: oscillator points).
- Use_AO_Color_Filter (Default: false) - Enables or disables bar-to-bar AO histogram directional slope confirmation (unit: boolean true/false).
- Use_AO_Zero_Filter (Default: false) - Enables or disables zero-line polarity and directional slope confirmation on the AO histogram (unit: boolean true/false).

Filter Module 8: Parabolic SAR Filter (Section Header: InpFilter8)
- Use_SAR_Filter (Default: false) - Enables or disables a secondary Parabolic SAR trend-confirmation filter with independent sensitivity parameters (unit: boolean true/false).
- SAR_Step (Default: 0.02) - Acceleration factor step increment for the secondary Parabolic SAR filter (unit: decimal factor).
- SAR_Maximum (Default: 0.2) - Maximum acceleration factor ceiling for the secondary Parabolic SAR filter (unit: decimal factor).

Filter Module 9: Heiken Ashi Filter (Section Header: InpFilter9)
- Use_HeikenAshi_Filter (Default: false) - Enables or disables smoothed Heiken Ashi candle body polarity confirmation (unit: boolean true/false).

Filter Module 10: CCI Trend Filter (Section Header: InpFilter10)
- Use_CCI_Filter (Default: false) - Enables or disables Commodity Channel Index zero-axis directional trend filtering (unit: boolean true/false).
- CCI_Period (Default: 50) - Lookback period for the trend-bias CCI calculation (unit: bars).
- CCI_Applied (Default: PRICE_CLOSE) - Applied candlestick price source for the trend-bias CCI calculation (unit: ENUM_APPLIED_PRICE enumeration).

Filter Module 11: CCI OB and OS Filter (Section Header: InpFilter11)
- Use_CCI_OBOS_Filter (Default: false) - Enables or disables Commodity Channel Index extreme momentum threshold filtering (unit: boolean true/false).
- CCI_OBOS_Period (Default: 14) - Lookback period for the overbought/oversold CCI calculation (unit: bars).
- CCI_OBOS_Applied (Default: PRICE_CLOSE) - Applied candlestick price source for the overbought/oversold CCI calculation (unit: ENUM_APPLIED_PRICE enumeration).
- CCI_Overbought (Default: 100.0) - Upper CCI threshold level required for bullish momentum confirmation (unit: CCI index points).
- CCI_Oversold (Default: -100.0) - Lower CCI threshold level required for bearish momentum confirmation (unit: CCI index points).

Filter Module 12: RVI Filters (Section Header: InpFilter12)
- Use_RVI_Filter (Default: false) - Enables or disables Relative Vigor Index main-line zero-level directional filtering (unit: boolean true/false).
- RVI_Period (Default: 75) - Lookback period for the RVI zero-level trend filter (unit: bars).
- Use_RVI_Signal_Filter (Default: false) - Enables or disables RVI main-line versus signal-line directional alignment filtering (unit: boolean true/false).
- RVI_Signal_Period (Default: 20) - Lookback period for the RVI main and signal line comparison (unit: bars).

Filter Module 13: MACD Filters (Section Header: InpFilter13)
- Use_MACD_Filter (Default: false) - Enables or disables Moving Average Convergence Divergence histogram polarity filtering (unit: boolean true/false).
- MACD_FastEMA (Default: 12) - Fast exponential moving average period for MACD calculation (unit: bars).
- MACD_SlowEMA (Default: 26) - Slow exponential moving average period for MACD calculation (unit: bars).
- MACD_SignalSMA (Default: 9) - Signal line simple moving average period for MACD calculation (unit: bars).
- MACD_Applied (Default: PRICE_CLOSE) - Applied candlestick price source for MACD calculation (unit: ENUM_APPLIED_PRICE enumeration).
- Use_MACD_Zero_Filter (Default: false) - Enables or disables MACD main-line zero-axis directional trend filtering (unit: boolean true/false).

Filter Module 14: SR and Fibonacci Filters (Section Header: InpFilter14)
- Use_SR_Filter (Default: false) - Enables or disables dynamic lookback Support and Resistance proximity zone validation (unit: boolean true/false).
- SR_Period (Default: 50) - Historical bar lookback window scanned to determine local Support and Resistance extremes (unit: bars).
- SR_Zone_Points (Default: 80) - Proximity tolerance band around detected Support or Resistance levels within which signal candles are validated (unit: broker points).
- Use_Fib_Filter (Default: false) - Enables or disables automatic swing-based Fibonacci retracement zone validation (unit: boolean true/false).
- Fib_Level_1 (Default: 0.382) - First Fibonacci retracement ratio boundary defining the active pullback zone (unit: decimal ratio).
- Fib_Level_2 (Default: 0.618) - Second Fibonacci retracement ratio boundary defining the active pullback zone (unit: decimal ratio).
- ZigZag_Depth (Default: 12) - Minimum bar depth parameter used to identify structural swing highs and lows for Fibonacci anchoring (unit: bars).
- ZigZag_Deviation (Default: 5) - Minimum price deviation threshold required to confirm a new swing pivot (unit: broker points).
- ZigZag_Backstep (Default: 3) - Minimum bar separation required between consecutive swing pivots (unit: bars).

Filter Module 15: Supertrend Filter (Section Header: InpFilter15)
- Use_Supertrend_Filter (Default: false) - Enables or disables ATR-based Supertrend directional regime filtering (unit: boolean true/false).
- ST_AtrPeriod (Default: 10) - Smoothed ATR lookback period used to compute Supertrend volatility bands (unit: bars).
- ST_Factor (Default: 3.0) - ATR band multiplier governing Supertrend trailing sensitivity (unit: ATR multiplier).

Risk Disclaimer
Trading foreign exchange, commodities, indices, and other leveraged financial instruments carries a high level of risk and may not be suitable for all investors. Past performance and historical signal behavior do not guarantee future results. This indicator is an analytical software utility designed solely to assist traders with technical chart analysis and does not constitute financial or investment advice, nor does it guarantee financial profit. Always test the indicator thoroughly on a demo account to understand its operational behavior and parameter interactions before applying it in a live trading environment.
Produits recommandés
ALBA V2K: The Genius Striker [VIP Edition] Precision Algorithmic Warfare – Designed for XAUUSD Welcome to the apex of targeted algorithmic trading. ALBA V2K (The Striker) is a highly specialized, institutional-grade Expert Advisor developed by AF-Vision Systems. Built upon our legendary Tick-Throttle engine, this VIP edition is not designed for continuous trading; it is engineered to strike with lethal precision when market mechanics align perfectly. If you demand an algorithm that calculates, w
Neon Crossover Signal
Leandro Bernardez Camero
Neon Crossover – Indicateur dynamique de momentum et de retournement Rejoignez la chaîne pour rester informé : https://www.mql5.com/en/channels/forexnewadvisor Neon Crossover est un indicateur multifonctionnel conçu pour détecter avec précision les retournements de momentum et les conditions extrêmes. Il analyse en profondeur le comportement des prix en utilisant une logique complexe de pression haussière/baissière, combinée à un lissage dynamique et aux bandes de Bollinger (BBs). Il est optimi
Most indicators never ask the most important question: is there actually a cycle running right now? Prisma asks it on every bar. When the answer is no, it stays silent. When the answer is yes, it tells you exactly where inside that cycle price currently sits — and signals the crossover at the right moment. The result is an oscillator that filters out the noise that destroys most fixed-period indicators, and fires only when three independent scientific systems agree. Three Scientific Layers 1. Eh
Introducing our cutting-edge product, an innovative MACD Oscillator with a dynamic level enhanced by a decimal point Moving Average (MA) also with the versatility of multiple moving average modes. This advanced trading tool brings precision and flexibility to your technical analysis, offering a seamless experience for traders seeking a competitive edge in the financial markets. Key Features: Dynamic Level Precision Our MACD Oscillator is equipped with a dynamic level feature, providing traders
Magic Flash is going to be a strong investent weapon for you.  Follow your established personal settings.  This EA can be turned into a fast and efficient but relatively high-risk EA,  it can also become a medium or low risk but slower profit.  High growth in a short period of time when in the right market conditions.  But if the market conditions are not right, the "Martingale Stop Loss" function to decisively leave the scene.  This EA is very varied and malleable.  This EA is built on the Sc
PureDailyEA
Ahmet Metin Yilmaz
Expert's signal link has been working on 25 different instruments since 09.07.2019. It will be stopped after a while. https://www.mql5.com/en/signals/605823 This expert advisor works well on daily charts. Opens a pending order based on daily price movements and may revise this pending order based on price movements during the day.  It can keep the current order by following the price movements and can open two different types of additional orders as soon as it sees the opportunity. If he sees t
GoldStar MT4
Marek Kvarda
GoldStar EA is a fully automated trading program (Expert Advisor) designed exclusively for trading gold (XAU/USD). It analyzes multiple timeframes to detect high-probability trading opportunities and integrates advanced trade management tools — all while remaining easy to set up and operate . Key Advantages of GoldStar EA Advanced algorithm scanning multiple timeframes for optimal entry signals. Built-in money management and capital protection to minimize risk. Stable and consistent results ba
Cool Monkey
Sze Yu Ma
4 (1)
Cool Monkey is a fully automatic, highly customizable EA based on Volatility, MACD and RSI to select optimal entry points. It uses a specialized grid structure  to achieve a high winning rate with improved safety. All tests are performed with 99.90% tick data, with simulated spread, execution delay, commission and swap. Trading and optimization experience required if you wish to optimize it. Limited time to buy Cool Monkey for USD30 ! Recommendations: Default settings works on EURUSD M1 chart Cu
New Ea with indicator TWO MA PLUS. Open order BUY : If MA1 > MA2. Open order SELL : If MA1 < MA2. The advantages of EA TWO MA PLUS are: It is equipped with various filters, including: maxspread, maxlot, takeprofit, stop loss, profit target per day, and many more. Setting_Indicator TWO MA = Ma1_Period=14; Ma2_period=28; Ma_Mode=0; EA_indicators=TWO MA ; Hedging=false; ==> true/false Use_MaxSpread=true; MaxSpread=50; ==> Maximal Spread MaxLot=1; ==> Maximal lot Target_profit_perday=50; ==> can wo
Secret Scalper
Burcak Sengezer
Secret Scalper EA is a fully automated Expert Advisor. The EA is a medium-term scalper. Our EA has been created to work confidentially. So, it can close orders with actual account currency value at profit or loss. Also works with stop loss. The EA's strategy has been improved to make reasonable and low-medium risk profit. But, you can also increase your risk, although we do not recommend doing that. The EA's logic is little bit complicated. However, easy to use. Most of settings are set by the E
EZT Bollinger Trendline Indicator based on multiple settings of Bollinger Band. In the menu you can choose the similar settings than bollinger band indicator. Trend period and trend deviations. Also paint and arrow on chart when direction change. Three different kind of alert , such as pop up, e-mail and push notification. Try different settings on different timeframes. Please help my work and rate and comment my products!
Bandes de Bollinger Auto-Optimisées – Outil de volatilité adaptatif basé sur le comportement réel du marché Cet indicateur avancé pour MT4 trouve automatiquement les meilleures périodes et écarts-types en simulant les trades sur les données historiques. Au lieu de paramètres fixes, il s’adapte dynamiquement aux changements du marché et à la structure des prix pour créer des bandes qui reflètent plus précisément la volatilité en temps réel. Pas besoin d’ajustements manuels. Fonctionnalités princi
MBFX Timing
Mohamed Hassan
5 (3)
After purchase, contact me in private to get 7 days of FREE testing with EA Forex Proton where the robot automatically takes the trade alerts from MBFX Timing! MBFX Timing is an indicator that was developed and created by Mostafa Belkhayate, one of the best traders in the world. We decided to create a modified version that takes inspiration from the Stochastic Oscillator and the Relative Strength Quality Index indicators to improve your trading.  One of the main reasons we released MBFX Timing
A trend indicator based on the Ichimoku Kinko Hyo and MACD. The ICloud Scalper Trend Indy is an improved variant of the Ichimoku Kinko Hyo and MACD, which shows the moment of trend following quite accurately. It is often used as a signal filter. Combination of two indicators makes a better use of these advantages: Ichimoku Kinko Hyo identifies the trend, while MACD determines the short-term movements and signals in the trend direction. Messages/Sounds (Notifications and sound settings) ON/OFF -
Fong Sai Yuk
Robert Winata
Overview Fong Sai Yuk is an advanced and robust automated trading system designed for MetaTrader 4 (MT4). Built around a multi-layered filtering approach, this Expert Advisor combines trend strength evaluation, institutional price zones, and adaptive candlestick pattern recognition to execute high-probability trades with precision. Key Features ATR Rope Filter: Dynamically filters market noise using Average True Range (ATR) parameters to ensure trades are aligned with the prevailing trend direct
Three MA Alert
Thushara Dissanayake
L'indicateur   Triple MA Crossover Alert   est un   indicateur de croisement de moyennes mobiles   conçu pour analyser la direction du marché en combinant trois moyennes mobiles :   rapide   ,   normale   et   lente   . Cet indicateur aide les traders à identifier les changements de   tendance   ,   les conditions haussières et baissières   potentielles   , ainsi que les zones importantes de mouvement des prix grâce à une structure claire de trois moyennes mobiles. En combinant   analyse techniq
VJ Pivot Levels
Vijayaratna Kumar Boda
4.25 (4)
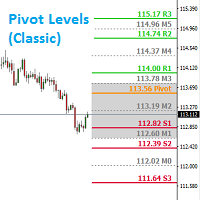
Introduction: Whatever trading method you use, it is important to know the Pivot levels to take the key attention for your entries & exits. This indicator has been made using the standard classic formula for Auto drawing the Pivot levels. Also based on the previous day trading range, the probable expected today trading range has been highlighted in a different color for your reference. Output of the Indicator: This Indicator gives the Pivot level Different resistance Levels Different Support le
Wolf Signal EA
AL MOOSAWI ABDULLAH JAFFER BAQER
Wolf Signal EA – A Powerful Semi-Automated Trading Solution Important: This Expert Advisor is not optimized and is designed for traders who want to fine-tune it to match their own strategies. You have full control over the parameters to adapt it to different market conditions. Overview Wolf Signal EA is a sophisticated tool designed for traders looking to automate their entries using the Parabolic SAR indicator. The EA follows a logic-based approach, ensuring a disciplined entry strategy while
ForexEagle
Hadj Ahmed Slimani
ForexEagle - Elevate Your Trading Experience to New Heights Ready to revolutionize your trading game? Introducing ForexEagle, the ultimate Expert Advisor meticulously crafted to dominate the GBPUSD, AUDCAD, USDCAD markets on the M5 timeframe. With a winning combination of advanced Price Action strategy and trend detection algorithm, ForexEagle is your go-to tool for unlocking the full potential of GBPUSD, AUDCAD, USDCAD trading. The EA operates during specific hours, from 12:01 AM to 11:59 PM. G
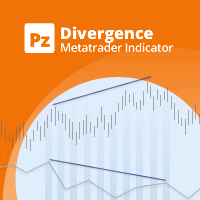
Unlock hidden profits: accurate divergence trading for all markets Tricky to find and scarce in frequency, divergences are one of the most reliable trading scenarios. This indicator finds and scans for regular and hidden divergences automatically using your favourite oscillator. [ Installation Guide | Update Guide | Troubleshooting | FAQ | All Products ] Easy to trade Finds regular and hidden divergences Supports many well known oscillators Implements trading signals based on breakouts Display
Most traders don’t lose because their strategy is bad. They lose because they trade at the wrong time. The same strategy that works in a strong trend will fail in a choppy or unstable market. AEGIS Market Regime Detector shows you exactly what type of market you are in — in real time — so you can avoid bad conditions and trade only when your edge is present. --- ## Why Market Regimes Matter Every trading strategy performs differently depending on market conditions. • Trend-based s

Reversal Edge System is a professional top-bottom reversal indicator built for MetaTrader 5. It identifies potential trend reversal zones and generates clear trade signals, filtered by multi-timeframe trend analysis to reduce false setups. The indicator displays market sentiment in real time: Strong Bullish Strong Bearish Bullish Bias Bearish Bias Bull-Bear Divergence Each signal comes with predefined Take Profit and Stop Loss levels for proper risk management. It includes signal backtest functi
WSN Edge RSI MA Forex EA
Michael Ferreira Da Silva
MT4 EA WSN Edge RSI-MA Multi v1.1 Automate your Forex trading with a complete Expert Advisor for MetaTrader 4 (Windows) . This EA executes an automated strategy using RSI + Moving Averages (MA) —ideal for traders who want disciplined, rules-based entries/exits. ️ Key Features RSI + MA signals for more assertive entries Risk/Reward 1:2 by default Automatic Trailing Stop to lock profits Light martingale (max. 2 steps) for controlled recovery Daily profit target : closes all orders once the t
Garuda Fire MT4
Maldini Yoga Pratama
EA Garuda Fire MT4 .This is the logical development of EA Dragon Fire ultimate, with the addition of better logic and confirmation than before.   EA Garuda Fire MT4   is a trend following system for swing trading based on PLT indicator filtered by I-gentor LSMA. no need to add any indicators because everything is included in this EA code, so the trading decisions are simple and immediate without confusion that can result from the use of many indicators Only   10 download  of the EA left  at $69
Golge Guardian
Ismail Demirci
ENGLISH VERSION GOLGE GUARDIAN – Professional Gold Scalping EA Trade Gold with Precision GOLGE GUARDIAN is a professional Expert Advisor developed specifically for MetaTrader 4. It is designed to trade XAUUSD (Gold) on the 5-minute timeframe using an advanced algorithmic price engine and proprietary mathematical models . Unlike simple indicator-based robots, GOLGE GUARDIAN evaluates multiple market conditions before opening a trade. Every position is opened only after several technical filters a
RSI strategy EA MT4
Biswarup Banerjee
Présentation de Relative Strength Index(RSI) Strategy EA MT4, une solution de trading automatisée conçue exclusivement pour MetaTrader 4. Cet expert advisor utilise la puissance de l'Indice de Force Relative (RSI) pour exécuter des transactions basées sur des conditions de surachat et de survente, ce qui le rend idéal pour les traders cherchant à améliorer leurs stratégies de trading avec l'automatisation. Avec Relative Strength Index(RSI) Strategy EA MT4, les utilisateurs bénéficient de fonctio
PipFinite EA Breakout EDGE
Karlo Wilson Vendiola
5 (5)
The Official Automated Version of the Reliable Indicator PipFinite Breakout EDGE EA Breakout EDGE takes the signal of PipFinite Breakout EDGE indicator and manages the trade for you. Because of numerous financial instruments to consider, many traders want the signals to be fully automated. The EA will make sure all your trades are executed from entry to exit. Saving you time and effort while maximizing your profits. The Edge of Automation Effortless price action trading is now possible acros

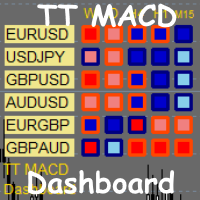
TT MACD Dashboard is multi-time frame and multi-currency market scanner. It is telling you the value of MACD and MACD histogram (a difference between MACD line and Signal line) in a form of small rectangle. If MACD value is above zero (MACD is bullish). Rectangle border color is bullish (Navy by default).  If MACD value is below zero (MACD is bearish). Rectangle border color is bearish (OrangeRed by default). If MACD histogram is rising and above zero (Bullish histogram). Rectangle color is bull
Crusher
Evgeniy Zhdan
The Expert Advisor uses the dissonance analysis strategy between the wave formation of the price movement of the lower level and the fractals of two consecutive upper levels. The data of the Stochastic indicator are confirmatory and decisive when making a decision to enter a transaction. Each trading position has a stop loss and take profit. Dangerous trading methods are not used. The Expert Advisor has a non-linear trailing stop system. Recommended trading tools for defaults: 15M: EURGBP, E
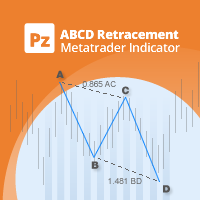
PZ ABCD Retracement
PZ TRADING SLU
4 (5)
Identify precise entry and exit points with AB=CD patterns This indicator finds AB=CD retracement patterns. The AB=CD Retracement pattern is a 4-point price structure where the initial price segment is partially retraced and followed by an equidistant move from the completion of the pullback, and is the basic foundation for all harmonic patterns. [ Installation Guide | Update Guide | Troubleshooting | FAQ | All Products   ] Customizable pattern sizes Customizable AC and BD ratios Customizable b
Les acheteurs de ce produit ont également acheté
Currency Strength Wizard est un indicateur très puissant qui vous offre une solution tout-en-un pour un trading réussi. L'indicateur calcule la puissance de telle ou telle paire de devises en utilisant les données de toutes les devises sur plusieurs périodes. Ces données sont représentées sous la forme d'un indice de devise facile à utiliser et de lignes électriques de devise que vous pouvez utiliser pour voir la puissance de telle ou telle devise. Tout ce dont vous avez besoin est d'attacher l'
Trend SniperX MT4
Sarvarbek Abduvoxobov
5 (6)
Trend Sniper X est un indicateur de suivi de tendance multi-temporalité pour MetaTrader 5 qui aide les traders à identifier la direction de la tendance et les points de retournement potentiels avec clarté et précision. Pour MT5 : https://www.mql5.com/en/market/product/181101 Information sur le prix : Le prix actuel est une offre promotionnelle et peut évoluer au fur et à mesure de la sortie des prochaines mises à jour et nouvelles fonctionnalités. Canal Code2Profit Maîtrisez le marché grâce à l'
M1 Sniper
Oleg Rodin
4.97 (30)
M1 SNIPER est un système d'indicateurs de trading facile à utiliser. Il s'agit d'un indicateur à flèche conçu pour l'unité de temps M1. Cet indicateur peut être utilisé seul pour le scalping sur l'unité de temps M1 ou intégré à votre système de trading existant. Bien que conçu spécifiquement pour le trading sur l'unité de temps M1, ce système peut également être utilisé avec d'autres unités de temps. Initialement, j'avais conçu cette méthode pour le trading du XAUUSD et du BTCUSD. Cependant, je
Smart Trend Trading System est un indicateur pour MetaTrader 4 qui réunit les informations de tendance, les signaux d’entrée et de sortie et les niveaux de prix sur un même graphique. Il combine plus de 10 outils de trading en un seul système, incluant la détection de tendance, les zones de retournement, Smart Cloud, la logique de trailing stop, le support et la résistance, la coloration des bougies, les alertes et l’analyse multi-timeframe. Le système est conçu pour vous aider à trader différen
SIO Oscillator : oscillateur auto-optimisé de déséquilibre de semi-variance Achetez l’indicateur et recevez GRATUITEMENT l’Expert Advisor (EA) basé sur celui-ci. La plupart des oscillateurs traitent tous les mouvements de prix de la même manière. SIO sépare la pression haussière de la pression baissière et mesure le déséquilibre entre les deux, montrant quel camp contrôle réellement le marché : les acheteurs ou les vendeurs. Lorsque le déséquilibre atteint un extrême, SIO génère un signal clair
Advanced Supply Demand
Bernhard Schweigert
4.91 (302)
Offre spéciale : 30 % de réduction La solution idéale pour les traders débutants comme experts ! Cet indicateur est un outil de trading unique, performant et abordable grâce à l’intégration de nombreuses fonctionnalités exclusives et d’une nouvelle formule. Cette mise à jour vous permet d’afficher des zones sur deux unités de temps. Vous pourrez ainsi visualiser non seulement une unité de temps supérieure, mais aussi l’unité de temps du graphique, ainsi que l’unité de temps supérieure : des z
Non repaint MT4
Yan Zhen Du
5 (2)
This is a professional chart indicator designed for traders focused on stability and clear price action. It helps filter market noise and provides clear visual entry and exit zones for your trading decisions. Price Information: The current price is promotional and is subject to change as upcoming updates and new features are released. MQL5 public channel:  CLICK HERE for MT5:  Non-repainting MT5 version Core Features: Strictly Non-Repainting: The system is built with strict non-repaint logic. W
Gann Made Easy
Oleg Rodin
4.84 (174)
Gann Made Easy est un système de trading Forex professionnel et facile à utiliser qui est basé sur les meilleurs principes de trading en utilisant la théorie de mr. WD Gann. L'indicateur fournit des signaux d'ACHAT et de VENTE précis, y compris les niveaux Stop Loss et Take Profit. Vous pouvez échanger même en déplacement en utilisant les notifications PUSH. VEUILLEZ ME CONTACTER APRÈS L'ACHAT POUR RECEVOIR GRATUITEMENT DES INSTRUCTIONS DE TRADING ET D'EXCELLENTS INDICATEURS SUPPLÉMENTAIRES! Vou
Cet indicateur est un indicateur d'analyse automatique des vagues, parfait pour le trading pratique ! Cas... Remarque :   je n'ai pas l'habitude d'utiliser des noms occidentaux pour l'évaluation des vagues. En raison de l'influence de la convention de dénomination de Tang Lun (Tang Zhong Shuo Zen), j'ai nommé la vague de base comme   un stylo   et la bande d'onde secondaire comme   un segment   . en même temps, le segment a la direction de la tendance.Le   segment de tendance principal   est no
Actuellement 30% de réduction ! La meilleure solution pour tout débutant ou trader expert ! Ce logiciel de tableau de bord fonctionne sur 28 paires de devises. Il est basé sur 2 de nos principaux indicateurs (Advanced Currency Strength 28 et Advanced Currency Impulse). Il donne un excellent aperçu de l'ensemble du marché Forex. Il montre les valeurs de l'Advanced Currency Strength, la vitesse de mouvement des devises et les signaux pour 28 paires de devises dans tous les (9) délais. Imaginez
Liquidity Scalper System : un système de trading basé sur la liquidité au format indicateur. La plupart des indicateurs n'affichent qu'une flèche, puis le trader décide seul où placer le stop, où se trouve l'objectif et s'il peut faire confiance au signal. Liquidity Scalper System couvre tout le cycle du trade : il trouve les pools de liquidité, donne un signal lors de leur cassure, calcule immédiatement Entry, Stop Loss et trois objectifs, et affiche sur le panneau les statistiques et les résu
Scalper Vault
Oleg Rodin
4.9 (41)
Scalper Vault est un système de trading puissant et complet, conçu pour les traders en quête de régularité dans le cadre du trading intrajournalier. Cet indicateur de haute précision constitue un système de trading autonome et exhaustif, offrant des analyses de qualité institutionnelle, aussi bien pour le Forex que pour les options binaires. VEUILLEZ ME CONTACTER APRÈS VOTRE ACHAT POUR OBTENIR MES CONSEILS DE TRADING AINSI QU'UN EXCELLENT BONUS ! En éliminant les incertitudes et les analyses ma
Nous vous présentons ON Trade Waves Patterns Harmonic Elliot Wolfe, un indicateur avancé conçu pour détecter divers types de schémas sur le marché à l'aide de méthodes manuelles et automatiques. Voici comment il fonctionne : Schémas Harmoniques : Cet indicateur peut identifier les schémas harmoniques qui apparaissent sur votre graphique. Ces schémas sont essentiels pour les traders qui pratiquent la théorie du trading harmonique, telle qu'elle est décrite dans le livre de Scott Carney "Harmonic
Zoryk Gold mt4
Reda El Koutbane
5 (4)
ZORYK — Système avancé de signaux et de planification pour XAUUSD sur MetaTrader 4 Vous connaissez probablement cette situation. Vous analysez l’or, attendez l’entrée, puis ouvrez enfin la position. Le prix part immédiatement contre vous. Vous fermez trop tôt, déplacez le Stop Loss ou hésitez quelques secondes. Peu après, le marché atteint exactement la direction et l’objectif que vous aviez prévus, mais sans vous. Le problème n’était pas toujours la direction. Le véritable problème était l
RFI levels PRO
Roman Podpora
5 (2)
L'indicateur montre avec précision les points de retournement et les zones de retour des prix où le       Acteurs majeurs   . Vous repérez les nouvelles tendances et prenez des décisions avec une précision maximale, en gardant le contrôle de chaque transaction. VERSION MT5     -     Révèle son potentiel maximal lorsqu'il est combiné à l'indicateur   TREND LINES PRO Ce que l'indicateur montre : Structures et niveaux d'inversion avec activation au début d'une nouvelle tendance. Affichage des nive
Atomic Analyst
Issam Kassas
5 (14)
Atomic Analyst — MetaTrader 4 Pour toute question sur le produit, sa configuration ou le support technique, envoyez-moi un message directement ici sur MQL5. L’indicateur transforme des calculs complexes du marché en signaux visuels simples, bougies colorées, lectures de tendance, niveaux de stop-loss et plusieurs zones de take-profit que les traders peuvent comprendre rapidement et utiliser dans des conditions réelles de marché. Principales utilisations de trading : Scalping et trading intraday
ShapeRadar - indicateur de figures chartistes classiques ShapeRadar repère automatiquement sur le graphique les figures classiques de l’analyse technique : doubles et triples sommets et creux, tête et épaules et sa version inversée, biseaux ascendants et descendants, rectangles, triangles, drapeaux et fanions. Lorsque le prix clôture au-delà de la limite d’une figure, l’indicateur trace la figure, le point d’entrée, le niveau de stop loss et l’objectif, et un panneau d’information résume toutes
Le système PRO Renko est un système de trading très précis spécialement conçu pour le trading de graphiques RENKO. Il s'agit d'un système universel qui peut être appliqué à divers instruments de négociation. Le système neutralise efficacement ce qu'on appelle le bruit du marché en vous donnant accès à des signaux d'inversion précis. L'indicateur est très facile à utiliser et n'a qu'un seul paramètre responsable de la génération du signal. Vous pouvez facilement adapter l'outil à n'importe que
SR Liquidity
Oleg Rodin
5 (3)
SR Liquidity est un indicateur de trading conçu pour révéler les zones cachées où se concentre la liquidité du marché et où le prix réagit avec le plus d'intensité. Ces zones de liquidité spécifiques agissent comme de puissants niveaux de support et de résistance, vous offrant une cartographie claire des points où le marché est le plus susceptible de se retourner. Plutôt que de tracer des lignes de support et de résistance classiques, l'indicateur SR Liquidity analyse le comportement réel des pr
Auto Optimized SpeedAngle est un système de vectorisation du momentum de niveau institutionnel qui élimine l'ajustement de courbe ( curve-fitting ) grâce à une optimisation continue par avancement ( Walk-Forward Optimization , WFO). Plutôt que de s'appuyer sur des entrées statiques qui se dégradent lorsque les régimes de marché changent, l'indicateur recalibre dynamiquement ses paramètres en utilisant une validation hors échantillon ( Out-of-Sample , OOS), garantissant ainsi que les signaux affi
Italo Volume Indicator
Italo Santana Gomes
4.92 (79)
BUY INDICATOR AND GET EA FOR FREE AS A BONUS + SOME OTHER GIFTS! ITALO VOLUME INDICATOR  is the best volume indicator ever created, and why is that? The Indicator works on all time-frames and assets, indicator built after 7 years of experience on forex and many other markets. You know many volume indicators around the internet are not complete, does not help, and it's difficult to trade, but the Italo Volume Indicator is different , the Italo Volume Indicator shows the wave volume, when market
Il estime le mouvement de prix le plus probable à court terme à partir de calculs mathématiques avancés. Caractéristiques Estimation du mouvement immédiat du prix sur l'unité de temps du graphique et sur toutes les unités supérieures ; Calcul de la tendance réelle du marché ; Calcul des niveaux de support et de résistance les plus importants ; Alertes sur les zones de congestion, les croisements de niveaux et les changements de tendance ; Léger pour les ressources du système : les lignes et le
Route Lines Prices
Vitalyi Belyh
3 (1)
Route Lines Prices - est un indicateur conçu pour identifier les directions des prix. Son interface simple intègre plusieurs algorithmes de calcul du comportement des prix et de leur direction future. Ces algorithmes incluent le calcul de la volatilité et le lissage des prix en fonction des unités de temps utilisées. L'indicateur possède un unique paramètre permettant de modifier la valeur « Calculating price values ». La valeur par défaut de 1 assure un calcul automatique équilibré, utilisabl
All in One package includes the  Oscillator Predictor ,  MACD Predictor ,  Thrust Scanner  and  Advanced Fibonacci  indicators which are mandatory for applying  Dinapoli  trade plans.  Please visit below links for detailed explanations of indicators. Advanced Fibonacci Indicator =>  https://www.mql5.com/en/market/product/52834 Thrust Scanner Indicator => https://www.mql5.com/en/market/product/52830 Overbought /Oversold Predictor indicator => https://www.mql5.com/en/market/product/52621 Macd P
True Direction Oscillator
Muhammad Elbermawi
4.85 (364)
Ou (TDO) qui est un indice qui mesure le taux de variation des prix en utilisant le principe du « Pure Momentum ». Lorsque le prix d'un titre augmente de 10 à 15, le taux de variation du prix est de 150 %, mais lorsqu'il redescend de 15 à 10, le taux de variation du prix n'est que de 33,3 %. C'est pourquoi les indicateurs d'analyse technique tels que « Taux de variation des prix » (ROC) ou « Momentum » donnent des lectures plus élevées pour les mouvements de prix ascendants que ceux donnés aux m
Quantum Imbalance Profiles   est un indicateur des phases d'équilibre et de déséquilibre. Il montre à quels prix le marché a échangé du volume, quel camp a dominé dans cette zone et à travers quels niveaux le prix s'est ensuite étendu par impulsion. Un profil de volume classique répond à une seule question : où les échanges ont eu lieu. Il ne montre pas quel camp a dominé à chaque prix, comment la consolidation s'est terminée ni dans quelle direction le marché en est sorti. Quantum Imbalance Pro
Indicateur de trading manuel et d'analyse technique pour le Forex. Il se compose d'un indicateur de tendance avec le niveau d'ouverture du jour de bourse et d'un indicateur de flèche pour déterminer les points d'entrée. L'indicateur ne se recolore pas ; il fonctionne lorsque la bougie se ferme. Contient plusieurs types d'alertes pour les flèches de signalisation. Peut être configuré pour fonctionner sur n’importe quel graphique, instrument de trading ou période. La stratégie de travail est bas
Dark Support Resistance  is an Indicator for intraday trading. This Indicator is programmed to identify  Support and Resistance Lines , providing a high level of accuracy and reliability. Key benefits Easily visible lines Only the most important levels will be displayed Automated adjustment for each timeframe and instrument Easy to use even for beginners Never repaints, never backpaints, Not Lag 100% compatible with Expert Advisor development All types of alerts available: Pop-up, Email, Push
ACTUELLEMENT 40% DE RÉDUCTION ! ! La meilleure solution pour tout débutant ou Expert Trader ! Cet indicateur est un outil de trading unique, de haute qualité et abordable car nous avons incorporé un certain nombre de caractéristiques exclusives et une formule secrète. Avec seulement UN graphique, il donne des alertes pour les 28 paires de devises. Imaginez comment votre trading s'améliorera parce que vous serez capable de repérer le point de déclenchement exact d'une nouvelle tendance ou d'un
M1 Arrow Scalping - shows signals on the M1 period, does not redraw entry points and can work on all major currency pairs + metals (gold/silver). The indicator analyzes the market using algorithms for determining price patterns and shows the trader the price reversal points on the chart. The red dot shows that the price will turn down and the blue dot shows that the price will turn up. The indicator also sends signals to the phone in the form of PUSH notifications. Therefore, you do not need to
Plus de l'auteur
Overview MACD Signal with Multi Filters is an advanced technical analysis indicator engineered for MetaTrader 5 (MT5). The software combines the classic Moving Average Convergence Divergence (MACD) oscillator architecture with a modular 14-filter confirmation engine (MultiFilterSuite). It is developed to assist manual traders, quantitative analysts, and algorithmic system developers in identifying momentum shifts, trend continuations, and structural turning points while filtering out sideways ma
Parabolic SAR Multi-Filter System MT5: Algorithmic Trend Reversal Engine 1. PRODUCT OVERVIEW & OPERATIONAL ARCHITECTURE Parabolic SAR Multi-Filter System MT5 is a professional multi-component technical analysis indicator engineered for the MetaTrader 5 terminal. The indicator combines J. Welles Wilder's classic Parabolic Time/Price System with an advanced modular filtering architecture comprising 17 distinct secondary validation engines. The primary objective of this software is to eliminate f
Hull Trend Arrows MT5 with Multi-Filter Suite - Technical Documentation 1. Overview and Analytical Purpose Hull Trend Arrows MT5 with Multi-Filter Suite is an algorithmic technical indicator for MetaTrader 5. It integrates the low-lag calculation engine of the Hull Moving Average (HMA) with fourteen modular confirmation filters to identify directional momentum transitions, calculate inflection points, and display non-repainting entry signals on the chart. Standard moving averages introduce sign
FREE
HA Signal MultiFilter MT5 - Technical Operational Manual & Architecture Guide 1. SYSTEM OVERVIEW & ARCHITECTURAL FOUNDATION HA Signal MultiFilter MT5 is a specialized analytical indicator developed for MetaTrader 5 terminal to identify directional momentum expansions and structural trend continuations[cite: 2]. By synthesizing smoothed Heiken Ashi candlestick price discovery with a modular 15-layer secondary confirmation filter suite, the system extracts high-probability market shifts while fil
FREE
Product Overview: Relative Vigor Index Multi-Filter Technical System The Relative Vigor Index (RVI) Multi-Filter Indicator is a comprehensive technical analysis engine developed for the MetaTrader 5 terminal. Designed to identify cyclical momentum shifts, trend continuations, and structural market turning points, this analytical system couples the classic Relative Vigor Index formula with an advanced multi-layered confirmation matrix consisting of 17 distinct technical filters. Rather than rely
FREE
1. OVERVIEW Harmonic Dashboard is a specialized multi-symbol and multi-timeframe analytical indicator designed for MetaTrader 5 (MT5). The software systematically scans financial instruments across multiple timeframes to identify six classical harmonic chart patterns: Gartley, Bat, Butterfly, Crab, Cypher, and Shark. The application consolidates multi-asset scanner results, trend filter validation metrics, price level projections, and interactive chart navigation controls into a single graphic
Overview The MA Cross Scanner Pro is an advanced, highly optimized multi-symbol and multi-timeframe analytical dashboard engineered specifically for the MetaTrader 5 terminal. Designed for technical analysts, systemic traders, and quantitative researchers, this utility serves as a comprehensive market surveillance engine. Its primary objective is to continuously monitor a customized array of financial instruments across numerous timeframes simultaneously, detecting precise moving average crosso
CCI MultiFilter Overbought Oversold Signal Pro MT5 Technical Specification & Operational Manual  1. Overview and System Identity CCI MultiFilter Overbought Oversold Signal Pro MT5 is an institutional-grade technical analysis indicator engineered natively for MetaTrader 5. Developed for quantitative analysts, systematic manual traders, and multi-asset operators, the system provides an objective algorithmic framework to identify cyclical market extremes, momentum shifts, and structural trend cont
WPR Williams Percent Range All Pair Timeframe Scanner Dashboard Overview WPR Scanner Dashboard Pro is a multi-symbol, multi-timeframe market scanning indicator and visual chart overlay utility built for MetaTrader 4 (MT4). The tool monitors Williams Percent Range (WPR) momentum exhaustion and threshold breakouts across multiple currency pairs, metals, indices, and CFDs simultaneously from a single chart window. In addition to its core WPR detection engine, the indicator incorporates an optiona
WAE Waddah Attar Explosion Multi Pair TimeFrame Scanner 1. Overview - WAE Scanner Dashboard is a technical analysis indicator and multi-symbol, multi-timeframe market scanner built for MetaTrader 4 (MT4). - It automates multi-chart monitoring by scanning volatility-driven momentum breakouts based on the Waddah Attar Explosion (WAE) methodology across multiple currency pairs, crosses, indices, or metals simultaneously. - Candidate signals are processed through a modular 15-filter technical conf
UT Bot Trend Multi Pair Timeframe Scan Dashboard Overview UT Bot Scanner Dashboard is a multi-pair and multi-timeframe technical indicator and market scanner developed natively for MetaTrader 4 (MT4). It continuously monitors selected Forex pairs, precious metals, indices, or active Market Watch symbols across multiple timeframes simultaneously to detect dynamic Average True Range (ATR) volatility trailing stop crossovers. Instead of manually cycling through dozens of individual charts to monit
TDI Traders Dynamic Index RSI Scanner All Pair TF Overview TDI & RSI Dynamic Line Dashboard Scanner is a multi-symbol and multi-timeframe analytical indicator designed for MetaTrader 4. The tool monitors multiple currency pairs, commodities, or indices across selected chart timeframes simultaneously to detect crossover events derived from the Traders Dynamic Index (TDI) and dual Relative Strength Index (RSI) Dynamic Lines. Every detected signal is evaluated against an optional 15-module technica
Stochastic Scanner Dashboard for MetaTrader 4 Stochastic Overbought Oversold Scanner Dashboard All Pair Time frame Overview - Stochastic Scanner Dashboard is a multi-symbol and multi-timeframe technical analysis indicator and market scanner built for MetaTrader 4 (MT4). - The tool continuously monitors user-defined currency pairs, metals, or Market Watch symbols across multiple timeframes from one chart. - It detects momentum shifts using configurable Stochastic Oscillator strategies and valida
SSL Channel Trend Scanner Dashboard Multi Pair Multi TimeFrame Overview SSL Channel Multi-Filter Dashboard is a technical analysis indicator and multi-symbol, multi-timeframe market scanner built for MetaTrader 4. It continuously monitors multiple currency pairs, commodities, or other broker instruments across user-selected timeframes to detect directional channel crossovers confirmed by an optional 15-module technical filter suite. Validated signals are organized in an interactive on-chart dash
Relative Vigor Index RVI All Pair and Timeframe Scanner Dashboard Overview RVI Scanner Dashboard is a multi-pair and multi-timeframe technical indicator and interactive scanner panel for MetaTrader 4 (MT4). Built around the Relative Vigor Index (RVI) oscillator, it continuously monitors multiple currency pairs, commodities, or indices across selected timeframes from one chart window. The tool detects directional momentum crossovers, validates setups through an optional 15-module technical conf
RSI Parabolic Overbought Oversold Multi pair Timeframe Scanner 1. Overview - RSI Parabolic Scanner Dashboard is a multi-symbol, multi-timeframe technical analysis indicator and real-time market scanner engineered for MetaTrader 4 (MT4). - It continuously monitors user-defined currency pairs, metals, or visible Market Watch instruments across multiple chart timeframes to identify momentum reversals and overbought or oversold market conditions. - The indicator combines two selectable RSI-based si
RSI Divergence Multi Pair Timeframe Scan Dashboard Overview - Product Type: Multi-symbol, multi-timeframe technical analysis indicator and interactive market dashboard scanner for MetaTrader 4 (MT4). - Core Purpose: Continuously monitors configured currency pairs, precious metals, indices, or active Market Watch symbols across multiple chart timeframes simultaneously to identify Regular and Hidden Relative Strength Index (RSI) divergence setups in one unified terminal window. - Structured Trade
Overview - Product Identity: Pola MultiCandle Scanner Dashboard is a multi-pair and multi-timeframe technical analysis indicator and market scanner developed for MetaTrader 4 (MT4). - Core Purpose: Continuously monitors user-defined currency pairs, precious metals, or Market Watch instruments across multiple timeframes to detect structured multi-candle price action formations, validate setups through a modular 15-indicator confluence suite, calculate volatility-adjusted Stop Loss (SL) and dual
MACD Signal Trend Cross Scanner All Pair Dashboard Overview MACD Scanner Dashboard is a technical analysis utility and multi-symbol, multi-timeframe dashboard indicator designed for MetaTrader 4[cite: 1]. Its primary objective is to monitor MACD crossover events across multiple currency pairs and chart timeframes simultaneously from a single active chart window[cite: 1]. Instead of manually switching between dozens of charts, traders can observe real-time market momentum, directional bias, calc
MA Moving Average Cross Scanner All Pair Timeframe Dashboard Overview MA Cross Scanner is an analytical multi-symbol and multi-timeframe technical indicator equipped with an interactive on-chart dashboard panel for MetaTrader 4[cite: 1]. The tool is engineered to monitor Moving Average (MA) crossover events across multiple currency pairs and timeframes simultaneously, consolidating signal detection, modular trend/momentum filtering, and Average True Range (ATR) risk-reward level calculations in
Ichimoku Tenkan Kijun Cross Scanner All Pair TimeFrame Overview TK Cross Scanner Dashboard is a technical analysis indicator and multi-asset market scanner engineered for the MetaTrader 4 platform. The utility monitors multiple currency pairs, commodities, and timeframes simultaneously to detect Ichimoku Tenkan-sen and Kijun-sen crossovers (TK Cross). In addition to automated signal scanning, the software calculates dynamic Stop Loss (SL) and dual Take Profit (TP1 and TP2) reference levels usin
Ichimoku Senkou Span B Scanner All Pair Timeframe Overview Senkou Span B Scanner Dashboard MT4 is a technical analysis indicator and multi-asset market scanner designed for MetaTrader 4. The tool monitors multiple currency pairs, commodities, and timeframes simultaneously from a single chart window to detect price interactions with the Ichimoku Kinko Hyo Senkou Span B boundary. In addition to scanning for signal candidates, the indicator integrates a 15-module secondary confirmation suite, calc
Heiken Ashi Multi Currency Pair Time Frame Scan Dashboard Overview Heiken Ashi Multi Timeframe Scanner Dashboard is a technical analysis utility and multi-symbol, multi-timeframe market scanner developed for the MetaTrader 4 platform. The tool is designed to monitor multiple currency pairs, commodities, or indices simultaneously from a single chart window. Instead of manually switching between dozens of charts and timeframes to inspect Heiken Ashi candle formations, traders can view active dire
Pro Harmonic Pattern Scanner All Pair Time Frame Dashboard Harmonic Pattern Scanner Dashboard MT4 is an analytical multi-symbol and multi-timeframe technical indicator designed for MetaTrader 4. It automatically scans price action across selected currency pairs, metals, or Market Watch instruments to identify classic XABCD harmonic structures, calculate Fibonacci-based entry, Stop Loss, and Take Profit zones, and validate setups through an integrated modular trend and momentum filter suite. Op
Fractal Breakout Scanner Multi Pair Timeframe Dashboard Overview Fractal Breakout Scanner Dashboard is a technical analysis indicator and multi-symbol, multi-timeframe scanning utility designed for MetaTrader 4. The tool monitors multiple currency pairs, commodities, and indices simultaneously to detect price breakouts beyond confirmed Bill Williams Fractal swing highs and swing lows. Rather than requiring manual chart switching across dozens of instruments, the indicator aggregates real-time b
Institutional Candle Price Engulfing Scan All Pair Timeframe Engulfing Scanner Dashboard is a technical analysis utility and multi-symbol, multi-timeframe candlestick pattern scanner for MetaTrader 4. It detects Bullish Engulfing and Bearish Engulfing setups across multiple currency pairs and timeframes simultaneously, displaying active signals in an interactive on-chart table alongside ATR-based Stop Loss and Take Profit reference levels. 1. Overview and Technical Purpose - Product Category:
Pinbar Marubozu Rejection Candlestick Scanner All Pair Timeframe Overview Candle Pattern Scanner Dashboard is a technical analysis utility and multi-pair, multi-timeframe scanner indicator designed for MetaTrader 4. The indicator continuously monitors multiple currency pairs, commodities, or indices across selected timeframes to detect specific Japanese candlestick price action formations—namely Candle Rejection, Full-Body Marubozu, and Classic Pin Bar structures. When a valid candlestick forma
Chaikin Oscillator Scanner All Pair Timeframe Dashboard Overview Chaikin Oscillator Scanner Dashboard is a technical analysis utility and multi-symbol, multi-timeframe market scanner designed for MetaTrader 4 (MT4)[cite: 1]. The indicator monitors multiple currency pairs, commodities, or indices simultaneously across selected chart timeframes to identify Chaikin Oscillator zero-line crossover events[cite: 1]. Detected setups are presented in an interactive on-chart table complete with automated
CCI Signal Trend Overbought Oversold Scanner All Pair TimeFrame Dashboard CCI Multi Timeframe Scanner Dashboard is a technical analysis utility and multi-symbol market scanner developed for MetaTrader 4. The indicator monitors multiple currency pairs and timeframes simultaneously using Commodity Channel Index (CCI) calculations combined with an optional multi-indicator confirmation suite and Average True Range (ATR) volatility projections. 1. Operating Principle and Signal Validity - Core Cal
BB Bollinger Bands Breakout Scanner All Pair Time Frame Bollinger Bands Breakout Scanner Dashboard is a technical analysis utility and multi-symbol, multi-timeframe market scanner engineered for MetaTrader 4 (MT4). The software continuously monitors multiple currency pairs, commodities, or indices across user-defined timeframes to detect confirmed Bollinger Bands breakout setups. Every detected signal is evaluated through an optional modular confirmation suite and automatically paired with vola
Filtrer:
Aucun avis
Répondre à l'avis