Cumulative Delta and Divergence
- 指标
- 版本: 1.1

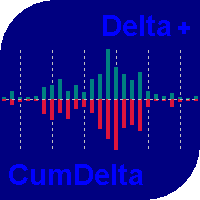
Cumulative volume delta drawn as candles in its own window, estimated from lower-timeframe volume (works on forex, gold and indices), with reset options, an average line and non-repainting price/delta divergence arrows and alerts.
Cumulative Delta and Divergence shows the running balance between estimated buying and selling volume, so you can compare it with price. It is built to work on every broker and symbol, including forex, gold and indices where no exchange order flow is available.
What you see
- Cumulative delta (CVD) in its own window, drawn as candles. Each candle follows the path of the delta inside the bar, so its high and low show how far the balance swung during the bar.
- Optional average line of the cumulative delta.
- A switch to plain delta bars (delta of each candle) if you prefer.
- Reset options: never, each day, each week or each month.
- Divergence marks: when price makes a higher high but cumulative delta makes a lower high (bearish), or price makes a lower low but delta makes a higher low (bullish), the indicator draws an arrow and a line between the two pivots. Alerts are available.
- A small readout: delta of the current bar, share of estimated buy volume, and the cumulative value.
How the delta is estimated
This is an estimate, not order book data. For each candle the indicator reads the lower timeframe bars inside it (for example M1 bars inside an M15 candle). Each lower bar's volume is split between buyers and sellers according to where it closed in its range (default), or by its body, or by its direction only. The signed volumes are added up. Tick volume is used on forex and CFDs; real volume is used automatically when your broker provides it (you can force either). The estimate shows where activity leaned, but it is not the real traded volume at the bid or ask.
No repainting of divergences
Pivots are confirmed only after the chosen number of bars has closed on each side, so a divergence mark appears with that delay and then stays. The current candle's delta updates until it closes.
Inputs
- Delta estimate: method, volume source, bars calculated.
- Display: cumulative candles or delta bars, reset period, average length.
- Divergence: on/off, pivot strength, maximum distance between pivots, lines and colours.
- Alerts: pop-up, sound, push.
- Label: on/off, size, colour, footer line on/off.
Notes
- The delta path inside each bar is read automatically from a lower timeframe, so history for that timeframe must be available; the indicator falls back to the chart bars when it is not.
- Colours and line styles of the plots can be changed in the Colors tab.
- This indicator does not open, modify or close trades. It is an analysis tool and not financial advice. Past behaviour of price does not guarantee future results.
Questions and suggestions are welcome in the comments section of this product.