RBR Catalyst Map
- 指标
- 版本: 1.0

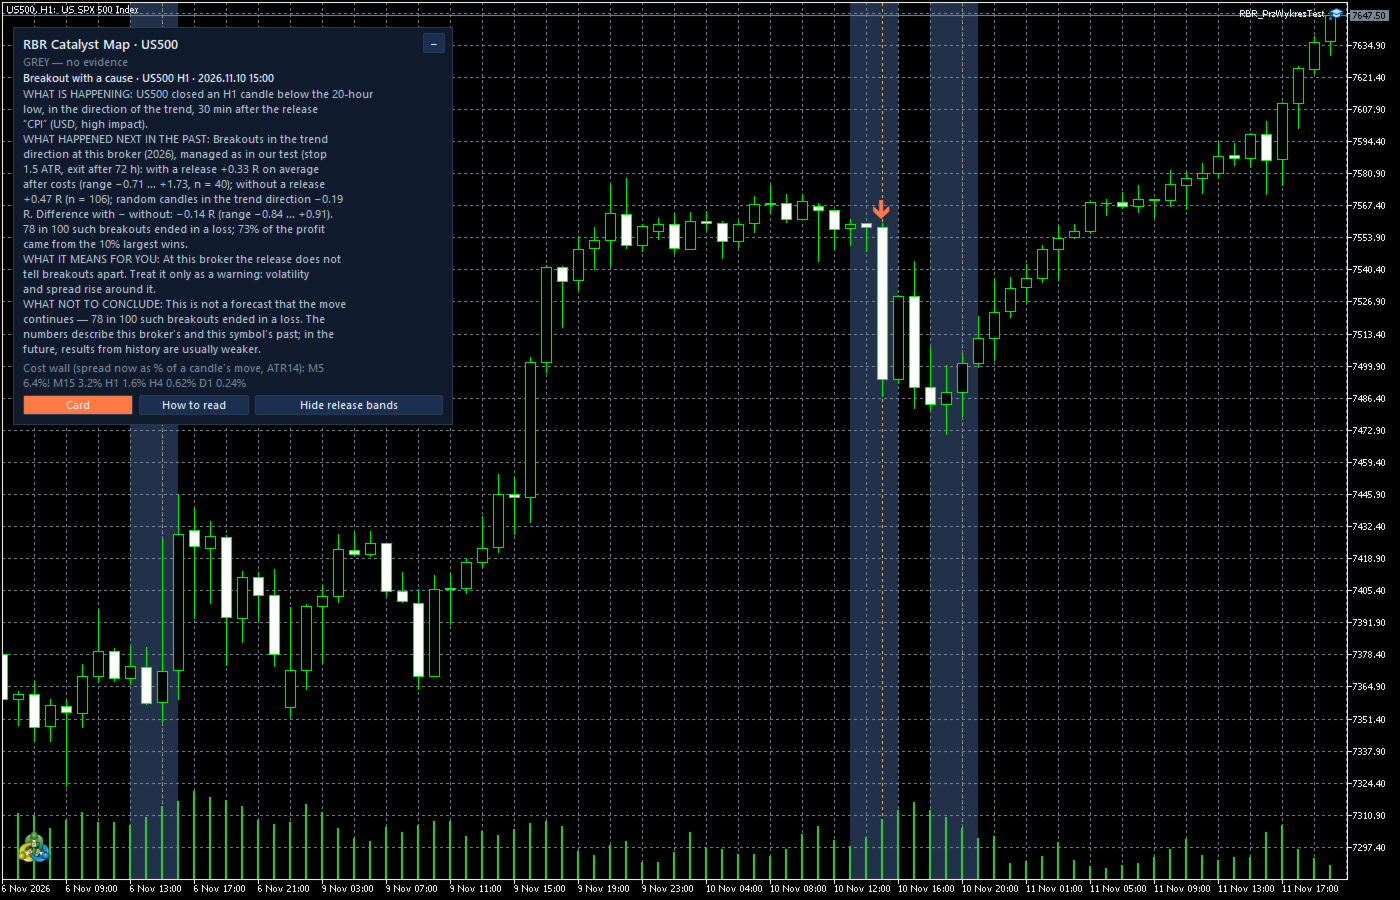
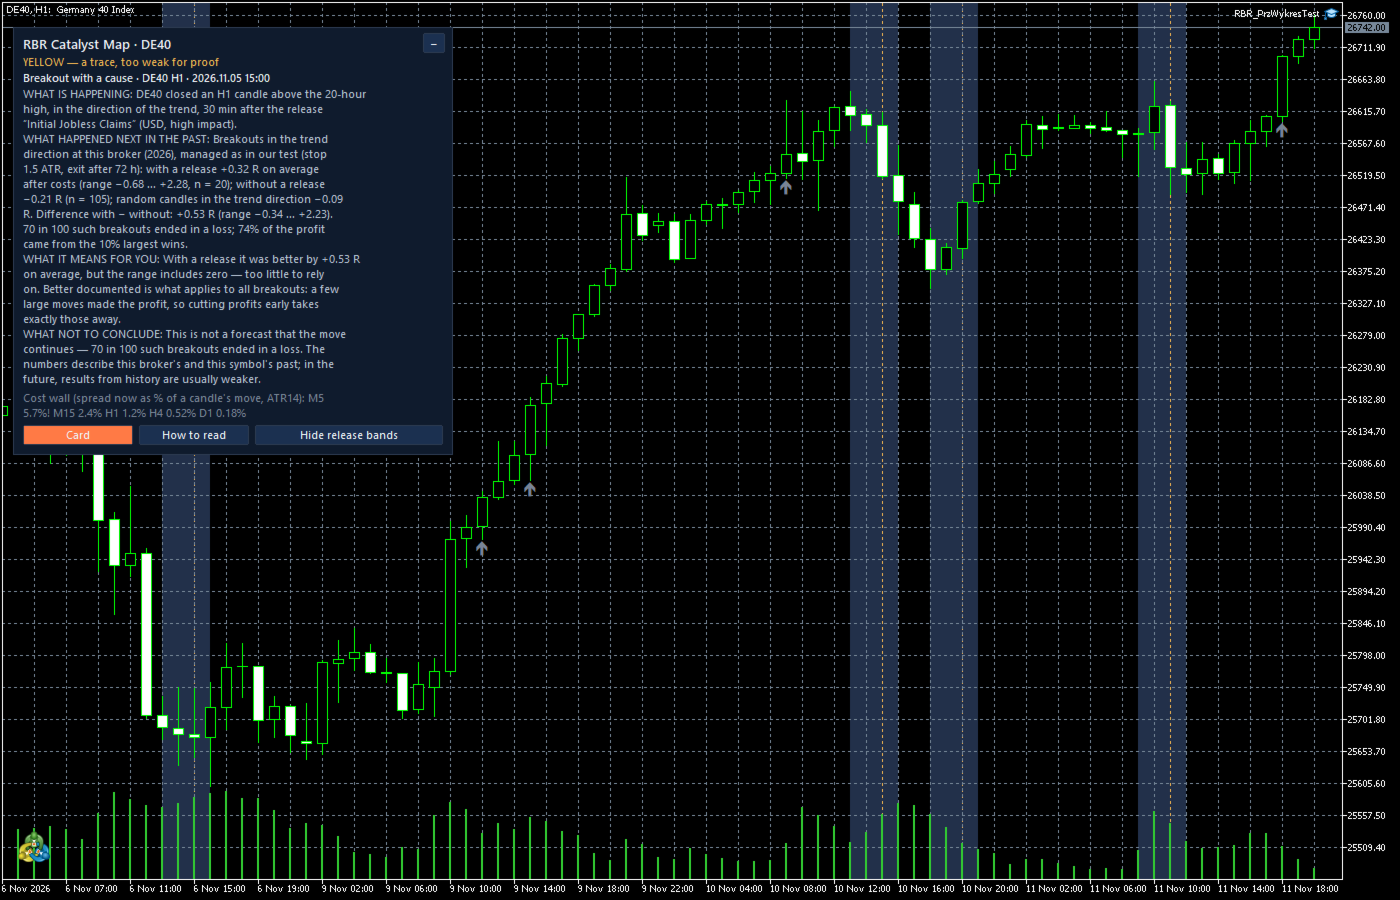
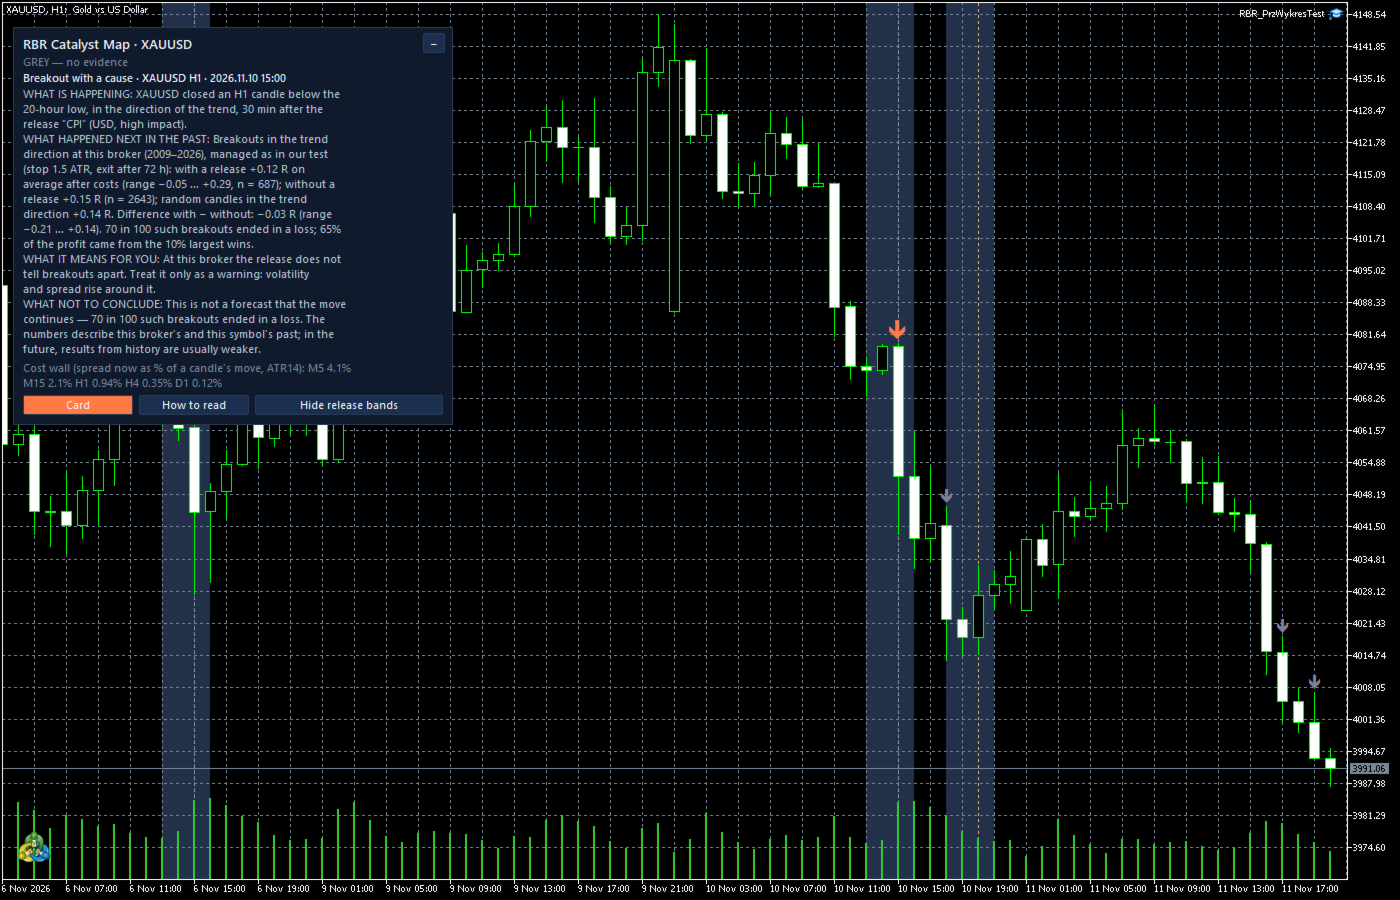
RBR Catalyst Map marks two things on the chart: the time windows around high-impact macro releases for the currency of the symbol, and H1 breakouts of a 20-candle channel in the direction of the trend. Each breakout is labelled as "with a cause" (a high-impact release for the symbol currency within 2 hours before to 1 hour after the candle) or "without a cause". Labels are placed only on closed candles and are not repainted.
The situation card
Click an arrow to open the situation card. The card has four parts:
- What is happening: the symbol, the candle, the release and its time.
- What happened next on this broker: the average result of such breakouts managed with a fixed rule (stop 1.5 x ATR(14), exit after 72 hours, spread included), in R, with a range and the number of cases; the same for breakouts without a release and for random candles in the trend direction, for comparison.
- What it means for you: practical notes, without trade instructions.
- What not to conclude: for example, that most single breakouts still end in a loss.
The colour of the card shows how strong the evidence is on your data: green when the difference between breakouts with and without a release is outside the random range and there are at least 100 cases, yellow when the direction matches our earlier tests but the evidence is weak, grey when there is no evidence. All numbers are computed locally from your terminal's history for the symbol on the chart. They describe the past and are not a forecast.
Scope: the effect was observed on stock indices. For currencies and commodities we did not find it, and the panel says so instead of showing a coloured card.
Cost wall: the current spread as a percentage of the ATR of the chart timeframe, and the timeframe from which the cost falls below 1 percent of the ATR.
Buffers: four buffers (breakout with cause up / down, without cause up / down) for use in other tools via iCustom.
Notes
The macro calendar comes from the MetaTrader 5 terminal. The Strategy Tester has no calendar, so in the tester the indicator shows no release windows; use it on a live chart. The first computation on a symbol can take a few seconds while H1, H4 and D1 history loads. The panel follows the terminal language (English, Polish, German), can be moved and collapsed. The indicator sends no orders and no data.
Inputs
Days of history to mark on the chart (default 20).