RBR Strategy Lab
- 实用工具
- 版本: 2.3
- 激活: 10

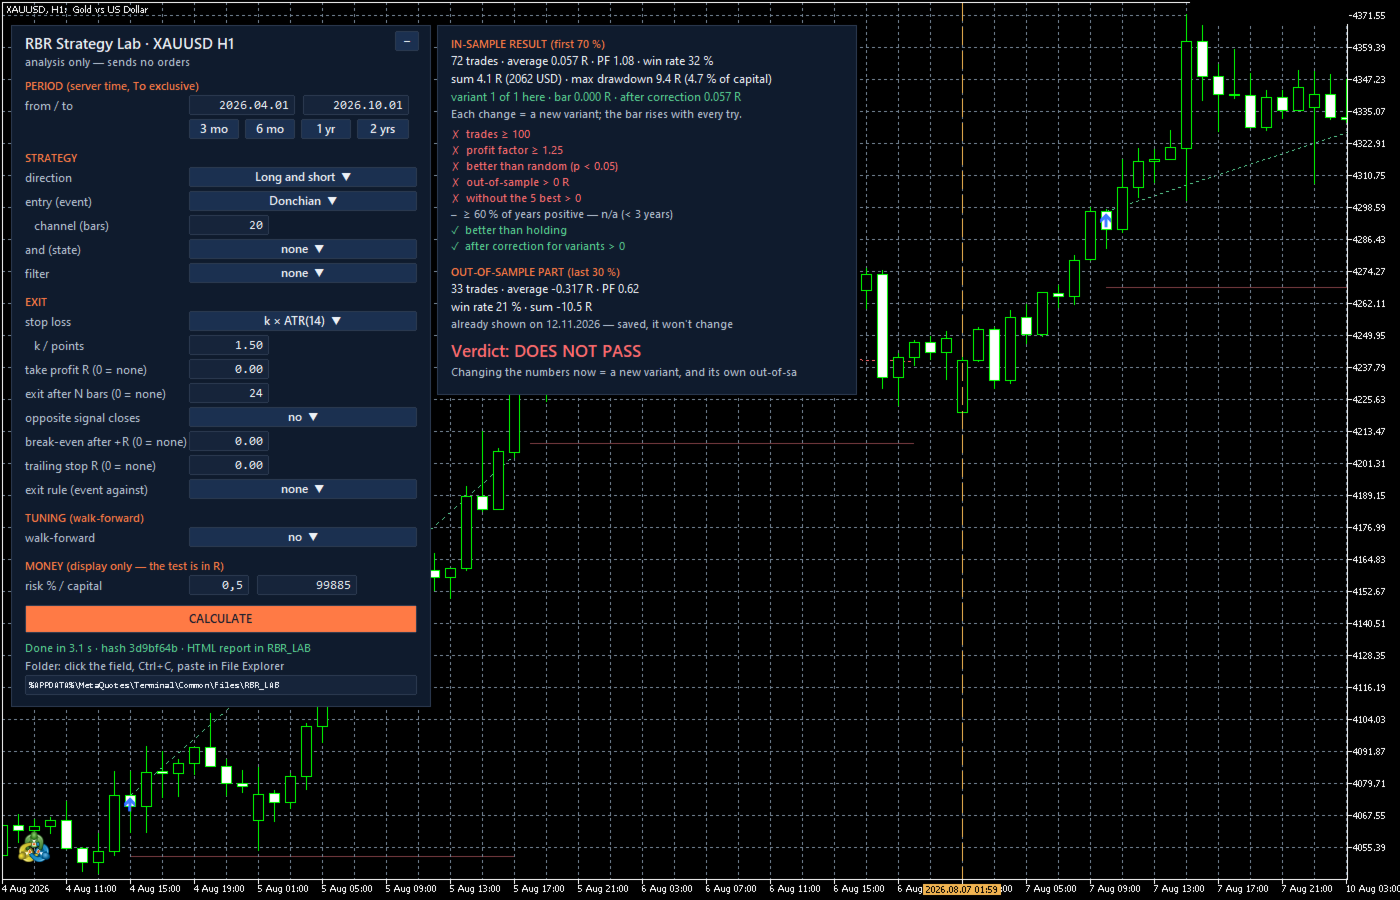
RBR Strategy Lab tests a trading strategy that you write down before you see any result, and tells you whether it holds up outside the data it was built on. You build the strategy from ready-made blocks in a panel on the chart or in the Strategy Tester inputs. The Lab freezes it, tests it on real ticks with your account's costs, compares it with random entries and with holding the market, and shows the last 30 % of the data only once. Most strategies will not pass, and that is what the tool is for. The Lab sends no orders: trades are simulated in code.
What it does differently from an ordinary tester
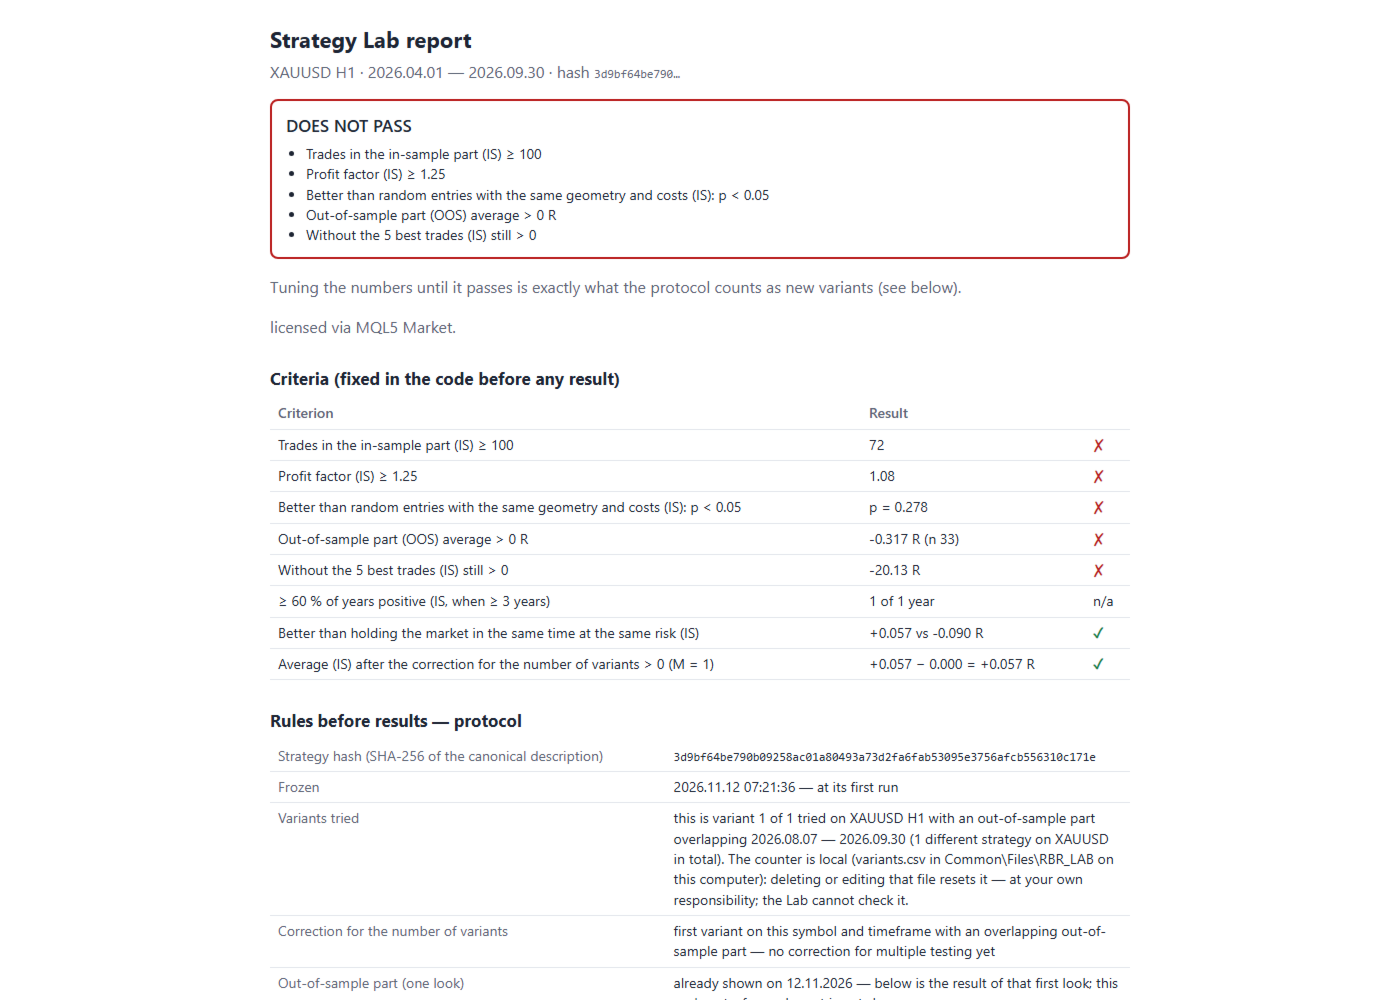
- Rules before results: before the first run the Lab saves the strategy description, its SHA-256 hash and the date. Changing one number makes a new strategy, not a fix.
- Panel on the chart: pick the blocks from lists and press CALCULATE. Trades are drawn on the chart with the verdict and the criteria. It uses the same M1 candles from real ticks as the Strategy Tester, so the result is the same.
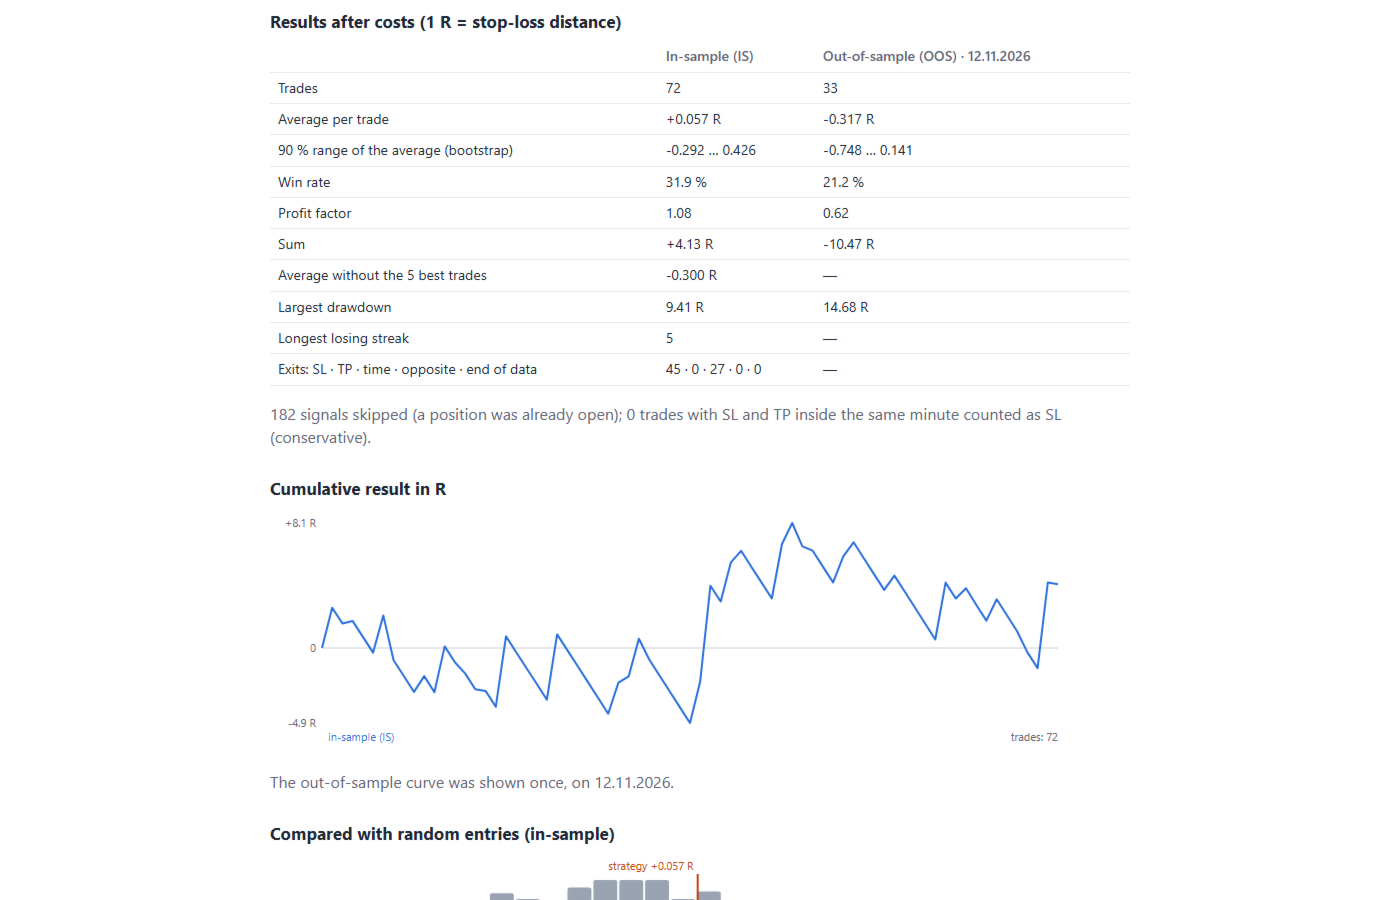
- One out-of-sample check: the last 30 % of the period. Its result for a given strategy is shown once; later runs show the same saved result.
- Attempt counter: every new version on the same symbol and timeframe whose check overlaps earlier checks counts as another attempt, and the average is corrected for how much the best of several attempts looks better by luck alone.
- Costs from ticks and your account: entries and exits at the real ASK and BID of every test minute; commission and broker markup measured from your trade history; swap from the symbol.
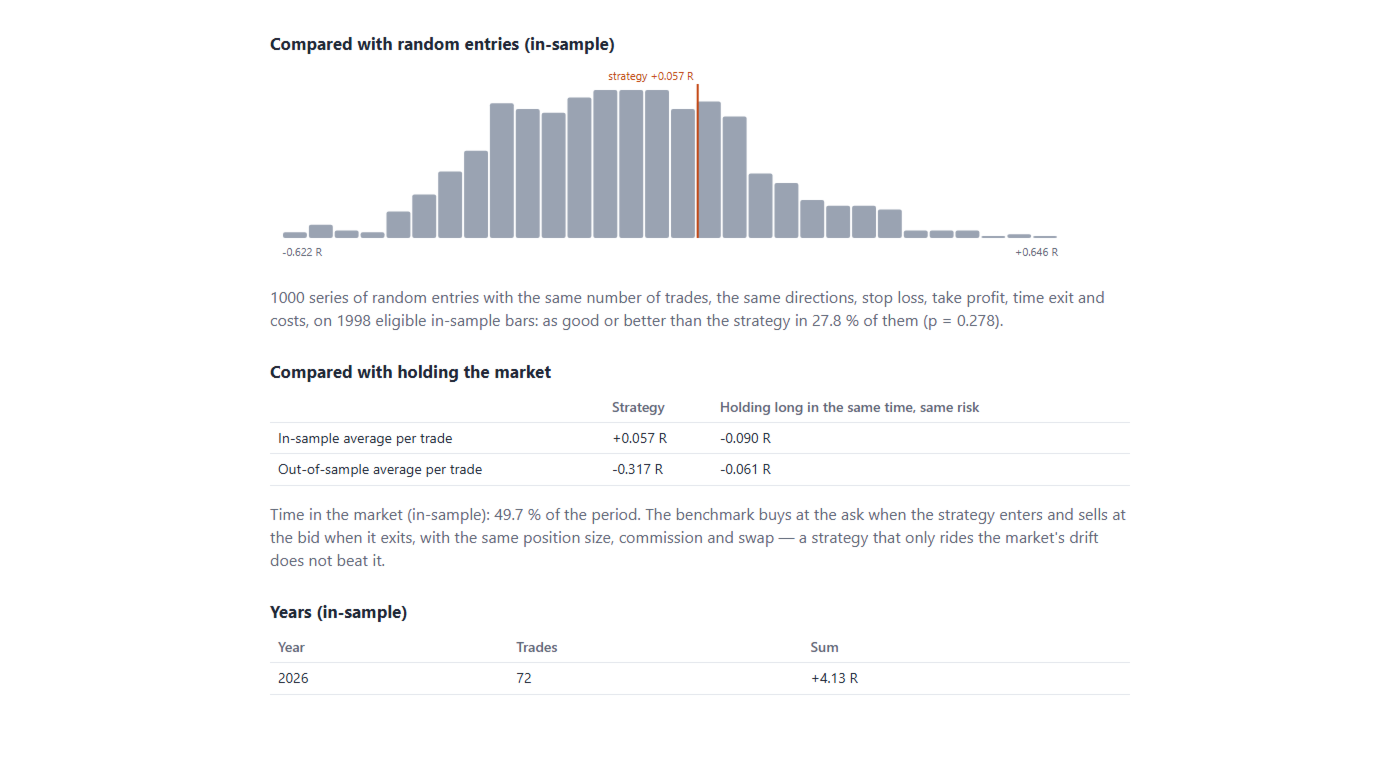
- Two benchmarks: 1,000 series of random entries with the same stop and target geometry and the same costs, and holding the market over the same time at the same risk.
- Walk-forward: tests the tuning procedure (up to two numbers re-tuned inside the learning part), not one set of numbers.
- Bot generator: if the strategy passes, the Lab writes the source code of an MT5 bot (.mq5) with exactly these rules. On start the bot checks the hash of its rules and refuses to run if they were changed.
- Export: trades (CSV), the strategy file with its hash and an HTML report in English, Polish or German.
Building blocks
- Entry (1 to 3 conditions): SMA/EMA crossover, RSI crossing a level, Donchian channel breakout, close outside the Bollinger band, MACD crossing its signal, a large candle (range at least k x ATR) or your own indicator (arrows, sign of a buffer, level crossing, two lines crossing). Signal on the closed candle, entry at the next candle's open.
- Filters (0 to 2): session hours, days of the week, trend from a higher timeframe, volatility level, trend on H1, H4 and D1 at once, cost wall (the cost of one trade at most X % of ATR(14)) and news window (economic calendar of MetaTrader 5, on the chart only).
- Exit: a stop is mandatory (k x ATR or points), a target in R or none, exit after N candles, the opposite signal, an exit rule, stop to entry after +X R and a trailing stop X R behind the best price.
Eight criteria fixed in code before you see a result
- at least 100 trades in the learning part
- profit factor at least 1.25
- better than random entries with the same geometry and costs (p < 0.05)
- out-of-sample check averaging above zero
- still above zero without the 5 best trades
- at least 60 % of years positive (from 3 years of data)
- better than holding the market
- average above zero after the correction for the number of attempts
How to use it
- Attach the Lab to a chart of the symbol you want to study. It measures commission and broker markup from your account history and opens the panel. On an account without trades, enter the commission in the inputs.
- In the panel choose the period, direction, entry, filter and exit, then press CALCULATE. Add your own indicator to the chart first and the panel will find it.
- Or use the Strategy Tester: choose the Lab, the model "Every tick based on real ticks", and describe the strategy in the inputs. The HTML report is saved in Common\Files\RBR_LAB.
Notes
- Optimization mode is refused on purpose: picking the best of many variants is what makes results from history shrink later.
- The news window filter needs the MetaTrader 5 calendar and works on the chart only; the Strategy Tester has no calendar.
- The panel and the report follow the terminal language (English, Polish, German).
- A result describes the past and is not a forecast. Run a generated bot on a demo account first.