Footprint RNN

Footprint RNN is a machine-learning system that applies a Recurrent Neural Network to sequential market data enriched with tick-derived footprint features. As a recurrent model, the RNN processes observations in chronological order and maintains a hidden representation that is updated at each time step. This allows the model to capture temporal structure in order flow, liquidity behavior, and market microstructure from historical sequences.
The indicator combines configurable training workflows, chronological validation, feature selection, paired-symbol inputs, and multi-timeframe feature construction.

Three Learning Modes

  1. Base Learn trains a model using the configured parameters; training runs across multiple epochs and walk-forward sets. 
  2. Genetic Learn uses an evolutionary alghoritm to evaluate candidate model configurations. Candidate fitness is determined from validated best-checkpoint results across the walk-forward sets. This allows the system to explore different model configurations and retain stronger candidates based on validation performance.
  3. Deep Learn evaluates a structured grid of configured model and training parameters. Candidate models are compared using validation results, and the strongest validated configuration is retained.

Two Prediction Modes

    1. Classification mode estimates the direction of the future price move over the configured prediction horizon. The model produces a signed output bounded by its configured activation function (-1/+1). Performance is evaluated using directional accuracy or another selected classification score.
    2. Regression mode estimates the future return as a percentage. Regression candidates are evaluated primarily using validation error, with a custom score based on RMSE as the main selection metric and  Directional-match statistics. 

Tools

  1.  Features Extraction: when enabled, the system evaluates candidate input sets and trains the final model using the selected features returning the best result.                                                                                                                                                                                                                                                                                              -Genetic Extraction searches for effective feature subsets using an evolutionary optimization process; this allows the system to test combinations of features and identify stronger input sets.                                                                                                                                                                                                                                       -Sequential Extraction evaluates ranked feature prefixes to identify an effective subset size.                                                                                                                                                                                                                                                                                                                                                                                                           -Top Extraction ranks features by importance and selects the configured number of top-ranked inputs.

  2. Walk-Forward Training and Validation: Historical data is partitioned chronologically into walk-forward sets; each set contains its own training window and validation window; for every walk-forward set, the best-performing epoch is selected based on validation evidence. Candidate configurations are ranked using their selected checkpoints, not simply the weights from the final epoch; this approach evaluates model behavior across multiple historical windows instead of relying on a single training-validation split.
  3. Early-Stop / Deep-Patience: Deep patience stops candidate training after the configured number of consecutive epochs without improvement in its validation selection score; early stop stops candidate training when the configured validation metric reaches or exceeds the target threshold.
  4. Multi-Timeframe Features Architecture: The indicator allows the feature timeframe to be configured separately from the chart timeframe; completed source-timeframe bars are aligned with chart-timeframe observations so the model can use multi-timeframe context when predicting future candles on the chart timeframe. This structure helps maintain chronological consistency while allowing the model to access information from different timeframe resolutions.
  5. Paired Symbol Features: An optional paired symbol can provide cross-market context during feature construction and training.
  6. Ridge Calibration: Ridge Calibration is an optional post-training refinement stage applied to the model’s raw predictions; it uses L2-regularized linear regression to learn a stable mapping from the base model output to the final calibrated prediction. The Ridge penalty constrains the calibration coefficients, reducing sensitivity to noisy or unstable model outputs and helping avoid overfitting to small variations in raw scores.
  7. ML Graph: The visualization graph displays relationships between input features, training epochs, candidate models, validation sets, and calibration stages; connected nodes and highlighted paths illustrate how candidate model lineages evolve and lead to the selected model neural network. 


Note: MT5 provides native historical tick-by-tick data, allowing footprint rows to show reported real traded volume executed at each price level when the broker supplies real-volume data.

The Machine Learning model is fully devoloped using mql5 native lenguage and doesn't required any python integration.

Support & Feedback: Need help with setup or configuration? Feel free to message me directly on MQL5 for dedicated technical support. If you find Footprint LSTM valuable for your trading, please consider leaving a positive review.

推荐产品
Volume flow Profile
Israr Hussain Shah
大师版是一款专业级的分析工具,旨在通过成交量和资金流向的视角来可视化市场结构。与标准的成交量指标不同,该工具直接在图表上显示每日成交量分布,让您准确看到价格发现发生的位置以及“聪明钱”的定位。 此大师版专为清晰度和速度而设计,具有独特的自动主题同步系统,加载后即刻美化您的图表布局。 主要特点: 真实资金流向计算: 超越标准的跳动量。启用“Use Money Flow”时,成交量按价格加权,揭示了特定价格水平的实际资金投入。 价值区域 (VA) 可视化: 自动计算价值区域(默认为成交量的70%)。 VA填充: 为价值区域背景着色,以便即时识别控制区域。 关键水平: 清晰标记控制点 (POC)、价值区域高点 (VAH) 和价值区域低点 (VAL)。 专业标记系统: 扫描概况结构以识别关键交易区域: HVN (高成交量节点): 接受和盘整区域(支撑/阻力)。 LVN (低成交量节点): 拒绝区域或“快速通过”区域。 所有标记均向右绘制延长线,便于监控。 Delta 背离(左侧直方图): 左侧直方图可视化每个级别的买卖压力对比。这有助于识别隐藏的背离——即价格可能上涨,但卖家在这些水平上激进打
Ugenesys AI MT5
Odaine Ramon Mcmillan
uGenesys AI - 90% Accurate Daytrading Indicator Introducing the ultimate forex trading indicator system, uGenesys AI, powered by cutting-edge AI technology and advanced analytical techniques, including Time-Series Analysis and Genetic Algorithms. Our AI-powered trading system leverages the power of time-series analysis to identify trends and patterns in historical price data, allowing traders to make informed predictions about future market movements. By analyzing vast amounts of data, our syst
Market Profile TPO Market Profile TPO is a multi-period Time-Price-Opportunity (TPO) indicator for MetaTrader 5. It builds price profiles from time data and displays the Point of Control (POC), the Value Area (VAH and VAL), the Initial Balance (IB), Single Prints, a volume overlay and profile merging on the chart. It is written entirely in MQL4 and does not use DLLs or external files. What the indicator draws TPO profile: each price level is tagged with the time slice in which it traded. Display
Boom Crash SMC
Israr Hussain Shah
Here   our more valuable tools SMC Trend Trading   ,  Easy SMC Trading  ,  Institutional SMC Architect Volume Analysis Tools  ,  Volume flow Profile  ,  Market volume profile  , FVG with Volume  , Liquidity Heatmap Profile  ,  Volume Spread Analysis Deriv boom and crash index spike killer system you can use it only on m5 timeframe  follow the structure and get signal with alert on phone open trade set sl tp and enjoy easy analysis and trading made simple 
Intraday Session TPO
Kummari Raghu Ram
Intraday Session TPO: Precision Volume Profiling for Day Traders Stop trading blind during the most volatile hours of the day. Standard daily volume profiles blend everything together, masking the true areas of liquidity and institutional interest. The Intraday Session TPO is engineered specifically for session-to-session traders. It empowers you to isolate and profile specific time windows—like the London Open, the New York Killzone, or the Asian range—so you can see exactly where the volume is
ATR MultiTF PRO is a professional volatility and Volume Profile tool for MT5. It projects Daily, Weekly, and Monthly ATR expansion bands alongside institutional Volume Profile metrics (POC, VAH, VAL) on your chart to identify exhaustion, mean-reversion, and high-probability setups. MAIN FEATURES: - Multi-Timeframe ATR Bands: Plots 1D, 1W, and 1M Fibonacci-based ATR expansion zones simultaneously. - Integrated Volume Profile Filter: Tracks POC, VAH, and VAL using customizable lookback periods (
Volume Profile Multiple — 多区块成交量分布指标,带缓冲区数据接口,支持算法交易 还在为每次切换周期都要重新绘制、重新计算成交量分布图而烦恼吗? Volume Profile Multiple 可在图表上自动绘制多个连续的成交量分布区块,揭示机构资金在市场各个阶段的真实活动区域——而不仅仅局限于最近可见的价格区间。 功能说明 该指标将历史价格按每 N 根K线划分为若干区块(区块数量和每区块的K线数量均可自定义),并为每个区块计算完整的成交量分布数据:控制点(POC)、价值区上下沿(VAH/VAL),以及高成交量节点和低成交量节点(HVN/LVN)。最终呈现的是一幅逐区块的市场结构可视化地图,便于识别基于真实成交量的筹码集中区、支撑阻力位,以及价格在不同价值区之间的轮动情况。 同样为算法交易而设计 与大多数成交量分布指标不同,本指标不仅提供可视化功能:它还输出 3个数据缓冲区 (最新区块的 POC、VAH、VAL),完全兼容 StrategyQuant X 以及任何 MQL5 智能交易系统(EA)。这意味着您可以直接基于这些关键价位构建交易策略,无需重新编写成交量
Volume Profile Sessions PRO:亚洲、伦敦和纽约交易时段的成交量分布以及日成交量分布,适用于任何品种,可在实时图表和策略测试器中使用。 查看每个交易时段的成交量分布在哪里,市场接受了哪些价格,哪些价位仍未被触及。 无需准备即可在策略测试器中使用 成交量分布由 1 分钟K线构建。MT5 策略测试器会提供测试开始日期之前的 M1 历史,因此在测试的第一根K线上,时段分布、前几日以及 naked POC 就已经显示在图表上,可视化模式和 EA 均可使用。无需下载或准备任何数据。 显示内容 - 亚洲、伦敦和纽约时段的成交量分布,包含 POC、VAH 和 VAL。每个时段都可以单独开启或关闭,并按经纪商服务器时间设置时段时间。 - 每天的日成交量分布。显示时段时,过去的日分布绘制在当天结束处,今天的分布绘制在最后一根K线右侧。 - 每一行的上涨和下跌成交量(估算值,见“数据”)。 - 前几日以及(可选)各时段的 naked POC,延伸至价格触及为止。 - 固定区间分布:点击 RANGE,然后在图表上点击两个点。关闭 DAY 和 SESSIONS 即可只保留您的区间,
Here   our more valuable tools SMC Trend Trading   ,  Easy SMC Trading  ,  Institutional SMC Architect Volume Analysis Tools  ,  Volume flow Profile  ,  Market volume profile  , FVG with Volume  , Liquidity Heatmap Profile  ,  Volume Spread Analysis The    Liquidity Heatmap   is a sophisticated institutional trading tool designed to reveal where over-leveraged traders are trapped. By calculating estimated liquidation levels based on volume spikes and leverage, this indicator draws a dynamic "h
了解价格可能寻找流动性的位置 Liquidity Reaction Map MT5是一款基于图表的市场分析指标。它根据已确认的价格结构识别潜在的买方流动性区域和卖方流动性区域。 该指标将摆动高低点、等高点和等低点、前一日和前一周高低点、交易时段极值以及心理整数价格整合到一个清晰的流动性地图中。相互接近的价位可以合并,并根据强度、与当前价格的距离以及多个来源的一致程度进行排序。 该指标帮助交易者分析价格可能接近、扫过、拒绝或突破流动性区域的位置。它不会开仓或管理交易。 流动性来源 流动性地图可以从以下来源识别流动性: 已确认的摆动高点和低点 等高点和等低点 前一日高点和低点 前一周高点和低点 已完成交易时段的高点和低点 心理整数价格水平 多个可配置时间周期 买方流动性显示在相关高点上方,卖方流动性显示在相关低点下方。 这些区域是根据历史价格结构计算的估计值。该指标不会访问经纪商订单簿或真实的止损持仓数据。 排序后的流动性区域 检测到的价位会根据以下多个因素进行评估: 支持该价位的枢轴点数量 等高点或等低点的聚集程度 多个来源的一致性 时间周期的重要性 与当前价格的距离 价位的新鲜度 相互
VOLUME PROFILE SAF-XII 专业级 MT5 市场轮廓(成交量概况)分析仪 —— 网格交易者的梦幻指标 什么是成交量概况 (Volume Profile)? 成交量概况是一种专业的机构级工具。与传统的随时间显示成交量的指标不同,它显示的是 特定价格水平 上的交易活动。它揭示了交易发生在 哪里 ,帮助您识别: 价值区 (VAH/VAL) :大部分交易发生的价格区间。 控制点 (POC) :成交量最高的核心价格水平。 流动性失衡 :每个层级的多空主导力量对比。 支撑/阻力 :基于实际交易活动形成的天然价格位。 三种操作模式 —— 真正的“设置后即忘” VP_MANUAL(波段交易与关键位分析) 用户通过拖动垂直线自定义分析范围。 仅在移动线条时重新计算。 适用场景 :新闻前夕分析、财报发布、特定日期范围。 VP_AUTO(头寸与动量交易) 随新柱线自动向后滚动。 使用自定义回溯周期(默认 100 根柱线)。 适用场景 :动量策略、突破交易。 VP_SESSION(日内交易与机构流向) 锚定逻辑交易时段(伦敦、纽约、亚洲盘开盘)。 适用场景 :日内交易、基于时段的机构化策略
Blahtech Market Profile MT5
Blahtech Limited
5 (10)
Was: $249  Now: $99   Market Profile defines a number of day types that can help the trader to determine market behaviour. A key feature is the Value Area, representing the range of price action where 70% of trading took place. Understanding the Value Area can give traders valuable insight into market direction and establish the higher odds trade. It is an excellent addition to any system you may be using. Inspired by Jim Dalton’s book “Mind Over Markets”, this indicator is designed to suit the
Market Projection Pro — MT5 想在图表上观察所选价格周期可能如何延伸?Market Projection Pro 分析您选择的历史区间,提取周期成分,并在分析窗口右侧绘制合成投射。您可以控制历史区间和向前延伸的长度,将计算情景与价格结构及潜在转折区域进行对比。 图表上显示什么 可交互边界允许您直接在图表上选择历史分析区间。 周期成分和合成曲线帮助观察所选走势的节奏。 投射按照指定的未来蜡烛数量延伸计算情景。 可选转折点和转折区域便于检查投射结构。 图表上的计算、构建与清除按钮让操作集中在同一界面。 使用方法 选择两条边界之间的区间,点击 Calculate Cycles,再点击 Build Projection。分析长度是用于计算的历史蜡烛数量;投射范围是向前绘制的蜡烛数量,两者分别设置。修改区间后,请重新计算周期并重建投射。需要比较情景时,选择另一段历史并重复计算;需要观察转折时,开启转折点或区域。 购买前试用 下载演示版,在 MT5 中启动可视化测试,以使用图表按钮和边界。选择历史数据充足的区间,计算周期并构建投射。建议从默认的 70 根蜡烛投射范围开始。
Astral Volume
Ottaviano De Cicco
Astral Volume 从更广的背景解读成交量加权动量。 首发特惠 — $78 · 立省35% · 首发优惠后为$120。 当前周期的强劲走势,在更高周期中可能呈现不同面貌。对于结合价格与成交量进行分析的交易者,Astral Volume 将当前读数与更广的周期背景汇集在一起,供您在评估方向变化前查看。 结合背景判断走势。 观察基于 tick 量加权的动量,并将其强度与近期历史进行比较。 识别一致与分歧。 在当前读数旁查看两个更高周期,无需在脑中拼接多个独立图表。 设定一致的确认规则。 选择哪些周期必须方向一致,才接受方向变化信号。 当您的方法需要结合动量、相对强度和周期一致性时,可使用 Volume。它采用经纪商的 tick 量,并非集中市场的实际成交量或已成交订单流。 结合背景解读市场 Volume: 当前图表周期。柱状图显示振荡器,曲线提供平滑参考,整个窗口的背景跟随当前方向状态。 Context: 选定的第一个更高周期,显示在指标窗口底部两条色带中的上方色带。 Macro: 所选的第二个更高周期,显示在下条色带。两条色带高度相同。 紧凑面板标识各周期及其看涨、看跌或中性状态
Manyal trading system, CovEchoTrend Robot, focuses on reliability and flexibility. By employing statistical analysis methods to study the relationships between the base indicator and market patterns, the system enables a deeper understanding of market processes. Intelligent pattern analysis: The application of statistical data processing helps identify key trend reversal points more accurately, signaling significant market shifts. Informed decision-making is based on the intersection of indicato
Market Profile Advanced — TPO, VAH/VAL/POC, Value Area & Anchored VWAP Market Profile Advanced brings a full Market (Time Price Opportunity) Profile to any symbol and timeframe in MetaTrader 5 — Point of Control, Value Area High/Low, TPO letters or solid histogram blocks, single-print zones, poor highs/lows, an Initial Balance marker, and an independent Anchored VWAP — all rendered natively as chart objects, with no DLLs and no external dependencies. Core Market Profile Daily, weekly, monthly, q
Spike Blast Pro
Israr Hussain Shah
Here   our more valuable tools SMC Trend Trading   ,  Easy SMC Trading  ,  Institutional SMC Architect Volume Analysis Tools  ,  Volume flow Profile  ,  Market volume profile  , FVG with Volume  , Liquidity Heatmap Profile  ,  Volume Spread Analysis Spike Blaster Pro is a next-generation MT5 indicator designed specifically for synthetic markets. It works seamlessly on Boom Index and Weltrade Index , providing traders with sharp, reliable spike detection signals. What makes Spike Blaster Pro po
BoxChart MT5
Evgeny Shevtsov
5 (7)
The market is unfair if only because 10% of participants manage 90% of funds. An ordinary trader has slim changes to stand against these "vultures". This problem can be solved. You just need to be among these 10%, learn to predict their intentions and move with them. Volume is the only preemptive factor that faultlessly works on any timeframe and symbol. First, the volume appears and is accumulated, and only then the price moves. The price moves from one volume to another. Areas of volume accumu
PZ Mean Reversion MT5
PZ TRADING SLU
1 (1)
采用专业和量化方法进行均值回归交易的独特指标。它利用了价格以可预测和可衡量的方式转移并返回均值这一事实,这允许明确的进入和退出规则大大优于非量化交易策略。 [ Installation Guide | Update Guide | Troubleshooting | FAQ | All Products ] 清晰的交易信号 非常容易交易 可定制的颜色和尺寸 实现性能统计 优于大多数交易策略 显示合适的止损和止盈水平 它实现了电子邮件/声音/视觉警报 这个怎么运作 该指标从更高的时间范围测量完全可定制的移动平均线的标准偏差,并使用趋势跟踪方法精确地找到交易。交易是通过深入当前图表的价格行为发现的,并在价格返回到平均价格区间时关闭,根据您选择的更高时间范围计算。由于其编码方式,该指标将远离高波动性和强劲趋势市场,并且仅在可预测的情况下进行交易,在可接受的波动性与方向性比率范围内,回归均值是可行的。 指标剖析 绿线是更高时间范围内的移动平均线(也就是平均值) 虚线区域是移动平均线周围的典型价格区间 蓝线是看涨交易的突破价格 红线是看跌交易的突破价格 交易是针对均值进行的,并在典型的价格
Deriv Boom and crash
Israr Hussain Shah
Here   our more valuable tools SMC Trend Trading   ,  Easy SMC Trading  ,  Institutional SMC Architect Volume Analysis Tools  ,  Volume flow Profile  ,  Market volume profile  , FVG with Volume  , Liquidity Heatmap Profile  ,  Volume Spread Analysis Boom: Take SELL signals only (price spikes up then crashes) Crash: Take BUY signals only (price drops then spikes up) SL goes beyond the line as labeled Interactive Market Watch Panel : A left-side sidebar showing real-time strength indicators (po
Before installing the HeatMap indicator make sure you are using a broker that gives you access to the Depth of market (DOM) !! This indicator creates a heatmap on your chart allowing you to see the buy or sell limit orders easily and in real time. You have the possibility to change the setting and the colors of the HeatMap in order to adapt to all markets and all charts. Here is an example of a setting you can use with the NASDAQ100 on the AMPGlobal broker :  https://www.youtube.com/watch?v=x0Y
TradersParadiseView: Institutional Liquidity & Trend Logic TradersParadiseView is a professional-grade momentum and supply/demand indicator designed to identify high-probability "Smart Money" entries. Unlike standard lagging indicators, this tool focuses on Institutional Trap Zones and Market Volatility Confluence to provide precise entries with minimal drawdown. Developed for the modern trader, it translates complex price action into simple, actionable visual zones and signals. How it Works Tra
ONNYX INDICATOR 版本 1.14 这是一款用于 MetaTrader 5 的供需区域分析指标。已确认的历史信号采用收盘K线逻辑,避免确认后的箭头因盘中波动而消失。指标根据确认的摆动高低点建立区域,使用 ATR 调整区域宽度,并以百分比显示区域质量。 主要功能 - 供需区域及区域内百分比评分。 - 收盘K线确认后的放大 BUY/SELL 箭头。 - 可选 EMA 趋势过滤和K线拒绝确认。 - 趋势、价格水平和市场环境面板。 - 最多显示 5 条相关经济新闻;公布前显示 Forecast 和 Previous,公布后显示 Actual。 - 新闻每 60 秒刷新,并支持策略测试器中的日历缓存。 - 弹窗、推送和邮件提醒。 - iCustom 集成:缓冲区 0 为 BUY 价格,缓冲区 1 为 SELL 价格。 使用方法 将指标加载到图表,等待历史数据完成加载,查看趋势和有效区域,然后结合自己的交易计划使用收盘K线信号。XAUUSD H1 适合更清晰的结构,M15 可获得更频繁的机会。 重要提示 本产品是分析指标,不是自动交易 EA,不会自动开仓、修改或平仓,也不保证盈利。请先
TradeAQ
Guo Sheng Zhao
这个量价结构指标是一款适用于   MetaTrader 4 和 MetaTrader 5   的图表分析指标,集量价结构、成交量分布、市场情绪、波动提示和关键价格区域展示于一体。指标直接运行在主图窗口,可帮助交易者快速观察市场的重要价格位置与活跃程度。 主要功能 1. 量价结构支撑与阻力 自动标记连续量价结构形成的潜在支撑位和阻力位,辅助识别价格可能出现停顿、反应或突破的位置。 支持两种分析模式: 成交量结构 价格结构 线条颜色、宽度和样式均可自定义。 2. 成交量尖峰提示 当市场成交量显著放大时,在图表中显示醒目标记,帮助发现异常活跃、加速、衰竭或可能发生方向变化的行情。 可选功能包括: 尖峰图标提示 尖峰价格水平线 高点、低点、收盘价或组合价位显示 自定义成交量阈值 3. 高波动行情提示 自动标记波动明显扩张的 K 线,方便交易者及时发现突破、加速和快速行情。 支持: 高波动图标 关键价格水平线 自定义检测周期与敏感度 自定义线条颜色、宽度和样式 4. 成交量分布 在图表右侧显示指定范围内的成交量分布,直观呈现不同价格区域的交易活跃程度。 主要显示内容包括: 高成交量节点 低成交量
Boom coins indicator and crash coins
Waleed Hamood Said Al Rawahi
YouTube上的指標直播。更多可信度請點擊下面的鏈接。還有指標的視頻可以觀看。注意直播晚了,不要依賴,只有對指標的回顧僅回顧指標的準確性,幾乎不輸,利潤率達到 95%。我將在 CRASH coin 1000 INDICES 上非常準確地工作 YouTube上的指標直播。更多可信度請點擊下面的鏈接。還有指標的視頻可以觀看。注意直播晚了,不要依賴,只有對指標的回顧僅回顧指標的準確性,幾乎不輸,利潤率達到 95%。我將在 CRASH coin 1000 INDICES 上非常準確地工作 YouTube上的指標直播。更多可信度請點擊下面的鏈接。還有指標的視頻可以觀看。注意直播晚了,不要依賴,只有對指標的回顧僅回顧指標的準確性,幾乎不輸,利潤率達到 95%。我將在 CRASH coin 1000 INDICES 上非常準確地工作
Brief Description: An assistant for analyzing market dynamics and volatility across timeframes (MT), featuring an automated position simulator based on the "R" (risk multiple) concept. Decision-Support Assistant (based on multi-timeframe ATR analysis) This tool is a professional, multi-timeframe (MTF) entry system designed to identify high-probability trend continuation (CONT) and trend reversal (RV) patterns. Key Strengths and Technical Structure A robust, three-layer "pinned" multi-timeframe
ICT Yoshi Pro
Le Quang Thanh
Market Structure, Liquidity and Price Action Analysis for MetaTrader 5 A chart can contain plenty of information and still leave a trader without a clear decision. A BOS label may appear, liquidity may be nearby, and an order block may remain active, yet the real challenge is understanding how those elements relate to one another. ICT Yoshi Pro organizes that process into a cleaner, more disciplined MetaTrader 5 workflow. What ICT Yoshi Pro Does ICT Yoshi Pro is a manual decision-support indicat
Range profile
Mikhail Nazarenko
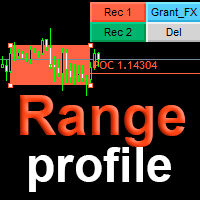
The indicator automatically calculates the level and   real volume       Point of control, and also displays the market profile for an array of candles, within the boundaries of a rectangle. If your strategy is based on taking profit on a rebound from price accumulations,   the Range profile indicator will become the main tool in scalping trading. Point of control is calculated based on the total volume for each tick or minute candles, depending on the settings and trading timeframe. In the abse
该指标建立当前报价,可以与历史报价进行比较,并在此基础上进行价格走势预测。指示器有一个文本字段,用于快速导航到所需日期。 选项: 符号 - 选择指标将显示的符号; SymbolPeriod - 选择指标从中获取数据的时段; IndicatorColor - 指示器颜色; HorisontalShift - 由指标绘制的报价移动指定的柱数; Inverse - true 反转引号,false - 原始视图; ChartVerticalShiftStep - 图表垂直移动(键盘上的向上/向下箭头); 接下来是文本字段的设置,您可以在其中输入日期,您可以通过按“回车”立即跳转到该日期。 接下来是文本字段的设置,您可以在其中输入日期,您可以通过按“回车”立即跳转到该日期。
Trading Discipline Trend Dashboard 只读取您自己账户已平仓的交易历史,并把四种特定模式转化为7天走势,让您看清某种行为只是偶然一次,还是每周都在重复。它不做预测,也不给建议。面板上的每一个数字,都是这个账户上已经发生过的事实。 数字是怎么算出来的:它读取最多37天内所有品种、所有魔术号的已平仓交易——这是整个账户的画面,而不只是当前图表品种的画面。四行数据,各有各的定义。Post-loss oversize 统计在一次亏损平仓后10分钟内开出的新仓位中,手数超过30天基准值(同类新仓的手数中位数)的笔数——这与免费指标 Trade Behavior Mirror 的定义完全相同。Win-streak oversize 统计在连胜仍在持续期间开出的新仓位中,手数超过同类30天基准值的笔数——这与免费指标 Win Streak Size Creep Mirror 的定义完全相同。Symbols per day (avg) 统计某一天有新仓位的不同品种数量,并显示统计窗口内的日均值——这与免费指标 Multi-Symbol Chase Mirror 的定义
该产品的买家也购买
ARICoins
Temirlan Kdyrkhan
ARICoin is a powerful trading companion designed to generate high-probability entry signals with dynamic TP/SL/DP levels based on volatility. Built-in performance tracking shows win/loss stats, PP1/PP2 hits, and success rates all updated live. Key Features: Buy/Sell signals with adaptive volatility bands Real-time TP/SL/DP levels based on ATR Built-in MA Filter with optional ATR/StdDev volatility Performance stats panel (Success, Profit/Loss, PP1/PP2) Alerts via popup, sound, push, or email Cust
Boba Analysis Suite
Trade Ready Solutions LLC
5 (2)
Boba Analysis Suite Boba Analysis Suite 是一款适用于 MetaTrader 5 的分析指标。它将市场结构、关键价格区域和整体市场背景整合到同一图表视图中。 该指标源于交易及交易教学的实践经验,旨在帮助用户建立有条理的分析流程:评估市场方向、识别重要价位,并结合多个时间周期进行分析。 结合市场背景进行分析 单个信号的意义取决于市场背景。Boba Analysis Suite 帮助用户将当前图表状况与更大范围的市场结构相结合,并根据预先制定的规则评估交易思路。 分析功能包括: **趋势与市场结构:**评估市场方向及相关结构背景。 **关键价格区域与价位:**在图表上直观标示值得进一步分析的重要区域。 **多时间周期:**整合不同时间周期的信息,评估整体市场背景。 **可视化分析流程:**直接在图表上查看分析信息。 自主做出交易决策 Boba Analysis Suite 适合希望系统分析图表并结合多个时间周期信息的交易者。 该指标用于辅助分析,不会开仓或平仓,也不能替代交易策略或风险管理。每一笔交易的决策均由用户自行做出。 使用与许可 平台:Meta
ScalpPoint
Temirlan Kdyrkhan
ScalpPoint is a powerful trading companion designed to generate high-probability entry signals with dynamic TP/SL/DP levels based on volatility. Built-in performance tracking shows win/loss stats, PP1/PP2 hits, and success rates — all updated live. Key Features: Buy/Sell signals with adaptive volatility bands Real-time TP/SL/DP levels based on ATR Built-in MA Filter with optional ATR/StdDev volatility Performance stats panel (Success, Profit/Loss, PP1/PP2) Alerts via popup, sound, push, or emai
Zain Gold Scalping
Ahmed Gamal Abdel Nasser Mohamed
A complete price-action analysis tool built around dual independent entry logic, each confirmed against a volatility band, combined with a configurable set of nine optional confirmation filters that let you shape exactly how conservative or aggressive the tool's signals behave. Core Strategy Two independent entry setups, each triggering only when price moves outside a dynamic volatility band — giving two distinct ways to spot potential reversal points, which can be used together or separately.
Azimuth Pro
Ottaviano De Cicco
5 (7)
Azimuth Pro V2:MT5合成分形结构分析与确认入场 概述 Azimuth Pro 是 Merkava Labs 推出的多层级波段结构指标。四层嵌套波段层级、锚定波段的VWAP、ABC形态识别、三时间框架结构过滤以及收盘确认入场——一个图表,一个从微观波段到宏观周期的完整工作流程。 这不是盲目的信号产品。它是一个以结构为先的工作流程,专为重视位置、背景和时机的交易者打造。 万圣节促销 — 立减35% 市场愈发诡谲,你的优势依然锐利。立享35%优惠,别让这份好礼消散在迷雾之中。 Azimuth Pro 现价 259 美元(原价 399 美元)。 1. V2的变化 合成多时间框架引擎 高时间框架分析从零开始重建,采用与Meridian Pro相同的专有合成架构。更清晰的HTF背景、稳定的实时行为、无经典MTF同步问题。合成引擎还解锁了 固定比率时间框架级联 (x2、x3、x4、x6)——不再在经纪商的固定时间框架之间任意跳转,您可以按图表时间框架的固定倍数分析结构,在每个尺度上保持相同的分形关系。 确认入场箭头 作为稳定且可恢复的执行层而设计的收盘确认箭头。当ABC设
Dynamic Forex28 Navigator MT5
Bernhard Schweigert
5 (1)
多货币强度与动能指标 MT5 Dynamic Forex28 Navigator 是我们长期流行的指标的进化版,将三大功能合而为一: Advanced Currency Strength28 Indicator (700 条评论) Advanced Currency IMPULSE with ALERT (530 条评论) CS28 Combo Signals(近期赠品) 这两个前身指标在 MQL5 Market 上合计获得超过 1,200 条评论,自 2016 年以来一直是 MT4 社区的常用工具。Dynamic Forex28 Navigator MT5 延续了同样经过验证的逻辑。 现已为 MetaTrader 5 全面重构 – 旨在充分利用 MT5 原生的多品种架构。 用户手册: https://www.mql5.com/en/blogs/post/758844 在寻找 MT4 版本?请点击此处: https://www.mql5.com/zh/market/product/122172 这个货币强度指标提供什么? 您喜爱原版指标的一切,现在都通过新功能得到增强。 主要功能 专有
Volatility Master for MetaTrader is a real-time dashboard tool that scans up to  50 symbols  to identify high-volatility , trending markets instantly. With bullish/bearish signals, customizable alerts, and a user-friendly interface, it helps you avoid range-bound conditions and focus on high-probability trades. Clarity leads to confidence. Trade confidently and protect your capital effectively with this powerful dashboard. We don't offer free or bonus indicators in exchange of reviews from you.
Neuro Poseidon MT5
Daria Rezueva
4.68 (53)
Neuro Poseidon is a new indicator by Daria Rezueva. It combines precise trading signals with adaptive TP/SL levels - creating best possible trades as a result! Message me and get  Neuro Poseidon Assistant  as a gift to automize your trading process! What makes it stand out? 1. Proven profitability on all assets and timeframes 2. Only confirmed BUY and SELL signals present on the chart 3. Adaptive TP & SL levels generated by the software for each trade 4. Easy to understand - suitable for al
AriFocus
Temirlan Kdyrkhan
AriFocus - Non-Repainting Buy/Sell Signals AriFocus - one clear signal. AriFocus marks buy and sell signals directly on the chart and suggests a stop-loss level for each one. Every signal is confirmed on bar close and never repaints. - Buy/sell arrows, confirmed on bar close - Suggested stop-loss level for every signal - Trend band and candle coloring to show direction at a glance - 10 ready-made presets, or your own settings (14 calculation methods) - Pop-up, push and email alerts with entr
CGE Trading Suite
Carl Gustav Johan Ekstrom
5 (3)
Institutional-Grade Analytics for MT5 The full analytical edge of a professional trading desk, built into your MT5 chart. A full guided tour walks you through every feature step by step. Standard retail platforms lack the depth required for professional market analysis. The CGE Trading Suite bridges this gap, transforming MetaTrader 5 into a comprehensive workspace. By integrating 18 proprietary modules into a single, unified chart interface, the suite eliminates fragmented analysis. It provide
FX Analysis
Lee Teik Hong
FX Analysis is an all-in-one MT5 indicator dashboard that combines eight analytical tools in a single panel, helping traders identify high-probability setups without switching between charts or indicators. Designed for standard forex pairs on MetaTrader 5. Best results on M15 - H4 timeframes when all components are used together as part of the included workflow. Components Volatility Analyzer Displays historical average movement by hour and by day of the week. A real-time Pip Balance shows the
The Oracle Pro
Ottaviano De Cicco
5 (1)
The Oracle Pro:用于 MT5 的合成多周期偏向引擎 万圣节促销 — 立减35% 市场愈发诡谲,你的优势依然锐利。立享35%优惠,别让这份好礼消散在迷雾之中。 The Oracle Pro 现价 194 美元(原价 299 美元)。 The Oracle Pro 是一款面向高要求与专业交易者的 MetaTrader 5 高级多周期 偏向引擎 。它以纪律回答一个问题:当前每个周期的方向偏向是什么、强度如何、各周期之间的一致程度如何?一切仅在已收盘的 K 线上计算——绝不重绘。 The Oracle Pro 是一套多因子共识系统。它将专有指标与优化算法整合为单一而精密的共识向量,并在单个指标实例内,跨当前周期与更高周期的堆栈进行读取——而不是在多个图表上堆叠互不相关的工具。 它是 Oracle 共识方法的专业进化版:完整重建为高级操作控制台,面向希望在一个纪律化工作流中获得深度、多周期背景与背离洞察的交易者。 是偏向引擎,而非信号生成器 The Oracle Pro 明确自身定位。它是一款提供纪律化方向背景的 多周期多因子偏向指标 。它 不是 信号生成器:不承诺入场、出
您好,交易员! 大多数散户交易者依赖于滞后的网页脚本。真正具有交易优势需要机构化的架构。 Astro AI 指标并非标准的图表叠加层。它是一个编译后的神经网络,包含两个代理,直接运行在您的终端上。 以下是该系统背后的具体技术: 1. 代理 1:分析师(图神经网络 - GNN) 市场并非孤立的价格柱;它们是相互关联的数据网络。 功能:代理 1 使用图神经网络来映射这些复杂的非线性关系。 优势:标准指标仅考虑单一的历史移动平均线,而我们的 GNN 可以实时处理深层的市场结构关系,在散户交易量发挥作用之前揭示隐藏的相关性。 2. 代理 2:执行器(近端策略优化 - PPO) 模式识别只是成功的一半。基于当前市场波动做出正确的决策,才是预测模型与滞后模型之间的区别所在。 功能:代理 2 使用 PPO(一种先进的强化学习算法)来确定最佳入场点。 优势:它持续调整交易策略,而非使用静态的“超买”或“超卖”线。它会分析当前市场状况并计算最可能的成交点。 执行桥接:通过 ONNX 集成到交易终端 如果执行速度慢,模式识别就毫无用处。我们已通过 ONNX(开放神经网络交换平台)
ARIPoint
Temirlan Kdyrkhan
1 (4)
ARIPoint is a powerful trading companion designed to generate high-probability entry signals with dynamic TP/SL/DP levels based on volatility. Built-in performance tracking shows win/loss stats, PP1/PP2 hits, and success rates all updated live. Key Features: Buy/Sell signals with adaptive volatility bands Real-time TP/SL/DP levels based on ATR Built-in MA Filter with optional ATR/StdDev volatility Performance stats panel (Success, Profit/Loss, PP1/PP2) Alerts via popup, sound, push, or email Cu
RelicusRoad Pro MT5
Relicus LLC
4.96 (25)
别再凭猜测做交易。 在同一张图表上看清何时入场、何时离场,以及市场的方向。 RelicusRoad Pro 将近二十种工具整合进一个指标,你可以只开启适合自己交易方式的那几项。 入场清晰。出场清晰。每张图表都有计划。 是不是很熟悉? 你刚买入,价格一分钟后就逆着你运行。 你出场太早,然后眼看着行情在你离场后继续走下去。 图表上有五个指标,给出五种不同的答案。 你的止损全凭猜测。 我们为何开发它 我们做外汇交易已有 18 年。RelicusRoad 背后的核心算法最初是在私下为我们自己的专业交易员圈子开发的。 初衷很个人。我们厌倦了一次次手工画同样的线,违反自己定下的规则,错过图表上真正重要的那一点。 对我们有效的是一致性:每天以同样的方式读图,直到它变成肌肉记忆。RelicusRoad Pro 把这种看盘方式带到你的图表上。 之后我们把它开放给更多交易员,因为一个小圈子能看到的东西有限。 每位交易员都会带来新的问题和想法,好的想法会进入下一次更新。今天其中很多工具之所以存在,是因为我们的交易员提出了需求。 这个社区保持私密且规模不大,同时活跃的交易员保持在 2,000 人以内。有些人使
UZFX {SSS} 超短线智能信号 v5.0 MT5 是一款无重绘的高性能交易指标,专为在快速波动的市场中需要精准、实时信号的超短线交易者、日内交易者和波段交易者设计。该指标由 (UZFX-LABS) 开发,融合了价格行为分析、趋势确认和智能过滤技术,可在所有货币对和时间周期内生成高概率的买卖信号、预警信号以及趋势延续机会。 别再对交易犹豫不决了,开始遵循这一专为追求清晰、精准和纪律性市场执行的交易者设计的结构化信号系统吧。 相信我,这是 MQL5 上最优秀的指标之一,所以千万不要错过!!“为睿智交易者打造的智能信号” 最新 5.0 版本现已发布,价格可能会在未事先通知的情况下上涨至 499.99 美元,所以请尽快入手,以免错失良机!! 最终购买前!如果您想获取免费试用版,请通过 WhatsApp 号码 +923030751987 联系我!! 如果您遇到任何问题“或”有任何不明白的地方,请在私聊中向我咨询!!! 主要功能更新 • 自动买入和卖出信号检测 • 先进的反转识别逻辑 • 潜在市场反转前的预警信号 • 趋势延续确认信号 • 内置风险管理功能,包含入场点、止损点、TP1、
OmniSync Projection
Antonio-alin Teculescu
5 (1)
Chronos Fractal Engine is an innovative price projection indicator for MetaTrader 5, designed to transform your technical analysis by intelligently identifying and projecting historical price patterns. Built upon an advanced correlation algorithm and the fractal principles of the market, this powerful tool visualizes potential future price movements, giving you a unique edge in your trading decisions. What is Chronos Fractal Engine? At its core, the Chronos Fractal Engine employs a sophisticat
Advance AI Scanner
Mohamed Samsudeen
Advance AI Scanner is a multi-symbol analysis indicator for MetaTrader 5. It scans Forex pairs, metals, energy, stock indices and cryptocurrencies at the same time and rates each instrument with its own self-training model. It explains in plain English what moved each market and why, and it estimates how far upcoming economic news usually moves each symbol, measured on your broker's own price history. $199 instead of $499. 10 copies left at this price. One time purchase  Installation and User
Matreshka
Dimitr Trifonov
5 (2)
Matreshka self-testing and self-optimizing indicator: 1. Is an interpretation of the Elliott Wave Analysis Theory. 2. Based on the principle of the indicator type ZigZag, and the waves are based on the principle of interpretation of the theory of DeMark. 3. Filters waves in length and height. 4. Draws up to six levels of ZigZag at the same time, tracking waves of different orders. 5. Marks Pulsed and Recoil Waves. 6. Draws arrows to open positions 7. Draws three channels. 8. Notes support and re
Mahra Pro Indicator MT5
Mahra Said Mohammed Al Kaabi
Mahra Pro Indicator MT5 Overview Mahra Pro is a MetaTrader 5 chart indicator designed to support structured analysis of XAUUSD (Gold). It combines trend, momentum, volatility and price-structure conditions to identify potential buy and sell setups and display them directly on the chart. The indicator does not open, modify or close trades. All trading decisions and order execution remain under the user's control. Main features • Buy and sell signal arrows on the chart. • Fast and slow EMA lines w
The indicator is designed to close positions on the market in time. For example: to take profits ahead of schedule if the price has not reached TakeProfit, and the market is turning around. The indicator analyzes the momentum, not the trend. He does not give any information about the trend. The indicator is well suited for finding divergence. The Ershov 38 Parrots indicator dynamically adjusts to the market and detects price movement impulses of medium and high amplitude. It almost does not rea
Gem SIGNAL
Shengzu Zhong
5 (1)
GEM Signal Pro GEM Signal Pro 是一款適用於 MetaTrader 5 的趨勢跟隨指標,專為希望在圖表上獲得更清晰訊號、更有結構的交易設定,以及更實用風險管理的交易者而設計。 它不僅僅顯示一個簡單的箭頭,GEM Signal Pro 還能以更清晰、更易讀的方式呈現完整的交易思路。當條件確認完成後,指標可在圖表上顯示進場價、止損價與止盈目標,幫助交易者更有效率地評估交易設定。 運作方式 該指標首先根據其內部邏輯識別有效的初始訊號。 當確認條件滿足後,GEM Signal Pro 會在圖表上顯示完整的交易設定。這讓交易者可以更清楚地看到交易結構,並減少手動分析與計算的工作量。 圖表上的交易價位 對於已確認的訊號,GEM Signal Pro 可顯示: 進場價 止損價 止盈 1 止盈 2 止盈 3 風險報酬比 這讓交易設定更容易理解,也有助於讓圖表分析更有條理。 內建風險管理 風險管理是此指標設計的重要部分。 止損位基於近期市場結構,結合附近的擺動高低點與可選的 ATR 緩衝距離。這能讓交易價位更貼近當前市場條件,而不只是依賴固定距離。 圖表資訊面板 GEM Si
Ace Trend
Mikhail Sergeev
5 (3)
我们为您呈现一个革命性的指标,它改变了趋势交易世界的游戏规则。 该指标旨在重新思考性能并将您的交易体验提升到前所未有的高度。 我们的指标拥有先进功能的独特组合,使其有别于竞争对手。 "真实定价因素"的先进技术即使在最困难和最不稳定的市场条件下也能确保无与伦比的稳定性。 告别不稳定的模式,破碎的指标,欢迎有意识的,受控的交易。 该指标不仅仅是一个美丽的画面! 指标应该将赔率转移到交易者身边,从而赚取利润。 熟悉基于指标信号的交易结果(全自动模式): https://www.mql5.com/zh/signals/2339244 AceTrend在根据RBTI版本的趋势指标排名中排名第一。 AceTrend-最大的盈利能力和交易控制. 我们的指标根据当前市场报价而不是历史来突出盈利能力。 加入革命-释放您的交易经验的潜力! 指标不会在已形成的柱上重绘。 如果柱形已形成,指标读数保持不变。 该指标适用于从M1到MN的任何时间框架。 标准是H1时间框架。 您的反馈非常重要! 您有任何问题,建议,或只是想分享您的意见? 写评论或发送消息-我总是保持联系! 指标参数: PreSets - 如果选择
Chimera Volume
Marko Milenkovic
适用于 MetaTrader 5 的 Chimera Volume 高级成交量分析与市场活跃度可视化 Chimera Volume 是一款为 MetaTrader 5 设计的自定义指标,旨在通过动态视觉框架分析标准化成交量活跃度,并展示市场参与度的变化。 该指标利用自适应标准化算法处理 Tick 成交量数据,生成关于成交量强度、累积阶段以及不同市场条件下活跃度变化的结构化表达。 与显示原始成交量数值的标准成交量指标不同,Chimera Volume 应用了额外的计算方法,以突出市场活动的相对变化并提高图表的可读性。 主要功能 根意图直方图 (Root Intent Histogram): 一种动态直方图,用于可视化标准化成交量强度和市场参与度。该直方图使用自适应颜色过渡,以区分活跃度增加时期与参与度减弱时期。 惯性线 (Inertia Line): 一条由标准化成交量计算得出的平滑分析线。旨在帮助交易者观察成交量动能的变化,并监控扩张期与收缩期之间的转换。 信号线 (Signal Line): 一个用于比较短期和长期成交量表现的次级计算层,在评估市场状况时可作为辅助参考。 自适应成交量
Meravith Scanner
Ivan Stefanov
5 (3)
MERAVITH SCANNER 是一款适用于 MetaTrader 5 的专业金融市场指标,将多种分析工具整合为一个统一的系统。它基于专有的成交量加权平均价格(VWAP)方法自动完成所有计算,完全消除主观判断。 该指标适用于所有资产类别(外汇、股票、指数、大宗商品、加密货币)以及从 M1 到 Monthly 的所有时间周期。其核心原理是价格跟随成交量。MERAVITH 识别机构资金成交量的集中区域,并从该集中区域中推导出数学上精确的价格水平。它不预测,不推测。它只计算。 使用 MERAVITH SCANNER,您可以在 2–3 分钟内扫描全部 28 个主要外汇货币对的所有时间周期。您也可以扫描任何您选择的市场——例如,大约 100 只股票约需 10 分钟。 该指标计算耗尽水平、平衡线、偏差、统计水平以及目标投射。 图表元素 Origin Point 标记所有计算的起始位置。指标会自动将其放置在最佳位置。红色标签(TOP)表示市场高点并带有看跌倾向。绿色标签(BOTTOM)表示市场低点并带有看涨倾向。 Sentiment Line 是一条动态曲线,反映基于成交量加权计算得出的市场情绪。
TrendMaestro5
Stefano Frisetti
note: this indicator is for METATRADER4, if you want the version for METATRADER5 this is the link:  https://www.mql5.com/it/market/product/108106 TRENDMAESTRO ver 2.5 TRENDMAESTRO recognizes a new TREND from the start, he never makes mistakes. The certainty of identifying a new TREND is priceless. DESCRIPTION TRENDMAESTRO identifies a new TREND in the bud, this indicator examines the volatility, volumes and momentum to identify the moment in which there is an explosion of one or more of these da
Quant Direction MT5
Georgios Kalomoiropoulos
Quant Direction 是一款三维市场分析工具。它通过同时计算多个维度上的精确百分比偏差,提供完全客观的、基于算法的市场分析视角。该算法采用先进的人工智能建模工具开发,并经过全面测试,旨在以独特的精准度解读市场。它可以分析您平台上的任何货币对或金融工具。 无论您是短线 交易者、日内 交易者还是波段交易者,Quant Direction 都是您的理想之选。 交易者的真正优势 Quant Direction 的真正优势在于彻底消除情绪、屏幕疲劳和过度思考。它无需手动点击十几个图表来寻找方向并反复质疑自己的偏好,引擎即可在几毫秒内即时处理 8 个时间周期(从 5 个月到月线)。它能准确告诉你任何时刻谁在掌控市场,确保你始终朝着概率最高的方向进行交易。 市场分析的三个维度 该算法将市场分为三个不同的交易维度,为您提供完整的宏观和微观视角: 超短线交易分析: 捕捉即时、快速的动量变化和较低时间框架的执行点。 日内分析: 识别真实的、潜在的每日方向性偏差。 波动分析: 专注于宏观趋势,确保您不会与大盘机构的走势背道而驰。 独家评分引擎 Quant Direction 的底层采用了一套
Meravith MT5
Ivan Stefanov
5 (3)
MERAVITH 是一款适用于 MetaTrader 5 的多周期成交量与流动性指标,它在每一个时间周期上显示趋势、支撑与阻力区域、入场、目标和止损。它为您提供完整的市场流动性地图,一个对冲基金风格的流动性工具,并用专有的成交量加权平均价格方法自动完成全部计算,因此没有主观解读。 适用于外汇、黄金(XAUUSD)、指数和加密货币,适用于所有时间周期。 购买后赠送:一套关于如何用 MERAVITH 交易的视频课程。购买后请给我发消息。 MERAVITH 的功能 分析所有时间周期,并显示每个周期上正在生效的趋势。 标记流动性区域(Volume Equilibrium),即多头与空头成交量相等的位置。 将所有时间周期的流动性水平直接显示在您的图表上。 写出市场的文字分析供您参考。 根据当前趋势计算入场、目标、支撑位和止损。 计算您交易的风险回报比。 按您的账户余额计算仓位大小,并估算潜在利润。 在市场出现重要变化时提醒您:警报、电子邮件和推送到手机的通知。 主要线条 Bullish / Bearish Volume Exhaustion 线:目标位。 趋势线:随趋势改变颜色(多头或空头),显
Cycles Plotter
Edoardo Centorame
Cycles Plotter 带移动平均线和开始日期的可自定义周期指标 Cycles Plotter 是一种高级技术指标,可根据用户输入绘制两个完全可自定义的正弦周期。它不会自动生成周期:所有周期都完全根据用户设置的参数计算,为交易者提供一种视觉工具,用于研究价格波动和潜在的趋势变化,而不产生自动信号或预测。 关键点: 用户定义的周期:周期 1 P1 和 2 P2 完全由用户配置。可以设置周期长度、幅度、移动平均线以及精确的开始日期和时间。如果用户未输入参数,则不会绘制任何周期。 幅度控制:每个周期可以具有不同的幅度,从而可以相对于参考移动平均线调整波动的高度。 趋势检测:快速和慢速移动平均线表示周期的方向: Fast MA 大于 Slow MA 上涨阶段 绿色 lime Fast MA 小于 Slow MA 下跌阶段 magenta 红色 Fast MA 约等于 Slow MA 横向阶段 flat 橙色 蓝色 周期绘图:每个周期有三条独立的线: 上涨阶段 绿色 lime 下跌阶段 magenta 红色 横向阶段 flat 橙色 蓝色 可自定义的开始日期和时间:可以定义每个周期开始绘制
Quantum Momentum Guard (QMG) Breakout and Momentum Indicator for MetaTrader 5 Overview Quantum Momentum Guard (QMG) is a technical indicator for MetaTrader 5 designed to identify potential breakout opportunities by combining momentum analysis, breakout conditions, and mathematical validation. The indicator evaluates market conditions to generate directional signals when its configured criteria are met. It is designed primarily for XAUUSD (Gold) and can also be used on other financial instruments
作者的更多信息
Footprint Engine MT4
Francesco Mangili
Footprint Engine  MT4   is a synthetic technical analysis tool that provides an "X-ray vision" look inside a standard candlestick dataset. Three Visualization Modes Bid/Ask (Classic):  A two-sided profile displaying estimated buy and sell tick-volume distribution at each price level, reconstructed from 1-minute OHLC and tick-volume bars. Delta (Net Aggression):  A focused one-sided profile highlighting the Net Delta (market buys minus market sells) reconstructed from 1-minute OHLC and tick-volu
FREE
Footprint Engine Pro
Francesco Mangili
Footprint Engine Pro is a professional-grade technical analysis tool that provides an "X-ray vision" look inside a standard candlestick. It is designed to reveal hidden market dynamics and track liquidity activity with accuracy and precision. Three Visualization Modes Bid/Ask (Classic): A comprehensive two-sided profile displaying exact Bid and Ask volumes at each price level, revealing the direct battle between buyers and sellers. Delta (Net Aggression): A focused one-sided profile highlighti
Footprint Engine
Francesco Mangili
Footprint Engine is a technical analysis tool that provides an "X-ray vision" look inside a standard candlestick dataset. It is designed to reveal hidden market dynamics and track liquidity activity with precision. Three Visualization Modes Bid/Ask (Classic): A comprehensive two-sided profile displaying exact Bid and Ask volumes at each price level, revealing the direct battle between buyers and sellers. Delta (Net Aggression): A focused one-sided profile highlighting the Net Delta (market buy
Footprint LSTM
Francesco Mangili
Footprint LSTM is a machine-learning indicator that applies a Long Short-Term Memory (LSTM) network to sequential market data enriched with tick-derived footprint features. As a gated recurrent architecture, the LSTM maintains a persistent cell state regulated by differentiable forget, input, and output gates. This mechanism allows the network to selectively retain, update, or discard information across arbitrary time horizons, enabling it to capture complex temporal dependencies in order flow
Footprint MLP
Francesco Mangili
Footprint MLP transforms tick-level market activity into footprint features and uses a multilayer perceptron machine learning model to learn nonlinear relationships between order flow and future price behavior. It captures temporal context through lagged inputs, rolling statistics, multi-timeframe features, and paired-symbol data, with configurable training, chronological validation, and feature selection. Three Learning Modes Base Learn trains a model using the configured parameters; training
Footprint GBDT
Francesco Mangili
Footprint GBDT  is a machine-learning system that applies Gradient-Boosted Decision Trees to market data represented through tick-derived footprint features. Lagged observations, rolling statistics, and multi-timeframe inputs provide temporal context, while configurable training, chronological validation, feature selection, and paired-symbol data support model development and evaluation. Three Learning Modes Base Learn trains a model using the configured parameters; training runs across multi
筛选:
无评论
回复评论