Adaptive Correlation
- 实用工具
- 版本: 1.0

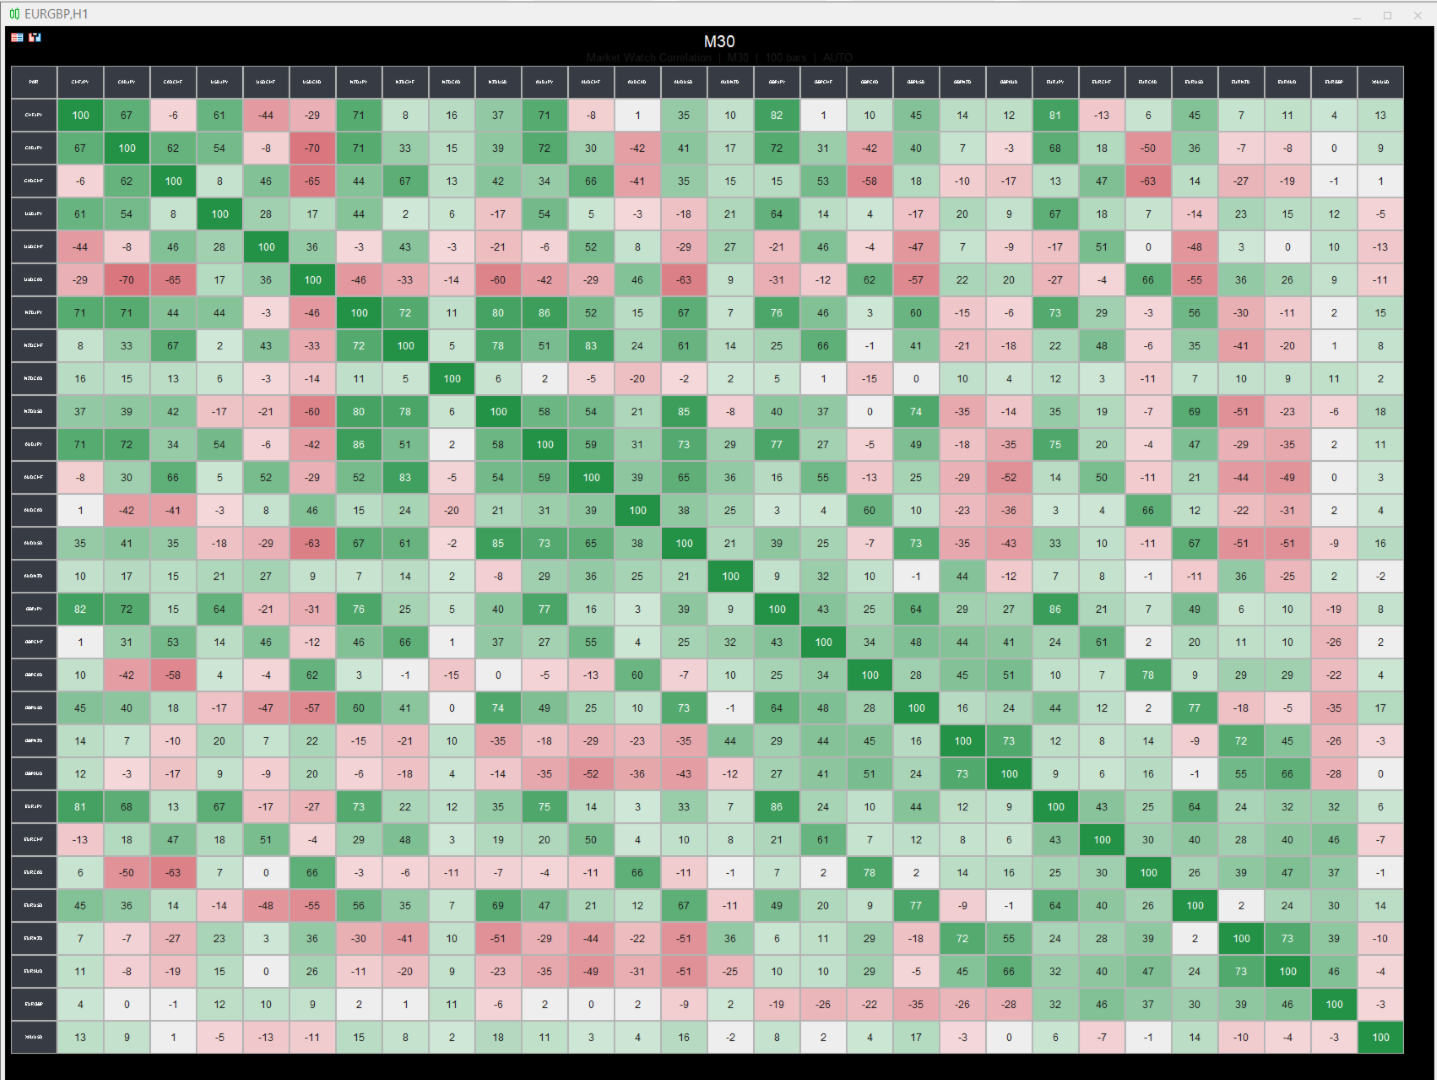
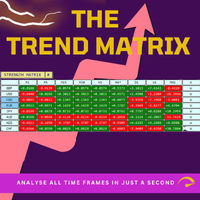
This indicator builds a live correlation matrix from the symbols currently selected in Market Watch. It calculates Pearson correlation on simple returns over a user-defined lookback and displays the results in a clean, auto-sized grid. Positive correlations appear in green, negative in red, and near-zero values stay neutral.
An optional automatic timeframe scanner cycles through only the timeframes you enable (M1, M5, M15, M30, H1, H4, D1, W1, MN1), updating the entire matrix at a set interval. The chart background can be fully nullified so the matrix stands alone.
Benefits
- Instant visual overview of how your watched instruments move together
- Helps avoid stacking highly correlated positions or spotting diversification opportunities
- Auto-sizing keeps the matrix readable on any chart size or monitor setup
- Timeframe rotation lets you scan multiple periods without manual switching
- Customizable colors, font size for symbols, and optional title/values/diagonal
- Clean presentation with the ability to hide price scale, grid, and candle colors
Limits
- Correlation is calculated only on the symbols present in Market Watch (up to the MaxSymbols limit)
- Requires sufficient historical bars on both symbols; pairs with missing data show “NA”
- The automatic timeframe cycle changes the chart’s period (it does not run multiple timeframes simultaneously)
- High symbol counts or very short update intervals increase CPU load during recalculation
- Results are based on simple returns of the selected lookback; they are not a guarantee of future co-movement
Key Feature Variables
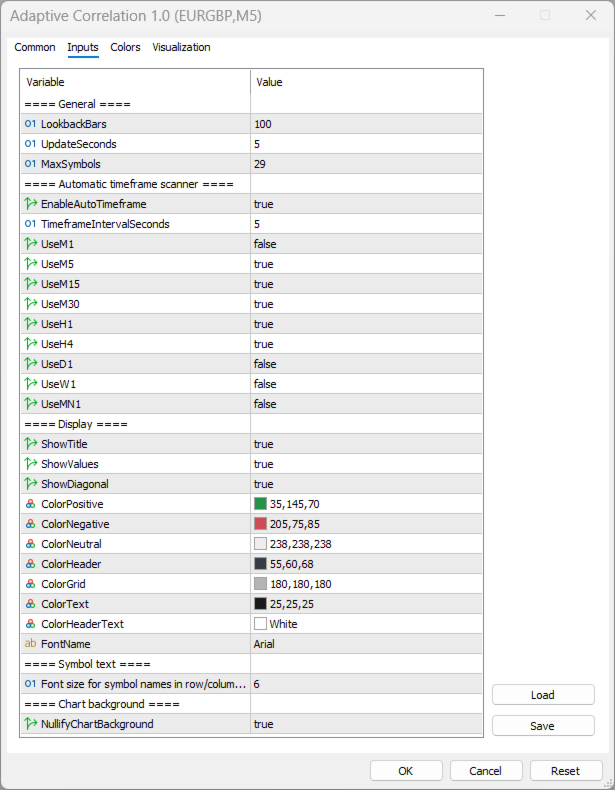
| Input | Default | Purpose |
|---|---|---|
| LookbackBars | 100 | Number of bars used to calculate correlation |
| UpdateSeconds | 5 | How often the matrix refreshes |
| MaxSymbols | 29 | Maximum number of Market Watch symbols to display |
| EnableAutoTimeframe | true | Turn automatic timeframe cycling on/off |
| TimeframeIntervalSeconds | 5 | Seconds between each timeframe change |
| UseM1 … UseMN1 | mixed | Select which timeframes are included in the cycle |
| ShowTitle | true | Display the title bar with timeframe and bar count |
| ShowValues | true | Show numeric correlation values inside cells |
| ShowDiagonal | true | Show the 100 values on the diagonal |
| SymbolFontSize | 4 | Font size for symbol names in headers |
| NullifyChartBackground | true | Hide price scale, grid, candles, and set background to black |
| ColorPositive / ColorNegative / ColorNeutral | green / red / light gray | Cell background colors based on correlation strength |