VWAP Breakout Entry

  • 指标
  • Ravi Shakya
    Ravi Shakya
    I’m Ravi Shakya, an MT5 developer with 5 years of trading experience in NEPSE and Forex. I use Smart Money Concepts (SMC) and price action to create simple and useful trading indicators, tools, and Expert Advisors.
  • 版本: 1.89
  • 激活: 10

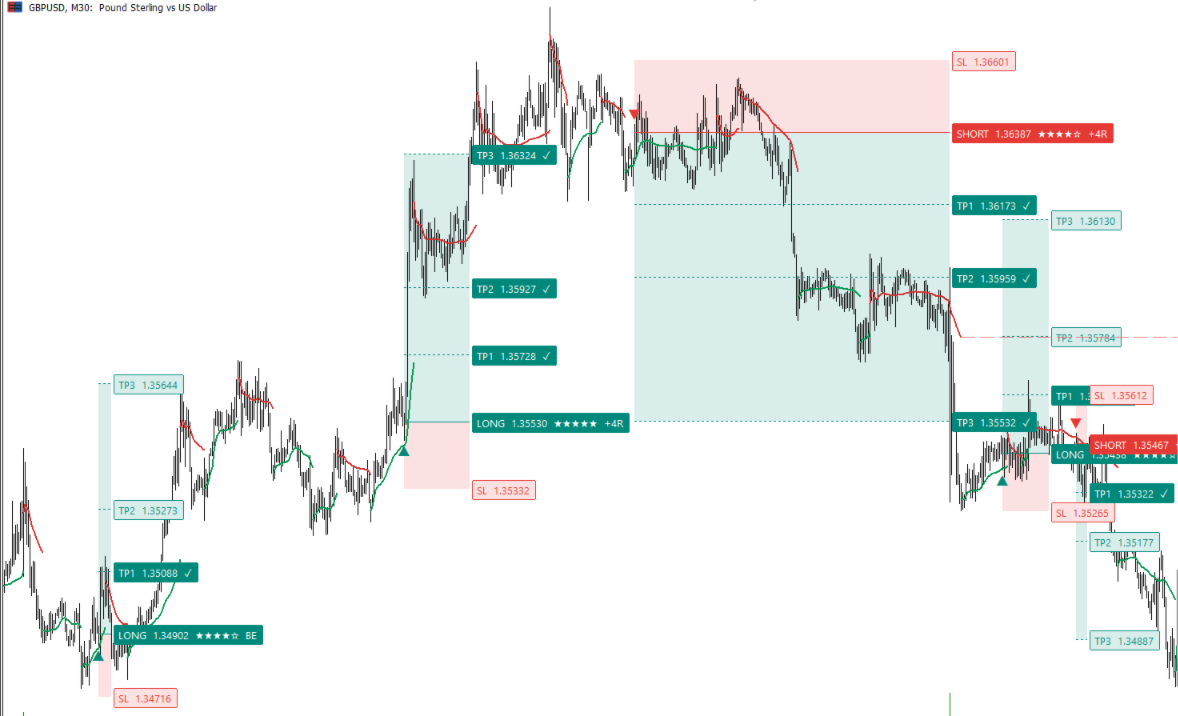
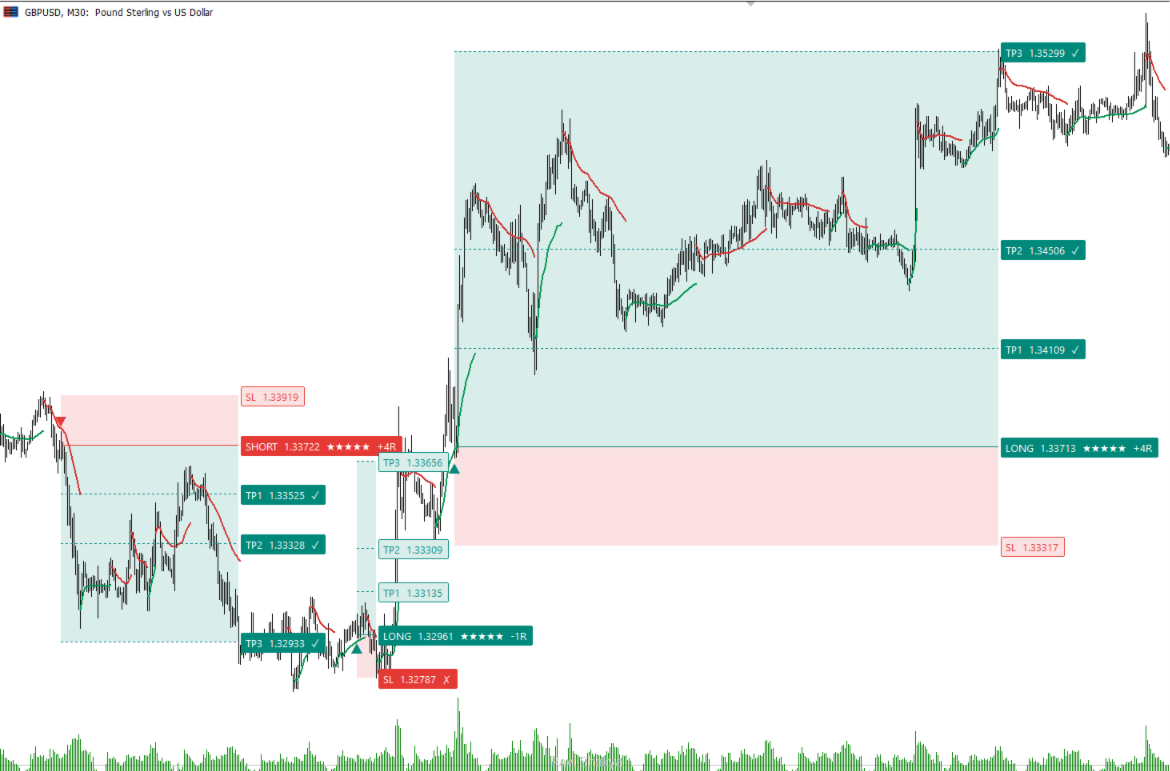
VWAP Breakout Entry draws an anchored VWAP from market structure pivots and marks trade entries when price retests it after a breakout. Every signal comes with a stop loss and three take-profit levels, and the chart shows the full trade the way a charting platform would.

Symbol : GBPUSD
Timeframe : M30 / 30 Minutes

Default settings are optimized for GBPUSD on M30

How it works

The indicator detects swing highs and lows and anchors a VWAP to the latest structure leg. When price breaks structure and then retests the VWAP, a triangle marker is placed on the chart together with the entry, stop loss and three take-profit levels. Each setup gets a strength score from 0 to 100, shown as stars.

Features

  • Anchored VWAP that follows the current leg, with a choice of swing, structure break or fast anchor modes
  • Retest entries with adjustable tolerance, bars-away check and rejection filter
  • Stop loss modes: ATR, wick or second band
  • Three take-profit levels, break-even and optional trailing stop
  • Entry strength score with a minimum-strength filter
  • Trading session filter, using broker server time
  • Optional higher timeframe trend filter
  • Limit on the number of retests per leg
  • Trade drawing with colored zones and price boxes for the open trade and for past trades, marked as TP or SL
  • Statistics dashboard on the chart with win rate, net R, profit factor, streaks and weekday breakdown
  • Alerts for new entries, take profit, break-even and stop loss, as popup and push notification

Dashboard

The table shows the current direction, the open trade as a price ladder, and the results of past signals counted as take profit or stop loss. A trade counts as take profit once TP1 is touched.

Recommended use

  • Works on any symbol and timeframe
  • Default settings are tuned for GBPUSD on M30 during the London session
  • Test the settings on your own symbol and timeframe before using them
  • Past results are shown for information only and do not predict future results

Notes

  • Push notifications need a MetaQuotes ID in the terminal settings.
  • Trading involves risk. This indicator does not guarantee profit.
  • For support, leave a comment on the product page or send a message on mql5.com.
作者的更多信息
SMC Market Structure MT5 PRO is a chart-based analysis indicator for MetaTrader 5 designed for traders who use Smart Money Concepts (SMC), Inner Circle Trader (ICT) concepts, market structure, liquidity analysis, and multi-timeframe price action. The indicator brings a comprehensive collection of SMC and ICT tools into a single chart, including Market Structure, Break of Structure (BOS), Change of Character (CHoCH), Order Blocks (OB), Fair Value Gaps (FVG), Inverse Fair Value Gaps (IFVG), Balanc
A volatility-contraction breakout EA built around a linear regression channel, with independent trend confirmation and a trading-session filter. Designed for GBPUSD on the H1 timeframe, trading the European/London session. Recommended Settings Symbol : GBPUSD Timeframe : 1H or 1 Hour HOW IT WORKS A linear regression channel is fitted to price over a configurable lookback period. The EA tracks the channel's bandwidth against its own recent range to distinguish between a market that is compressing
SMC Market Structure MT4 PRO is a chart-based analysis indicator for MetaTrader 4 designed for traders who use Smart Money Concepts (SMC), Inner Circle Trader (ICT) concepts, market structure, liquidity analysis, and multi-timeframe price action. MT5 version: SMC Market Structure MT5 PRO The indicator brings a comprehensive collection of SMC and ICT tools into a single chart, including Market Structure, Break of Structure (BOS), Change of Character (CHoCH), Order Blocks (OB), Fair Value Gaps (FV
An ICT / SMC indicator for MetaTrader 5. It waits for a liquidity sweep of PDH or PDL, then a market structure shift back inside the range, and plots the trade. Full documentation: Complete User Guide Chart Timeframe : 5 MIN / 15MIN Recommended Symbols : EURUSD, GBPUSD, AUDUSD, XAUUSD For GBPUSD , use the 15-minute timeframe . For all other symbols, use the 5-minute timeframe . The default settings are optimized for EURUSD on the 5-minute timeframe. For other symbols, you can download the corres
CISD Detector MTF marks Change in State of Delivery (CISD) levels on any symbol and timeframe, and shows the delivery state across eight timeframes in one panel. Overview In Smart Money Concepts (SMC) and ICT methodology, a CISD marks the moment price stops delivering in one direction and starts delivering in the other. It is often an early confirmation of a market structure shift (MSS) or change of character (CHoCH), and it usually appears before a classic break of structure (BOS). How it works
Discount Ends Soon — Next Price: $99 Session Range Breakout EA trades the opening range of a session and waits for price to come back before it commits. It does not enter on the break. When displacement takes price out of the range, the robot arms a pending limit order at the level and only takes the trade if price retests it. Euro Session Only You can find the .set files for the EURUSD / GBPJPY / USDJPY / US500  here   ---------------------------------------------------------------------------
Read the full documentation on the product blog: [ Complete User Guide ] How to Use it Chart Timeframe : 5 MIN Recommended Symbols : EURUSD, GBPUSD, NZDUSD, EURAUD The default settings are optimized for EURUSD on the 5-minute timeframe. For other symbols, you can download the corresponding .set files here . Marks the Asian session, waits for a liquidity sweep, and calls the entry the moment market structure confirms it. The SMC/ICT Asian Sweep Entry Model watches the Asian session range on your
Volume Divergence Pro shows whether volume confirms the trend and marks regular and hidden divergences on price and indicator. Volume Divergence Pro measures the direction of price with linear regression over a fast and a slow window, and checks whether trading volume is supporting that move or fading away from it. Swings in the indicator are compared with swings in price to find divergences, which are drawn both in the indicator window and directly on the candles. How it works The fast regressi
CISD - Change in State of Delivery indicator for MetaTrader 4. In Smart Money Concepts (SMC) and ICT methodology, a Change in State of Delivery (CISD) marks the moment price stops delivering in one direction and starts delivering in the other. It is often the first confirmation of a market structure shift (MSS) or change of character (CHoCH), and it usually appears before a classic break of structure (BOS) forms. This indicator detects CISD objectively on any symbol and timeframe, and shows the
SMT Divergence Multi Pair compares the swing highs and swing lows of the chart symbol with up to two correlated symbols and marks the places where they disagree. This is the Smart Money Technique (SMT) divergence used in ICT and Smart Money Concepts analysis: one market moves beyond a previous high or low while its correlated market does not confirm the move. How it works The indicator finds confirmed swing highs and swing lows on the chart symbol and compares each new swing with the previous on
A dual-timeframe trend engine with volume-weighted divergence and market structure confluence. Volume Divergence Pro plots two linear-regression trend readings — a fast one and a slow one — and colors each by whether the volume actively participating in that move is building or fading. On top of that trend picture, it detects regular and hidden divergences between price and momentum, and can require those divergences to agree with the prevailing market structure before showing them. Built for tr
SMT Divergence Multi Pair compares the swing highs and swing lows of the chart symbol with up to two correlated symbols and marks where they disagree. This is the Smart Money Technique (SMT) divergence used in ICT and Smart Money Concepts trading: one market sweeps a previous high or low while its correlated market fails to confirm the move. Discount Ends Soon — Next Price: $99 HOW IT WORKS The indicator finds confirmed swing highs and lows on the chart symbol and compares each new swing with th
Gold Smart Entry is a chart indicator for Gold (XAUUSD) based on Smart Money Concepts (SMC) and ICT ideas. It marks liquidity sweeps, confirms the reversal that follows, and highlights the entry zone at a Fair Value Gap (FVG) or Inverted Fair Value Gap (IFVG). For every setup it draws the suggested entry price, stop level and three target levels directly on the chart. The indicator does not open or manage trades. It is a visual analysis tool that shows where a setup forms and how it developed. I
HTF Candles PO3 SMC shows candles from a higher timeframe directly on your current chart, to the right of price. You can follow the forming 4H candle, or any other timeframe, while you trade on M5 or M15, without switching charts. The indicator is built for traders who use the Power of 3 concept (accumulation, manipulation and distribution) and Smart Money Concepts. Next to the candles it shows the levels that matter for this approach, so you can read the higher timeframe context at a glance. Wh
Symbol: EURUSD Timeframe: 30 minutes (M30) For other symbols or timeframes, adjust the settings to match the market. Volume Profile POC Breakout builds a volume profile from recent candles, finds the Point of Control (POC) and marks clean breakouts of that level. Each breakout is shown as a complete trade plan with entry, stop loss and three take profit levels, filtered by the higher timeframe trend and rated by a quality score. The indicator does not open trades. It is a visual and analysis to
筛选:
无评论
回复评论