Extreme Reading Frequency
- 指标
- 版本: 1.0
- 激活: 5

# Extreme Reading Frequency - How rare is this extreme
*Category: Oscillators | Difficulty: intermediate | Window: separate window below the chart | Markets: Universal (Forex, indices, commodities, crypto, stocks) | Suggested timeframes: M15, M30, H1, H4, D1*
## Short description
> Measures how frequently the oscillator has crossed the thresholds over recent bars. A rare extreme is informative, a frequent one is simply that market norm.
## Full description
### Overview
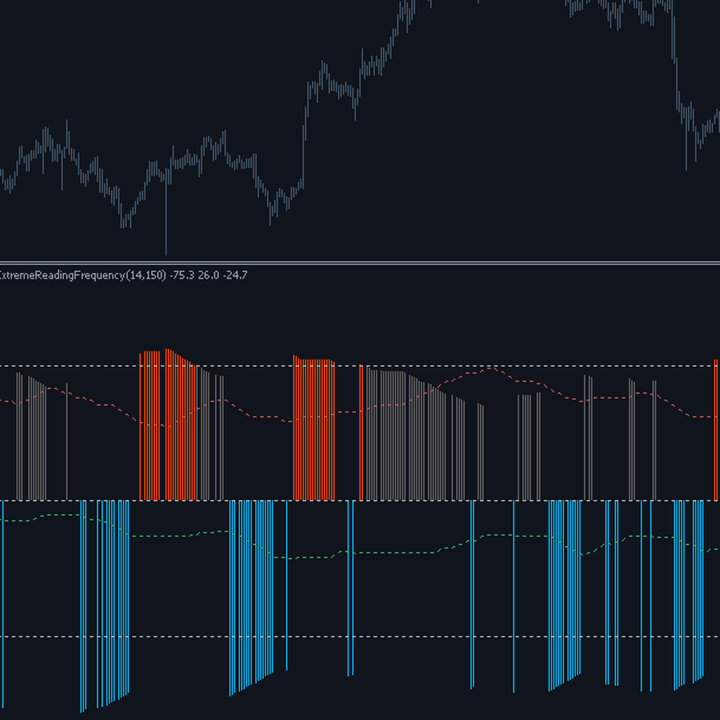
When an oscillator reaches an extreme, the question that matters is not whether it is high, but how rare it is for it to be so. If the overbought threshold is crossed on thirty per cent of bars, reaching it is not an event at all: it is simply that market norm in that phase, and trading it means trading at random. If it is crossed on two per cent of bars, the signal carries genuine information. This indicator measures precisely that frequency and turns it into a rarity measure, telling how much to trust your oscillator right now, something the oscillator itself cannot say because it does not know its own distribution. The two dashed lines separately show the frequency of upper and lower extremes, often very different from each other.
### How the calculation works
1. A reference oscillator measures the close position within the range of the last InpOscPeriod bars.
2. Over the InpFreqWindow window the number of bars crossing the upper and the lower threshold is counted.
3. The two frequencies are drawn as lines, the lower one below zero for readability.
4. If the oscillator currently sits at an extreme, the rarity is one hundred minus the frequency at which that extreme occurs.
5. Low frequency means a rare and therefore informative event; high frequency means the extreme is the norm and says nothing.
6. With the oscillator in the central zone there is no extreme to assess and the rarity stays at zero.
### How to use it
- Trade an overbought signal only when rarity is high: if the threshold is touched constantly, the signal has no value.
- The two frequency lines say whether the market spends more time high or low, useful information for choosing a preferential direction.
- Strongly asymmetric frequencies between high and low describe a market with a pronounced directional bias.
- A sudden rise in frequency signals the oscillator is entering saturation and losing discriminating power.
- Use it as a filter ahead of any overbought and oversold strategy, not as a standalone signal.
### Who it is for and on which timeframes
It targets oscillator users who want to know when to trust them, and system builders whose logic must switch off when signals lose value. It works from M15 to D1. The concept is simple but its correct use demands discipline, because it means declining to trade precisely when the oscillator looks clearest. It requires no mathematical background: counting how often a threshold was crossed is immediate.
### Practical example of reading a signal
On an equity index in H1 the oscillator reaches the overbought threshold. An inexperienced trader sells. Looking at the upper frequency line, however, shows that over the last one hundred and fifty bars that threshold was crossed thirty eight times, that is on twenty five per cent of bars: rarity is only twenty five and the histogram stays grey. In that market overbought is the ordinary condition and selling it makes no sense. Three weeks later, in a sideways phase, the same threshold is reached after being crossed only four times in one hundred and fifty bars: rarity is ninety seven, the histogram turns coloured, and that is the signal genuinely worth considering.
## Input parameters
| Parameter | Default | Description |
|---|---|---|
| `InpOscPeriod` | 14 | Period of the reference oscillator whose extreme frequency is measured. |
| `InpFreqWindow` | 150 | Window over which frequency is counted. Long windows give stable estimates but adapt slowly to a phase change. |
| `InpUpperLevel` | 75.0 | Upper oscillator threshold whose crossing frequency is measured. |
| `InpLowerLevel` | 25.0 | Lower threshold. If the two thresholds are inverted by mistake, the indicator reorders them automatically. |
| `InpRareLevel` | 60.0 | Rarity beyond which the signal is deemed reliable and the histogram is coloured. |
## Advantages / strengths
- It answers a question the oscillator itself cannot ask, because it does not know its own distribution.
- The two separate frequencies reveal market asymmetry, useful information for choosing a preferential direction.
- It avoids the most costly error made with oscillators, trading signals that repeat constantly.
- Light computation and no repaint.
## Limitations and warnings
- It provides no standalone signal: it is exclusively a filter to place ahead of existing logic.
- The frequency is measured on the recent past and can change quickly as the market regime shifts.
- It uses a fixed internal reference oscillator: anyone using a different one must account for that in the interpretation.
- Its correct use requires the discipline not to trade precisely when the oscillator looks most convincing.
**No repaint:** values printed on a closed bar are never modified afterwards.
**Disclaimer.** This product is a technical analysis tool, not an automated trading system, and it offers no profit guarantee whatsoever. Financial markets carry the risk of total loss of the invested capital. Past performance is not indicative of future results. Every signal must be confirmed with your own analysis, a money management plan and prior testing on a demo account. The author is not responsible for trading decisions taken on the basis of this indicator.
## Suggested tags / keywords for MQL5
`oscillator`, `frequency`, `rarity`, `filter`, `overbought`, `signal quality`, `no repaint`, `statistics`