Pivot Points Standard
- 指标
- 版本: 1.57
- 更新: 27 八月 2026

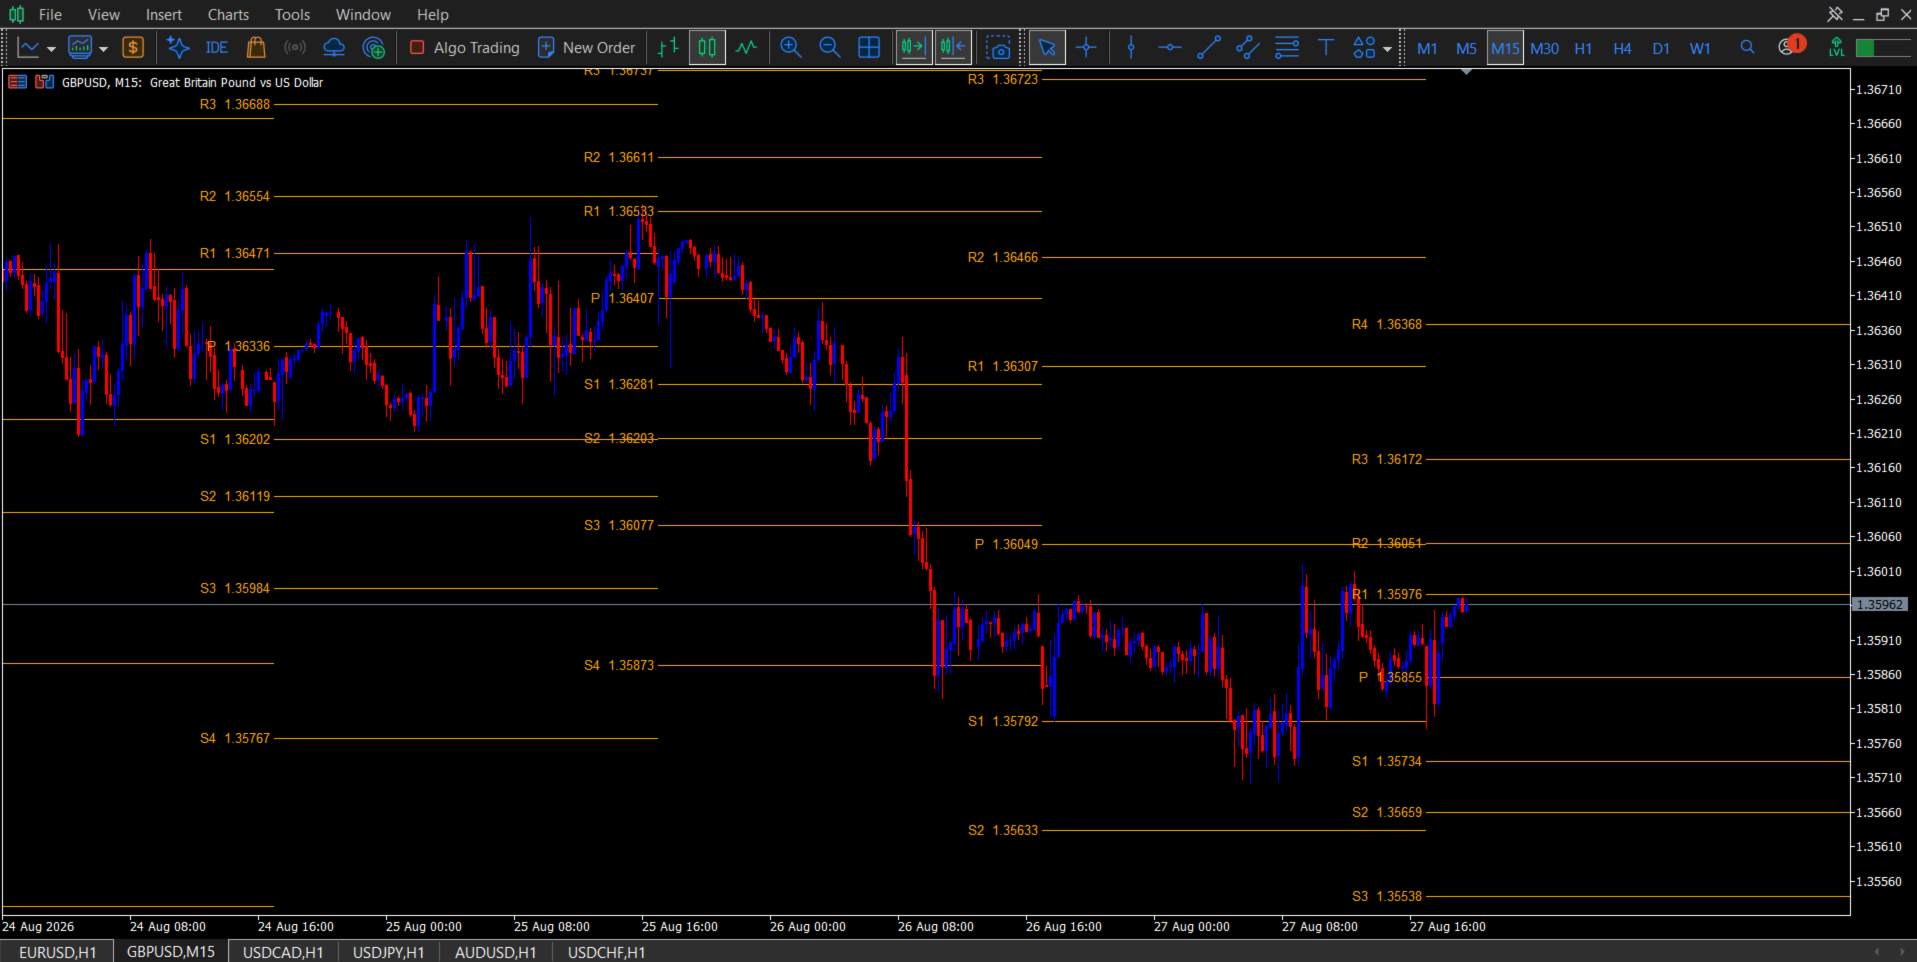
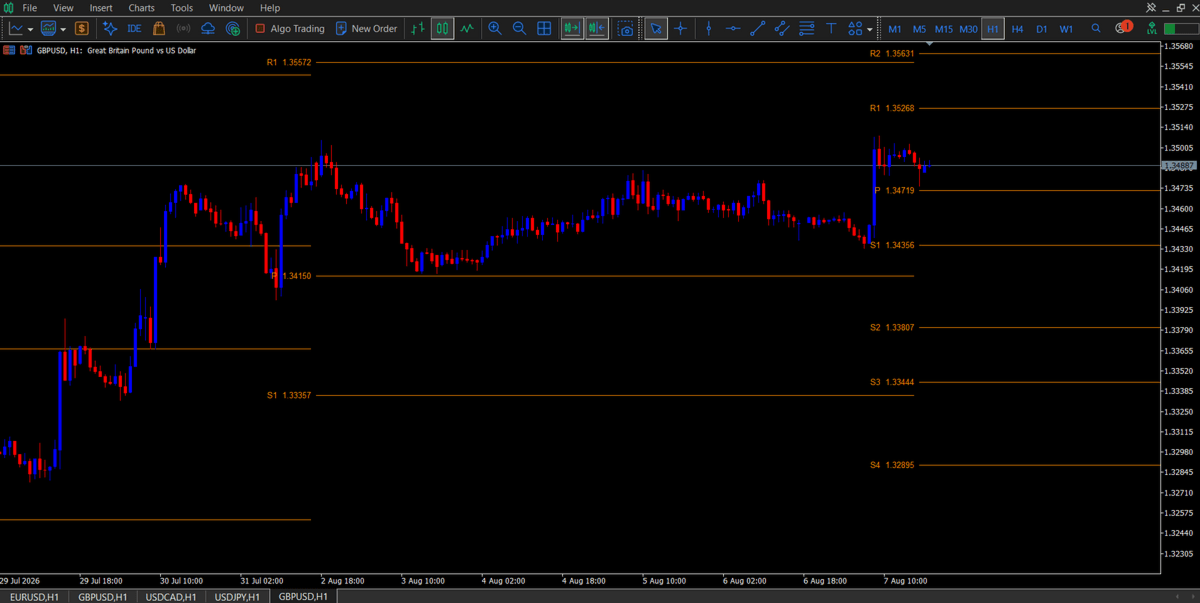
Pivot Points Standard Pro is a multi-timeframe pivot point indicator that automatically switches its calculation range based on the chart you're viewing, the near same auto-detection logic used by TradingView's Pivot Points Standard indicator once you've got your GMT + or - time zone with New York session start to end hours set, rebuilt natively for MetaTrader 5.
Input notes:
-Refer to the Baby Pips Market Hours website page for your GMT + or - time zone and New York session start to end time hours for the Session Ranges input setting so the 1-15 minute time frame pivot lines can reset correctly with the day, week, month, and year on higher time frames.
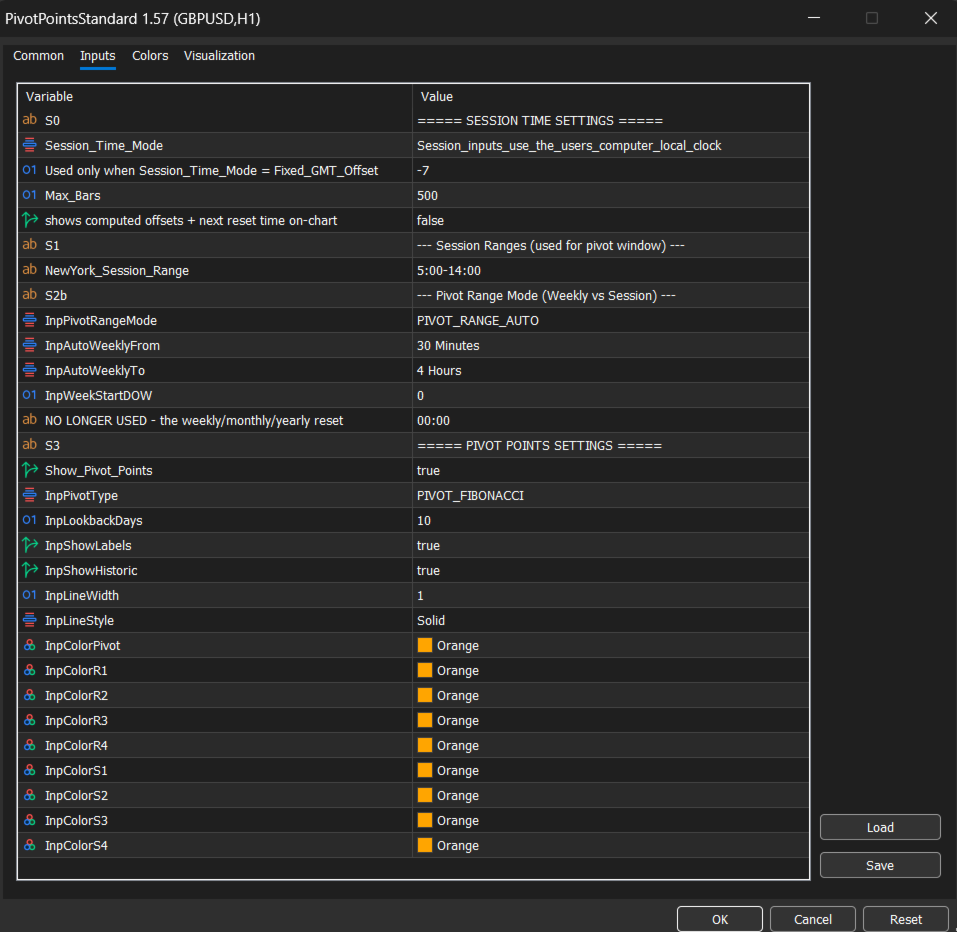
- You will need to change your GMT + or - time zone by a number during spring forward and daylight savings. For Example: My Pacific Time spring forward is GMT-7 and my daylight savings is GMT-8. Use my inputs in screen shots below for reference.
Instead of drawing the same daily pivot on every chart regardless of whether it makes sense, this indicator adapts:
- M1 to M15 charts: a fully configurable full day session range of New York session
- M30 to H4 charts: full weekly pivots, resetting every Sunday after the Friday close
- D1 charts: full monthly pivots, based on the previous calendar month's high, low, and close
- W1 and above: full yearly pivots, based on the previous calendar year's high, low, and close
All of this happens automatically as you switch timeframes. Every mode can also be locked manually if you prefer the same calculation on every chart regardless of timeframe.
Features
- 6 pivot calculation types: Traditional, Fibonacci, Woodie, Classic, DM (DeMark's), Camarilla
- Automatic range detection: session, weekly, monthly, or yearly, chosen per timeframe, fully overridable
- Configurable session windows for Tokyo, London, New York, and Sydney, plus a custom range built from any combination of session start and end points
- Accurate weekly reset anchored to the actual Sunday market reopen after the Friday close, not an arbitrary calendar Monday
- Broker server timezone offset so session, week, and month boundaries line up with your broker's clock
- Historic pivots: displays up to 10 previous periods (days, weeks, months, or years depending on mode) so you can see how price has reacted to past levels
- Full visual control: line width, line style, and independent colors for P, R1 through R4, and S1 through S4
- Optional price labels on every level
- Lightweight: draws with native chart objects only, no indicator buffers, minimal CPU load, redraws only on new bar, no repainting
How it works
1. The indicator reads your current chart timeframe and automatically selects the correct pivot range after setting your full day session start and end times accordingly to your session hours.
2. It pulls the high, low, close, and open (where the formula requires it) from the previous completed period in that range
3. It runs those values through your selected pivot formula and draws the resulting P, R, and S levels as horizontal lines across the current period
4. As soon as a new period begins, whether that's a new session, week, month, or year, it shifts the live pivot set forward and adds the just-finished period to the historic pivot stack
Session Time Settings
- Broker Server Timezone: offsets session, week, and month boundaries to match your broker's server clock
- Max Bars: how many bars back the indicator scans when building historic pivots
Input Settings:
1. You can go to the Babypips Forex Market Hours website page, select your time zone there to know your true GMT + or - time zone with start to end session hour times to input that information into your settings to get an accurate daily pivot point label with line reset on the 1-15 minute and higher time frames.
2. Since I originally intended for this indicator to use TradingViews pivot logic, the only session range needed is New York sessions start to end time for the 1-15 minute time frame daily pivots to reset according to that logic so the weekly, monthly, yearly pivots reset where they need to.
3. Use GMT for universal time or your GMT + or - time zones if you wanna switch them during spring forward or daylight savings instead of manually increasing your start to end session times by an hour with GMT. Since I'm in Pacific Time here in the US, I can use GMT, or GMT-7 for spring forward, and GMT-8 for daylight savings. Use my inputs in the screen shots below for reference.
4. If you're still having issues getting the right session end and start times, message the seller, and he will help you get them set up in your GMT time zone. If you don't get the start and end times set correctly, the 1-15 minute time frame pivots won't set or reset correctly and the higher time frames might not either.
Session Ranges
- Tokyo, London, New York, and Sydney session ranges: define the start and end time of each named session, used when the indicator is in Session range mode
- Custom Range From / To: build your own session window out of any combination of the session start and end points above
Pivot Range Mode
- Pivots Range Mode: Auto, Session, Weekly, Monthly, or Yearly.
- Auto Weekly From / To: the timeframe band (default M30 to H4) that receives weekly pivots in Auto mode; widen this if you also trade H6, H8, or H12
- Week Start Day / Time: defaults to Sunday 00:00 to match the forex week reopen; adjust if your broker's week starts differently
Pivot Points Settings
- Show Pivot Points: turns the whole indicator on or off
- Pivot Type: Traditional, Fibonacci, Woodie, Classic, DM, or Camarilla
- Lookback Periods: how many historic periods to keep drawn on the chart (1 to 10)
- Show Pivot Labels: toggles the price label on each level
- Show Historic Pivots: toggles whether past periods are drawn at all, or only the current live pivot set
- Pivot Line Width / Style: cosmetic controls for every drawn line
- Individual colors for P, R1, R2, R3, R4, S1, S2, S3, and S4
Recommended use
Pivot levels are widely used as reference points for potential support, resistance, and mean-reversion zones. This indicator is a charting and analysis tool: it does not place trades, send signals, or require algo-trading permissions, it only draws objects on your chart. Combine it with your own entry, exit, and risk management rules.
Compatibility
- MetaTrader 5, any build
- Works on any symbol and any broker: forex, indices, metals, crypto CFDs
- No external DLLs, no internet connection required
Support
Questions, feature requests, or a bug report? Message me through the MQL5 seller contact form and I'll get back to you.