Atropos X

5
Atropos X

Multi-Engine Signal & Market State Indicator for MetaTrader 5

Atropos X is a professional MT5 indicator built for traders who want more than basic buy and sell arrows. It combines two signal engines, multiple confirmation filters, Linear Regression visual context, and a live market state panel into one clean trading workspace. (user guide and manual)

Instead of loading your chart with many separate indicators, Atropos X brings signal, trend, momentum, volatility, and market-condition tools together inside one flexible indicator.

Build your own signal environment. Read the market faster. Trade with more structure.

Why Atropos X?

Many traders use several indicators at the same time: one for signals, one for trend, one for momentum, one for volatility, one for choppy market detection, one for ATR, and another for confirmation. After a while, the chart becomes crowded and harder to read.

Atropos X was designed to simplify that process. It gives you a structured all-in-one workspace where you can choose your signal engine, enable or disable filters, check live market readings, and adjust the setup based on the instrument and timeframe you trade.

This makes Atropos X useful for both newer traders who want a cleaner structure and experienced traders who want more control over signal confirmation.

Two Signal Engines

Atropos X includes two popular signal engines:

UT Bot Engine — A fast and responsive engine commonly used by traders who prefer active signal behavior and clear directional changes.

Range Filter Engine — A smoother alternative that helps traders focus on filtered price movement and reduce some unnecessary market noise.

You can choose the engine that better fits your market, timeframe, and trading style.

Build Your Own Signal Setup

Atropos X is not a rigid black-box indicator. It allows you to shape the signal behavior using optional filters and confirmation tools. Depending on your strategy, you can keep the setup simple or make it more selective.

Available tools include:

  • EMA trend filtering

  • RSI condition filtering

  • MACD confirmation

  • ADX strength filtering

  • Stochastic filtering

  • Choppiness filtering

  • ATR hot-market blocking

  • Volatility regime filtering

  • Time control

  • Linear Regression visual context

This flexibility allows traders to test different combinations and adapt the indicator to different instruments, sessions, and market conditions.

Live Market State Panel

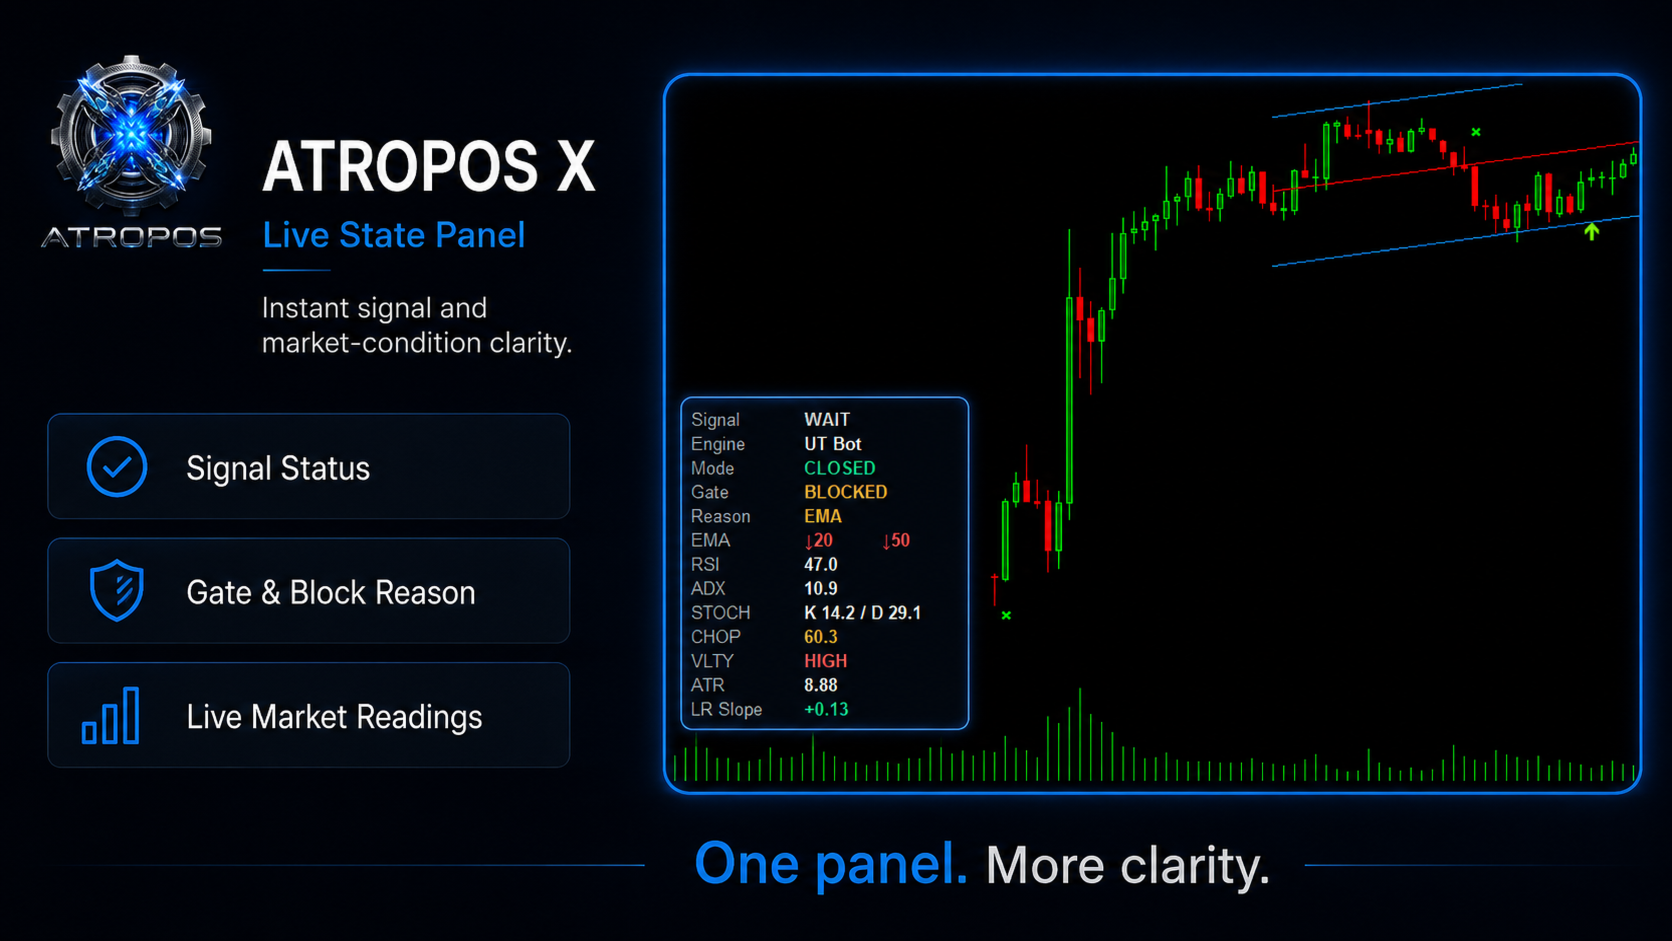
The built-in state panel summarizes important readings directly on the chart, helping you understand the current market environment without adding many separate indicators.

The panel can show:

  • Current signal state

  • Active engine

  • Signal mode

  • Gate status

  • Block reason

  • EMA direction

  • RSI

  • ADX

  • Stochastic K/D

  • Choppiness

  • Volatility state

  • ATR

  • Linear Regression slope

Linear Regression Context

Atropos X includes a Linear Regression visual tool that can help provide additional context for market structure, trend direction, price location, and general behavior around the signal area.

This gives traders more context instead of relying only on arrows.

Works Across Multiple Markets

Atropos X can be tested and used across different instruments, including:

  • Gold

  • Silver

  • Forex pairs

  • Indices

  • Oil

  • Crypto

  • Other CFD instruments

It can also be used on different timeframes depending on the trader’s style.

Practical Ways to Use Atropos X

You can use Atropos X as:

  • A direct signal indicator

  • A filtered signal indicator

  • A confirmation tool

  • A market-state dashboard

  • A trend and momentum assistant

  • A cleaner replacement for several separate indicators

  • A flexible research tool for testing signal combinations

Some traders may prefer simple engine signals. Others may prefer stricter confirmation using filters. Atropos X supports both approaches.

Who Is It For?

Atropos X may be useful for:

  • Traders who want cleaner charts

  • Traders who use technical confirmation before entries

  • Traders who want to compare signal engines

  • Traders who trade multiple symbols or timeframes

  • Traders who prefer customizable setups

  • Beginners who want a structured signal environment

  • Experienced traders who want more control over filtering

Important

Atropos X is a trading indicator and decision-support tool. It does not guarantee profits and it does not replace risk management.

Every trader should test settings carefully on the symbols and timeframes they trade. Market conditions change, and no indicator should be used blindly.

Final Note

Atropos X was built as a professional trading asset, not just another arrow indicator. It combines signals, filters, market readings, and visual context into one practical MT5 workspace.

If you want one indicator that helps reduce chart clutter, test different signal setups, and read the market with more structure, Atropos X was designed for that purpose.


评分 1
Oussama Anezha
145
Oussama Anezha 2026.08.19 11:04 

I have been using Atropos X for a while now and I have to admit that at the beginning I underestimated it. I thought it was just another signal indicator, but after spending time with it and actually reading the manual, I understood that this is really not the point of the product. What I like most is that before Atropos X I had several indicators and tools open on my charts. Now I can keep the chart much cleaner and read most of what I need directly from the state panel. The other big advantage for me is the flexibility. You are not forced to use one fixed signal setup. You can build and adjust the signal according to the symbol, timeframe and market condition you are trading. This is where the indicator became really useful for me. I started with some of the settings shared by the developer and then adjusted them based on my own experience, especially depending on the market and how I wanted to handle targets and exits. My advice is: don't buy this and spend five minutes with it and think you understand it. Read the manual, read the article and learn what every setting actually does. Once I did that, my opinion of the indicator changed completely. I would say it is more suitable for traders who already understand technical indicators and want more control. A beginner can definitely learn a lot from it, but this is not just a simple indicator where you blindly follow an arrow. Support has also been very good. Whenever I had questions, I received quick answers, and I also appreciated that useful settings and ideas were shared publicly in the comments instead of keeping everything hidden. For me Atropos X became more of a trading tool than just an indicator. It helped me remove a lot of unnecessary tools from my charts while still giving me the freedom to build the kind of signal I want. Definitely worth taking the time to learn properly. Thank you Ahmad so much for this Product and your Support !!!

推荐产品
Impulse fractals indicator - is counter-trend oriented complex market fractal pattern.  Market creates bull/bear impulse, trend starts, fractals on impulsed wave are an agressive pullback signals. Buy arrow is plotted when market is bearish and it's impulse showed up-side fractal, and sell arrow is plotted when market is bullish and it's impulse showed dn-side fractal. Main indicator's adjustable inputs : impulsePeriod - main period of impulse histogram  filterPeriod  - smoothes impulse accordi
Woodie CCI MTF Plus The Woodie CCI MTF Plus is an advanced, multi-timeframe trading engine engineered to eliminate chart clutter and trading hesitation. Expanding on Ken Wood’s core methodology, this upgraded system integrates the classic Woodie CCI engine with a Dynamic Multi-Timeframe (MTF) Dashboard , Trend Age Tracking , and Consensus Background Alignment Alerts,  giving you full higher-timeframe context on a single chart. Core Trader Questions Answered What is the global market trend ac
UNIVERSAL MARKET LEVELS 2026 手动绘制关键水平位需要花费大量时间,并且不同的交易者通常会得出不同的结果。该指标可直接在图表上自动绘制清晰的关键水平。 7 种类型的水平 前一日水平(最高价 / 最低价 / 收盘价) 历史水平(价格反应强烈区域) 镜像水平(支撑位变成阻力位) 限价水平(价格由大订单维持) 异常波动K线形成的水平(ATR较高的强脉冲运动水平) 首小时水平 (NYSE) — 这些水平通常能阻止纽约时段开盘后波动最剧烈的走势,即使在困难的市场条件下也能发挥作用 缺口水平 — 价格缺口后的不平衡区域 您不需要手动绘制任何内容 — 所有内容都已经显示在图表上。 方法 — 市场逻辑 Universal Market Levels 根据著名交易者和领先自营交易公司的培训材料中描述的方法识别图表上的关键水平。 它可用于日内交易、波段交易、盘中交易、超短线交易甚至投资。 为什么选择它 节省时间,允许您快速评估市场情况,并帮助您查看重要区域,而无需不必要的指标。 代替冗长的准备工作 — 只需几秒钟。 它如何帮助交易 您打开图表,立即看到: 价格可能停止的位置 可能
CrossPluse Dynamic ATR
Steven Wong Sing Seng
CrossPulse Dynamic ATR CrossPulse is an automated Expert Advisor for MetaTrader 5 that combines classic MACD crossover signals with ATR-based recovery position management. It is built for traders who want a rule-based scalping system with clear entry logic and configurable risk limits. HOW IT WORKS ENTRY (new position) • Long: MACD golden cross confirmed on the previous bar (MACD line crosses above Signal). • Short: MACD death cross confirmed
Manyal trading system, CovEchoTrend Robot, focuses on reliability and flexibility. By employing statistical analysis methods to study the relationships between the base indicator and market patterns, the system enables a deeper understanding of market processes. Intelligent pattern analysis: The application of statistical data processing helps identify key trend reversal points more accurately, signaling significant market shifts. Informed decision-making is based on the intersection of indicato
GoldEdge Pro Showtime
Vittaya Klangpimanarkart
GoldEdge Pro – Smart Pullback Trading System GoldEdge Pro is an advanced Expert Advisor designed for XAUUSD, focusing on pullback and dip-detection strategies within established market trends. The system is built to identify temporary price retracements and execute trades with structured confirmation and risk control. Core Trading Concept GoldEdge Pro is based on a pullback trading methodology: 1. Dip Detection Engine The system identifies short-term market retracements using EMA alignment (8 /
MarketMagnet
Kelly Adediran Raymond
Are you ready to take your trading journey to new heights? Look no further than MarketMagnet, this groundbreaking indicator designed to propel your trading success with excitement and accuracy. Powered by the convergence of Momentum and CCI (Commodity Channel Index), MarketMagnet equips traders with the ultimate tool to determine direction and entry prices for a wide range of recommended currency pairs and instruments. It is designed for traders seeking to scalp for a few pips on lower timeframe
Tabajara Rules II The Best for MT5
Samuel Manoel De Souza
4.9 (10)
Tabajara Rules for MT5 , based on Professor André Machado’s Tabajara Setup, indicates the market direction using moving averages when there are candles aligned with the direction of the moving average. The indicator contains the color rule applied to the candles and the moving average. It allows changing the parameters: period and smoothing method of the moving average. It also allows changing the colors of the candles (borders and filling) and of the moving average. Professor André Machado’s
FREE
VibeFox Squeeze Detector — 挤压压缩、动量与入场点 VibeFox Squeeze Detector 是一款用于 MetaTrader 5 的实时 Squeeze Detector 指标。它能够识别市场压缩进入狭窄区间的时段,并测量水面之下不断累积的动量,让你能在市场突破束缚的那一刻立即行动。经典的挤压逻辑和动量直方图位于独立的子窗口中,入场标记则直接落在价格图表上,所有控件都集中在一个现代化的交互式面板里。 指标测量的内容 核心思想是比较两条以不同速度扩张和收缩的波动率通道。 Bollinger Bands 对波动率反应迅速:当它们在 Keltner Channel 内部收窄时,市场便进入了挤压——这是一段被压缩的区间,能量在方向性行情到来之前不断累积。一旦 Bollinger Bands 重新扩张到 Keltner Channel 之外,挤压便被释放,行情很可能正在展开。 动量直方图 量化了这股能量。它由价格相对中线位移的线性回归构建,因此不仅显示动量是正还是负,还显示动量是在加速还是在衰减。零线之上不断升高的绿色柱表示看涨动量正在增强;下降的绿色柱表示其
Alpha One MT5
Burak Baltaci
Alpha One MT5 - 進階趨勢偵測系統 Alpha One 是一款專業的趨勢跟隨指標,能提供清晰的買入與賣出訊號,並在圖表上直接繪製自動進場點、停損點及三級獲利了結點。 本指標採用獨特的能量場視覺化設計,由15條動態線構成,透過綠紅雙色變換即時反映趨勢強度與方向。綠色能量代表多頭主導,紅色能量則顯示空頭壓力,讓您瞬間掌握市場動能走向。 訊號系統 訊號生成採用多層級確認機制,透過多重獨立分析維度解析動能轉變。每項訊號需經多個組件共同驗證後,方會顯示於圖表。 無重繪保證 所有訊號僅基於已確認收盤K線計算。訊號一旦生成,絕不移動、變更或消失。歷史數據所呈現的即為即時市場真實訊號,回測結果與實盤表現完全吻合。 交易管理 每項信號均包含自動計算的關鍵位階: - 確認收盤價作為進場點 - 止損位設於最近分形波動點 - 獲利點1採用1:1風險報酬比 - 獲利點2採用1:2風險報酬比 - 獲利點3採用1:3風險報酬比 核心功能 - 適用所有交易標的:外匯、黃金、指數、加密貨幣、股票 - 適用所有時間框架:M1至MN1 - 內建買入/賣出警報通知 - 可調整靈敏度以適應不同市場狀況
MSNR Precision Entry Pro Short description Rule-based MSNR support/resistance engine with freshness tracking, SBR/RBS role-reversal, liquidity sweep detection, market structure (BOS/MSS) and a non-repainting confluence-scored entry signal. Full description: MSNR Precision Entry Pro is a non-repainting MetaTrader 5 indicator built around the MSNR (Market Structure & Support/Resistance) methodology: trading from well-defined price zones only after they show a genuine reaction, not simply because
Ziva LSE Pro
Hassan Abdullah Hassan Al Balushi
ZIVA LSE Pro: Trade the Flow, Not the Noise ZIVA LSE Pro was developed around a simple belief: professional traders do not need more random signals; they need better context. This workflow reflects the ZIVA approach to filtering market noise and focusing on the liquidity and structural mechanics that influence price behavior. Most indicators treat the market like a static picture. ZIVA LSE Pro is built to read it as a dynamic environment where liquidity, structure, volatility, and execution con
TradePilot Execution Utility The Ultimate Execution & Risk Management Dashboard TradePilot Execution Utility is a high-performance trade management dashboard built specifically for professional manual traders and those undertaking Prop Firm challenges . It bridges the gap between complex risk mathematics and rapid execution, ensuring you never miss a setup or over-leverage your account. 1. Visual Risk-Based Lot Sizing Forget manual calculators. TradePilot uses your chart as the primary interface
Vertex Structure Dashboard delivers a complete multi-timeframe market structure analysis in a single, compact panel. It monitors up to 9   timeframes simultaneously and displays trend bias, structural breaks, momentum, and value zones in real time — no tab-switching, no manual   tracking.   The panel is fully draggable and collapsible. Its position persists across timeframe changes through GlobalVariables, so your layout stays   exactly where you placed it.   How It Works   Each enabled tim
SB Bot Alerts 是一款以 ATR 動態追蹤停損線 為核心的趨勢訊號指標,主要用來協助交易者快速辨識市場方向轉換與潛在進場機會。 指標會根據市場波動自動調整追蹤線位置,當價格由下往上突破動態追蹤線時,產生 BUY 訊號 ;當價格由上往下跌破追蹤線時,產生 SELL 訊號 。 本指標適合用於外匯、黃金、指數、加密貨幣等不同市場,也可作為趨勢判斷、進場確認或其他交易系統的輔助工具。 主要功能 自動計算 ATR 動態追蹤停損線 顯示 BUY / SELL 訊號 支援不同 ATR 週期設定 可調整靈敏度參數 支援一般 K 棒與 Heikin Ashi 訊號來源 可自由開啟或關閉交易訊號 可依趨勢方向改變 K 棒顏色 支援訊號警報提醒 適用於不同商品與時間週期 訊號邏輯 當價格由下往上穿越 SB 動態追蹤線時,指標會產生 BUY 訊號;當價格由上往下穿越 SB 動態追蹤線時,則產生 SELL 訊號。 靈敏度參數越小,追蹤線通常越靠近價格,訊號會較敏感;靈敏度參數越大,追蹤線距離價格越遠,訊號通常會較穩定。 Heikin Ashi 模式 使用者可選擇是否使用 Heikin Ashi 價格
Eng Gold
Ely Alkrar Xshkaky
ENG-GOLD Scalper It is an auxiliary indicator that identifies potential targets and determines the place of entry with a stop loss that works on Heiken Ashi candles  The green lines are usually the targets, the red lines are the stop loss, and the yellow lines are the entry location.  This file is recognized on small and medium frames, usually less than the watch frame I highly recommend using XAUUSD Nasdaq100 Dow30 USOIL 
The chaos wave
Letlhogo Mokgatle
This is the best indicator we have created by far, this indicator replicates the well known heiken ashi indicator,  but with a more precise entry point, this indicator can work on all time-frames and is strong on all the time frames , this indicator does not repaint nor does it lag , this indicator strategy combined with price action will change your trading experience , elevate your experience to the next level.
A useful and convenient tool for traders when analyzing and making decisions. Peculiarity The main feature of this indicator is its fast algorithm . The gain in the speed of calculating the polynomial and its value of the standard deviation in comparison with classical algorithms reaches several thousand times. Also, this indicator includes a Strategy Tester with a clear visualization of transactions, an equity chart and simultaneous calculation and display of the following data in the form of
EMA Scalper Indicator
Yosi Malatta Madsu
EMA Scalper Indicator is an indicator of EMA lines and reversal EMA lines. Each pair of EMA channels area that can be used to make reversal entry. After the EMA lines are widening because of major trend, the area can be used to find profitable entry and exit, especially after EMA reversal. Do the cut loss whenever candle closed outside the area. The A, B, C, D, and E area are colored differently. Solid lines: Normal EMA lines. Dashed lines: Reversal EMA lines.
了解价格可能寻找流动性的位置 Liquidity Reaction Map MT5是一款基于图表的市场分析指标。它根据已确认的价格结构识别潜在的买方流动性区域和卖方流动性区域。 该指标将摆动高低点、等高点和等低点、前一日和前一周高低点、交易时段极值以及心理整数价格整合到一个清晰的流动性地图中。相互接近的价位可以合并,并根据强度、与当前价格的距离以及多个来源的一致程度进行排序。 该指标帮助交易者分析价格可能接近、扫过、拒绝或突破流动性区域的位置。它不会开仓或管理交易。 流动性来源 流动性地图可以从以下来源识别流动性: 已确认的摆动高点和低点 等高点和等低点 前一日高点和低点 前一周高点和低点 已完成交易时段的高点和低点 心理整数价格水平 多个可配置时间周期 买方流动性显示在相关高点上方,卖方流动性显示在相关低点下方。 这些区域是根据历史价格结构计算的估计值。该指标不会访问经纪商订单簿或真实的止损持仓数据。 排序后的流动性区域 检测到的价位会根据以下多个因素进行评估: 支持该价位的枢轴点数量 等高点或等低点的聚集程度 多个来源的一致性 时间周期的重要性 与当前价格的距离 价位的新鲜度 相互
VP RSI Reversal Signal Arrows — Product Description Short Description VP RSI Reversal Signal Arrows is a clean MetaTrader 5 indicator that displays buy and sell reversal arrows when RSI exits oversold or overbought zones, with an optional moving average trend filter. Main Description VP RSI Reversal Signal Arrows is a visual technical analysis indicator for MetaTrader 5. It is designed for manual traders who want a simple RSI-based reversal assistant directly on the price chart. The indicator
Cyclic Impulse MT5 — 此技术指标可构建图表结构并识别周期性价格波动。它能帮助您找到反转周期性价格波动和入场信号。 指标工作原理 当检测到周期性下跌时,K线收盘后会生成一根蓝色下跌柱。该柱可能会在当前K线中闪烁,表示信号尚未确认。蓝色箭头会在价格图表上重复显示。 当检测到周期性上涨时,K线收盘后会生成一根红色上涨柱。该柱可能会在当前K线中闪烁,表示信号尚未确认。橙色箭头会在价格图表上重复显示。 可用于任何图表、时间周期和交易品种。 多种警报类型。 价格图表上会显示额外的箭头。 不会在历史数据上重绘;它基于K线收盘进行操作。即使K线收盘,箭头或柱也不会消失。 参数易于使用和配置,不会在图表上显示不必要的信息。 建议使用两个参数不同的指标。较高的参数值有助于判断趋势,而较低的参数值则有助于寻找入场信号。 可以手动输入参数,这些参数与图表结构处理配合使用。 “ Cyclicity ”——该参数(2-5)调节反转周期变化的频率,从而触发周期方向的变化。 此参数更为重要。提高此参数有助于识别长期价格走势,而降低此参数则有助于发现短期脉冲,从而在一个长周期
Mac Rider Gold
Ignacio Agustin Mene Franco
MacRider GOLD is a professional grid-based Expert Advisor (EA) specifically designed for XAUUSD (Gold). It combines MACD signal filtering with dynamic trailing stops and advanced money management. The EA uses the MACD indicator to detect trend direction before placing pending orders, filtering out low-quality entries and focusing on high-probability setups. The grid system places BUY STOP and SELL STOP orders at configurable distances, while automatic profit closing and dynamic trailing stops
Allgain100
Nissar Ahmed
Key Features Strategy Core EMA Crossover System : Fast EMA (default: 20) and Slow EMA (default: 50) Generates buy signals when Fast EMA crosses above Slow EMA. Generates sell signals when Fast EMA crosses below Slow EMA. Fibonacci Filter : Calculates Fibonacci retrenchment levels (23.6%, 38.2%, 50%, 61.8%, 78.6%) based on recent price swings. Requires price to be near a Fibonacci level (configurable threshold) to validate trades. Risk Management Position Sizing : Dynamically calculates lot size
PRO 挤压动量 & 多信号仪表板 (五合一) 厌倦了把您的图表变成指标垃圾场吗? 来看看这款“终极”分析工具吧!它将市场波动性、趋势方向、瞬时动能和精准的买卖信号完美整合在单个副窗口中! 该指标将约翰·卡特 传奇的   挤压动量 (Squeeze Momentum)   策略与零延迟的   拉盖尔 RSI (Laguerre RSI)   相结合,并加入了 PSAR、RSI 交叉和 MACD 的确认信号。只需一眼,您就能彻底看透市场。 核心亮点 (功能模块) 1. 增强版挤压动量 (可缩放柱状图) 通过测量布林带和肯特纳通道之间的收敛,探测市场中“即将爆发”的能量。 零线颜色:   黑色(市场正在蓄力/挤压中),蓝色/灰色(挤压释放,突破发生)。 彩色柱状图:   显示动能的方向和强度。 特殊插件:   可通过“缩放系数”放大柱状图,使其更易于阅读。 2. 拉盖尔 RSI (零延迟) 与传统 RSI 不同,它采用了高级平滑滤波器。对价格波动的反应更快,能有效过滤震荡市场中的虚假信号。 清晰标记了   超买 (0.8)   和   超卖 (0.2)   区域。 3.
Trendicator
Nico Deuscher
Functions Analyzes the current market trend Displays a numbering system based on trend structure (see below) Colors the chart background depending on trend direction Displays the ZigZag indicator Display Fibonacci Retracement with custom defined levels at the lates corrective trend movement Display Fibonacci Expansions with custom defined levels at the latest progressive trend movement Buffers for all relevant Trend parameters so EAs can access the trend information Background Information The
Nexus Target Pro Indicator Product Overview Nexus Target Pro is a technical indicator designed for breakout zone analysis. The tool charts a dynamic breakout box based on user-defined time ranges and plots arrow signals when price breaks out of the established zones. Technical Features Signal Generation: Displays non-repainting breakout direction arrows on the chart. Target Levels: Plots up to 5 calculated profit target levels based on the breakout box structure. Risk Levels: Displays a sugges
MTF Isolator EMA
Jake Jesus Herrera Turizo
Características Principales 1. Medía Móvil Multi-Timeframe (MTF) con Estabilidad Temporal EMA Macro ( InpMATimeframe ): Permite proyectar y visualizar en el gráfico actual una Media Móvil Exponencial (EMA) calculada desde una temporalidad superior (por defecto en gráfico diario PERIOD_D1 ). Independencia de Temporalidad: Mantiene los cálculos exactos y fijos del periodo que se requiera (la temporalidad macro seleccionada) sin que estos se modifiquen, distorsionen o recalibren indebidamente al
FREE
GOLDX King
Ibrahim Al Mhawsh
GOLDX King — Professional Gold Trading Expert Advisor for MT5 GOLDX King is a specialized Expert Advisor (EA) designed exclusively for Gold (XAUUSD) on MetaTrader 5. Built with a strong focus on risk control, disciplined entries, and long-term consistency , GOLDX King is designed for traders who are looking for a systematic approach to gold trading rather than unrealistic promises of extraordinary returns in a short period of time. Designed Exclusively for Gold GOLDX King focuses exclusively on
Binary Options Assistant (BOA) KAM Signals Indicator provides signals based on gkNextLevel Binary Options Strategy. Indicators: 3 Moving Averages & Stochastic Stop missing trades, stop jumping from chart to chart looking for trade set-ups and get all the signals on 1 chart! U se any of the BOA Signals Indicator with the  Binary Options Assistant (BOA) Multi Currency Dashboard .  All BOA Signal Indicator settings are adjustable to give you more strategy combinations. The signals can be seen vis
该产品的买家也购买
ARIPoint
Temirlan Kdyrkhan
1 (4)
ARIPoint is a powerful trading companion designed to generate high-probability entry signals with dynamic TP/SL/DP levels based on volatility. Built-in performance tracking shows win/loss stats, PP1/PP2 hits, and success rates all updated live. Key Features: Buy/Sell signals with adaptive volatility bands Real-time TP/SL/DP levels based on ATR Built-in MA Filter with optional ATR/StdDev volatility Performance stats panel (Success, Profit/Loss, PP1/PP2) Alerts via popup, sound, push, or email Cu
Boba Analysis Suite Boba Analysis Suite 是一款适用于 MetaTrader 5 的分析指标。它将市场结构、关键价格区域和整体市场背景整合到同一图表视图中。 该指标源于交易及交易教学的实践经验,旨在帮助用户建立有条理的分析流程:评估市场方向、识别重要价位,并结合多个时间周期进行分析。 结合市场背景进行分析 单个信号的意义取决于市场背景。Boba Analysis Suite 帮助用户将当前图表状况与更大范围的市场结构相结合,并根据预先制定的规则评估交易思路。 分析功能包括: **趋势与市场结构:**评估市场方向及相关结构背景。 **关键价格区域与价位:**在图表上直观标示值得进一步分析的重要区域。 **多时间周期:**整合不同时间周期的信息,评估整体市场背景。 **可视化分析流程:**直接在图表上查看分析信息。 自主做出交易决策 Boba Analysis Suite 适合希望系统分析图表并结合多个时间周期信息的交易者。 该指标用于辅助分析,不会开仓或平仓,也不能替代交易策略或风险管理。每一笔交易的决策均由用户自行做出。 使用与许可 平台:Meta
ARICoins
Temirlan Kdyrkhan
ARICoin is a powerful trading companion designed to generate high-probability entry signals with dynamic TP/SL/DP levels based on volatility. Built-in performance tracking shows win/loss stats, PP1/PP2 hits, and success rates all updated live. Key Features: Buy/Sell signals with adaptive volatility bands Real-time TP/SL/DP levels based on ATR Built-in MA Filter with optional ATR/StdDev volatility Performance stats panel (Success, Profit/Loss, PP1/PP2) Alerts via popup, sound, push, or email Cust
AriX
Temirlan Kdyrkhan
1 (4)
AriX Indicator for MT5 A powerful trend-following and signal-evaluation tool AriX is a custom MT5 indicator that combines Moving Averages and ATR-based risk/reward logic to generate clear buy/sell signals. It visualizes dynamic SL/TP levels, evaluates past trade outcomes, and displays win/loss statistics in a clean on-chart panel. Key features include: Buy/Sell signals based on MA crossovers ATR-based SL/TP1/TP2/TP3 levels with visual lines and labels Signal outcome tracking with real-time stat
Volume Arrow Signal Product Description Volume Arrow Signal is a smart trading indicator designed to help traders identify potential buy and sell opportunities using price action, volume behavior, and directional arrow signals. The indicator places clear arrows directly on the chart, making it easy to spot possible market reversals, trend continuations, and entry opportunities without spending hours analyzing charts manually. Whether you are trading Gold (XAUUSD) , Forex pairs, Indices, or Crypt
Meravith Scanner
Ivan Stefanov
5 (3)
MERAVITH SCANNER 是一款适用于 MetaTrader 5 的专业金融市场指标,将多种分析工具整合为一个统一的系统。它基于专有的成交量加权平均价格(VWAP)方法自动完成所有计算,完全消除主观判断。 该指标适用于所有资产类别(外汇、股票、指数、大宗商品、加密货币)以及从 M1 到 Monthly 的所有时间周期。其核心原理是价格跟随成交量。MERAVITH 识别机构资金成交量的集中区域,并从该集中区域中推导出数学上精确的价格水平。它不预测,不推测。它只计算。 使用 MERAVITH SCANNER,您可以在 2–3 分钟内扫描全部 28 个主要外汇货币对的所有时间周期。您也可以扫描任何您选择的市场——例如,大约 100 只股票约需 10 分钟。 该指标计算耗尽水平、平衡线、偏差、统计水平以及目标投射。 图表元素 Origin Point 标记所有计算的起始位置。指标会自动将其放置在最佳位置。红色标签(TOP)表示市场高点并带有看跌倾向。绿色标签(BOTTOM)表示市场低点并带有看涨倾向。 Sentiment Line 是一条动态曲线,反映基于成交量加权计算得出的市场情绪。
一句话理解 这是一个 二合一的智能指示器 ——把 RSI 和 MACD 两位“专家”的意见打包成一个简单的结论:出现箭头,就行动;没有箭头,就等待。 而且箭头 不会重绘 ,收盘后是什么样,永远就是什么样。 它解决了什么问题 很多交易者同时看 RSI(判断动量和超买超卖)和 MACD(判断趋势方向),但两者经常给出矛盾信号。 这个指示器的做法是: 只有两人同时同意 ,才发出信号。这就过滤掉了大量假信号和模糊时段。 你实际看到的东西 独立的指示器窗口(不遮住 K 线图) 清晰的 买入箭头 和 卖出箭头 放大版的 MACD 柱状图(更容易看清动量变化) RSI 和 MACD 的线依然在,但你的注意力只需放在箭头上 谁适合用 新手 :不用学两个指标如何配合,跟着箭头做即可 老手 :节省时间,快速过滤噪音,且不重绘的特性让回测结果可信 所有讨厌信号闪烁的人 为什么它不重绘 因为它的判断逻辑基于 完整收盘后的价格数据 。信号只有在满足条件的那一刻才会固定下来,之后不会因为后续 K 线的变化而修改之前的箭头。 这意味着你可以放心做回测,也能在实盘中信任你看到的每一个信号。 底层特点(不复杂地说) 它
VTrende Pro
Andrii Diachenko
5 (1)
VTrende Pro - MTF indicator for trend trading with a display panel for MT5 *** Videos can be translated into any language using subtitles (video language - Russian) Although the signals of the VTrende Pro indicator can be used as signals of a full-fledged trading system, it is recommended to use them in conjunction with the Bill Williams TS. VTrende Pro is an extended version of the VTrende indicator. Difference between Pro version and VTrende: - Time zones - Signal V - signal 1-2 waves -    S
TrendMaestro5
Stefano Frisetti
note: this indicator is for METATRADER4, if you want the version for METATRADER5 this is the link:  https://www.mql5.com/it/market/product/108106 TRENDMAESTRO ver 2.5 TRENDMAESTRO recognizes a new TREND from the start, he never makes mistakes. The certainty of identifying a new TREND is priceless. DESCRIPTION TRENDMAESTRO identifies a new TREND in the bud, this indicator examines the volatility, volumes and momentum to identify the moment in which there is an explosion of one or more of these da
看清市场真正在做什么。   在您眼前实时观察三大市场阶段(收缩、扩张、趋势),并在趋势阶段的早期阶段抓住更优的入场点。   不要再猜测。开始像机构和聪明钱那样解读市场。   Apex Market Structure Pro(MT5 版)是一款精准的聪明钱分析工具,它剥离噪音,向您展示每根 K 线之下的真实结构:流动性、结构转变、吸   筹区域与趋势偏向,全部呈现在一个简洁、专业的图层中。专为厌倦了滞后指标、准备以清晰视角交易的严肃交易者打造。   重要提示:本指标专为 Heikin Ashi(平均足)K 线设计。使用前请将图表切换为 Heikin Ashi,以释放其全部威力。全部分析都围绕 Heikin   Ashi 的价格流构建。正是在这里,Apex Market Structure Pro 发挥出最佳表现。   交易者为何选择 Apex Market Structure Pro:   流动性,一览无遗: 瞬间看清止损池所在之处。卖方与买方流动性会被自动标注。实时关注尚未被扫的价位,捕捉价格攫取流动性并反转的精确时   刻。在聪明钱交易的地方交易。   会说话的结构:
FX-AIEA 供给需求区智能识别指标(Supply and Demand Indicators MT5)——技术原理与参数讨论 版本:2.51 | 适用平台:MetaTrader 5 引言 供给需求区是机构订单流的重要表现形式,相比传统支撑阻力位能更直接地反映买卖力量的失衡。本指标尝试通过算法自动识别高概率供需区域,以减少手动绘制的耗时与主观性。其核心逻辑基于自适应 ZigZag 算法,提取波峰波谷并生成区域标识 。 核心技术特点 全自动绘制机制 :基于改良版 ZigZag 动态提取有效极值,标记潜在供给区与需求区。指标遵循 MQL5 原生   prev_calculated   机制,在新 K 线生成时自动重绘,支持跨周期强制计算( Forced_TimeFrame   参数)。 区域边界模式 :支持宽带(覆盖K线影线极值)与窄带(仅覆盖实体)两种模式,用户可通过   use_narrow_bands   参数切换,以适应不同交易风格。 滤噪算法 :启用   kill_retouch   后,自动剔除被后续行情反复轻触但未有效突破的弱势区域,以提升信号有效性。 视觉与性能 :支持自
ORB Seeker MT5
Marcela Goncalves De Oliveira
特价促销,限量供应,保持产品稀缺性! 仅售 599 美元! 购买后请联系我以获取奖励的 ORB Seeker EA 和个人优化设置文件。 自信地捕捉干净利落的比赛片段! ORB Seeker MT5 是一款专业的开盘区间突破 (ORB) 指标,专为追求准确性、简洁性、灵活性和清晰图表结构的交易者而设计。 它能自动绘制任何交易品种的盘前或自定义交易时段区间,然后给出清晰的突破信号,包括入场点、止损点、止盈点以及可选的50%部分止盈位。所有数据均实时计算并直接显示在图表上。 您可以选择交易伦敦开盘、纽约交易时段、亚洲交易时段,或者自定义交易时段。ORB Seeker MT5 会自动适应您选择的交易时段,让您精准掌握市场波动范围、突破位和交易位。 每次购买均免费赠送 ORB Seeker EA 智能交易系统。该 EA 系统读取指标的突破信号并可自动下单,您可以选择手动交易,也可以让 EA 系统根据指标的信号逻辑自动处理入场。   为什么选择 ORB Seeker MT5 支持多个交易时段 - 您可以自行设置伦敦、纽约、亚洲或自定义交易时段的盘前交易时间和交易时段。 完整的突破视觉效果 -
AriFocus
Temirlan Kdyrkhan
AriFocus - Non-Repainting Buy/Sell Signals AriFocus - one clear signal. AriFocus marks buy and sell signals directly on the chart and suggests a stop-loss level for each one. Every signal is confirmed on bar close and never repaints. - Buy/sell arrows, confirmed on bar close - Suggested stop-loss level for every signal - Trend band and candle coloring to show direction at a glance - 10 ready-made presets, or your own settings (14 calculation methods) - Pop-up, push and email alerts with entr
KenKem Master Volume Profiler - Brief Introduction A Display-only volume-profile cockpit for XAUUSD, BTCUSD and other liquid symbols. Draws profile structure, multi-timeframe flow, EMA trend and study-only setup markers. Places no orders. Not a signal service.  It maps where the market has actually traded and reads recent order flow, so you can see structure and lean at a glance.  What it shows: Master and local volume profiles (POC and value-area high/low) - the price shelves that matter. A liv
MasterTrend
Temirlan Kdyrkhan
MasterTrend Indicator for MT5 A powerful trend-following and signal-evaluation tool MasterTrend   is a custom MT5 indicator that combines Moving Averages and ATR-based risk/reward logic to generate clear buy/sell signals. It visualizes dynamic SL/TP levels, evaluates past trade outcomes, and displays win/loss statistics in a clean on-chart panel. Key features include: Buy/Sell signals based on MA crossovers ATR-based SL/TP1/TP2/TP3 levels with visual lines and labels Signal outcome tracking wit
SMC Sweep Fvg MT5
Daniil Sleptsov
5 (1)
SMC Sweep Fvg MT5 — 像聪明钱一样看市场,就在你的图表上 你一定有过这种感觉:价格扫掉你的止损,随后反转,并正好走到你预期的方向。方向你是对的,错的只是入场。 这个指标就是为了让这类情况少发生。它接手分析中最繁重的部分——图表标注,把真正重要的留给你:决策。 你会在图表上看到什么 市场结构 — 真实的结构高点与低点,带有 HH / HL / LH / LL 标记和水平线。趋势一目了然,无需猜测。 失衡区(FVG) — 价格推进过快、之后常会回补的区域。未回补与已回补的区域用不同颜色显示。 流动性行为 — 指标跟踪市场在反转前扫过关键水平的时刻。 现成的交易布局 — 入场箭头、止损位与盈利目标。全部画好,无需心算。 趋势过滤 — 更高周期的趋势线,帮你站在主趋势一侧。 指标关注流动性扫荡、失衡形成与结构状态——并只突出这些因素同时对齐的情形。 统计面板——回应每一个疑虑 你不必只听别人说。图表上的内置面板会按所选历史显示: 分析周期(K线数量); 检测到的情形总数; 多少到达目标、多少触及止损; 仍在运行中的数量; 以点数计的净结果。 切换品种——面板重
PrimeScalping
Temirlan Kdyrkhan
PrimeScalping is a powerful trading companion designed to generate high-probability entry signals with dynamic TP/SL/DP levels based on volatility. Built-in performance tracking shows win/loss stats, PP1/PP2 hits, and success rates — all updated live. Key Features: Buy/Sell signals with adaptive volatility bands Real-time TP/SL/DP levels based on ATR Built-in MA Filter with optional ATR/StdDev volatility Performance stats panel (Success, Profit/Loss, PP1/PP2) Alerts via popup, sound, push, or e
Pan PrizMA CD Phase
Aleksey Panfilov
The Expert Advisor and the video are attached in the Discussion tab . The robot applies only one order and strictly follows the signals to evaluate the indicator efficiency. Pan PrizMA CD Phase is an option based on the Pan PrizMA indicator. Details (in Russian). Averaging by a quadric-quartic polynomial increases the smoothness of lines, adds momentum and rhythm. Extrapolation by the sinusoid function near a constant allows adjusting the delay or lead of signals. The value of the phase - wave s
Классификатор силы тренда. Показания на истории не меняет. Изменяется классификация только незакрытого бара. По идее подобен полной системе ASCTrend, сигнальный модуль которой, точнее его аппроксимация в несколько "урезанном" виде, есть в свободном доступе, а также в терминале как сигнальный индикатор SilverTrend . Точной копией системы ASCTrend не является. Работает на всех инструментах и всех временных диапазонах. Индикатор использует несколько некоррелируемых между собой алгоритмов для класси
FFx Universal Strength Meter PRO is more than a basic strength meter. Instead of limiting the calculation to price, it can be based on any of the 19 integrated strength modes + 9 timeframes. With the FFx USM, you are able to define any period for any combination of timeframes. For example, you can set the dashboard for the last 10 candles for M15-H1-H4… Full flexibility! Very easy to interpret... It gives a great idea about which currency is weak and which is strong, so you can find the best pai
The FFx Universal MTF alerter shows on a single chart all the timeframes (M1 to Monthly) with their own status for the chosen indicator. 9 indicators mode (MACD-RSI-Stochastic-MA-ADX-Ichimoku-Candles-CCI-PSAR). Each can be applied multiple times on the same chart with different settings. Very easy to interpret. Confirm your BUY entries when most of the timeframes are showing green color. And confirm your SELL entries when most of the timeframes are showing red color. 2 Alert Options : input to s
FFx Watcher Pro MT5
Eric Venturi-Bloxs
The FFx Watcher PRO is a dashboard displaying on a single chart the current direction of up to 15 standard indicators and up to 21 timeframes. It has 2 different modes: Watcher mode: Multi Indicators User is able to select up to 15 indicators to be displayed User is able to select up to 21 timeframes to be displayed Watcher mode: Multi Pairs User is able to select any number of pairs/symbols User is able to select up to 21 timeframes to be displayed This mode uses one of the standard indicators
FFx Patterns Alerter gives trade suggestions with Entry, Target 1, Target 2 and StopLoss .... for any of the selected patterns (PinBar, Engulfing, InsideBar, OutsideBar) Below are the different options available: Multiple instances can be applied on the same chart to monitor different patterns Entry suggestion - pips to be added over the break for the entry 3 different options to calculate the SL - by pips, by ATR multiplier or at the pattern High/Low 3 different options to calculate the 2 TPs -
FFx Basket Scanner MT5
Eric Venturi-Bloxs
MetaTrader 4 version available here : https://www.mql5.com/en/market/product/24881 FFx Basket Scanner is a global tool scanning all pairs and all timeframes over up to five indicators among the 16 available. You will clearly see which currencies to avoid trading and which ones to focus on. Once a currency goes into an extreme zone (e.g. 20/80%), you can trade the whole basket with great confidence. Another way to use it is to look at two currencies (weak vs strong) to find the best single pairs
MetaTrader 4 version available here: https://www.mql5.com/en/market/product/25793 FFx Pivot SR Suite PRO is a complete suite for support and resistance levels. Support and Resistance are the most used levels in all kinds of trading. Can be used to find reversal trend, to set targets and stop, etc. The indicator is fully flexible directly from the chart 4 periods to choose for the calculation: 4Hours, Daily, Weekly and Monthly 4 formulas to choose for the calculation: Classic, Camarilla, Fibonac
ClassicSBA
Umri Azkia Zulkarnaen
this indicator very simple and easy if you understand and agree with setup and rule basic teknical sba you can cek in link : please cek my youtube channel for detail chanel : an for detail info  contact me  basicly setup buy (long) for this indicator is Magenta- blue and green candle or magenta - green  and green candlestik and for setup sell (short) is Black - yellow - and red candle or black - red  and red candlestik
WanaScalper
Isaac Wanasolo
1 (1)
A scalping indicator based on mathematical patterns, which on average gives signals with relatively small SL, and also occasionally helps to catch big moves in the markets (more information in the video) This indicator has three main types of notifications: The first type warns of a possible/upcoming signal on the next bar The second type indicates the presence of a ready signal to enter the market/open a position The third type is for SL and TP levels - you will be notified every time price re
Индикатор Coefficient Of Determination (COD) представляет собой значение коэффициента детерминации или квадрат коэффициента корреляции между зависимой переменной — ценой и объясняющей переменной — тиковым объемом. Что это дает нам на практике? COD отлично распознает кульминацию трендовых движений, что позволяет подбирать оптимальные точки и ловить развороты рынка. Как использовать индикатор: Наиболее популярная торговая стратегия строится совместно с трендовым индикатором Moving Average (MA), пе
Recommended TimeFrame >= H1. 100% Non Repainted at any moment.  Use it carefully, only with Trend Direction. Trading Usage: 2 Variants: as Range System or as BreakOut System (Both Only With Trend Direction)::: (Always use StopLoss for minimise Risk); [1] as Range System: (Recommended) in UP TREND:  - BUY in Blue Line , then if price goes down by 50 points (on H1) open Second BUY.   Close in any Profit you wish: TrailingStop(45 points) or Close when Price touches upper Gold Line. in DOWN TREND
Spike Detector
Tete Adate Adjete
this indicator is a Spike detector indicator, it is specially designed to trade Boom 1000, Boom 500, Crash 1000 and Crash 500 We recommend using it on Deriv Boom and Crash indices only Its setting is intuitive, familiar, easy to use it has notification functions; audible notifications and push notifications. this tool is simple to use, easy to handle This update is based on different strategies for spikes
作者的更多信息
Atropos Gold
Ahmad Zehour
Professional Automated Trading Expert Advisor for MetaTrader 5 Atropos Gold is an automated trading system built around a proprietary market-behavior model rather than simple indicator crossovers or conventional lagging-indicator signals. The objective is not to create an unrealistic historical chart with an extraordinary win rate or an artificially perfect equity curve. The objective is to trade a defined market logic, manage positions systematically, and give the trader clear control over posi
Atropos Manager  Professional Trade Management Utility for MetaTrader 5. ( User Guide & Manual ) Atropos Manager is built for traders who open multiple positions and need a faster, cleaner way to manage them after entry. It does not predict the market and it does not generate entry signals. Its purpose is simple: help you manage open trades with structure, speed, and control directly from the chart. Whether you trade manually, use pending orders, enter from mobile, follow signals, or use another
筛选:
Oussama Anezha
145
Oussama Anezha 2026.08.19 11:04 

I have been using Atropos X for a while now and I have to admit that at the beginning I underestimated it. I thought it was just another signal indicator, but after spending time with it and actually reading the manual, I understood that this is really not the point of the product. What I like most is that before Atropos X I had several indicators and tools open on my charts. Now I can keep the chart much cleaner and read most of what I need directly from the state panel. The other big advantage for me is the flexibility. You are not forced to use one fixed signal setup. You can build and adjust the signal according to the symbol, timeframe and market condition you are trading. This is where the indicator became really useful for me. I started with some of the settings shared by the developer and then adjusted them based on my own experience, especially depending on the market and how I wanted to handle targets and exits. My advice is: don't buy this and spend five minutes with it and think you understand it. Read the manual, read the article and learn what every setting actually does. Once I did that, my opinion of the indicator changed completely. I would say it is more suitable for traders who already understand technical indicators and want more control. A beginner can definitely learn a lot from it, but this is not just a simple indicator where you blindly follow an arrow. Support has also been very good. Whenever I had questions, I received quick answers, and I also appreciated that useful settings and ideas were shared publicly in the comments instead of keeping everything hidden. For me Atropos X became more of a trading tool than just an indicator. It helped me remove a lot of unnecessary tools from my charts while still giving me the freedom to build the kind of signal I want. Definitely worth taking the time to learn properly. Thank you Ahmad so much for this Product and your Support !!!

回复评论