Atropos X

5
Atropos X

Multi-Engine Signal & Market State Indicator for MetaTrader 5

Atropos X is a professional MT5 indicator built for traders who want more than basic buy and sell arrows. It combines two signal engines, multiple confirmation filters, Linear Regression visual context, and a live market state panel into one clean trading workspace. (user guide and manual)

Instead of loading your chart with many separate indicators, Atropos X brings signal, trend, momentum, volatility, and market-condition tools together inside one flexible indicator.

Build your own signal environment. Read the market faster. Trade with more structure.

Why Atropos X?

Many traders use several indicators at the same time: one for signals, one for trend, one for momentum, one for volatility, one for choppy market detection, one for ATR, and another for confirmation. After a while, the chart becomes crowded and harder to read.

Atropos X was designed to simplify that process. It gives you a structured all-in-one workspace where you can choose your signal engine, enable or disable filters, check live market readings, and adjust the setup based on the instrument and timeframe you trade.

This makes Atropos X useful for both newer traders who want a cleaner structure and experienced traders who want more control over signal confirmation.

Two Signal Engines

Atropos X includes two popular signal engines:

UT Bot Engine — A fast and responsive engine commonly used by traders who prefer active signal behavior and clear directional changes.

Range Filter Engine — A smoother alternative that helps traders focus on filtered price movement and reduce some unnecessary market noise.

You can choose the engine that better fits your market, timeframe, and trading style.

Build Your Own Signal Setup

Atropos X is not a rigid black-box indicator. It allows you to shape the signal behavior using optional filters and confirmation tools. Depending on your strategy, you can keep the setup simple or make it more selective.

Available tools include:

  • EMA trend filtering

  • RSI condition filtering

  • MACD confirmation

  • ADX strength filtering

  • Stochastic filtering

  • Choppiness filtering

  • ATR hot-market blocking

  • Volatility regime filtering

  • Time control

  • Linear Regression visual context

This flexibility allows traders to test different combinations and adapt the indicator to different instruments, sessions, and market conditions.

Live Market State Panel

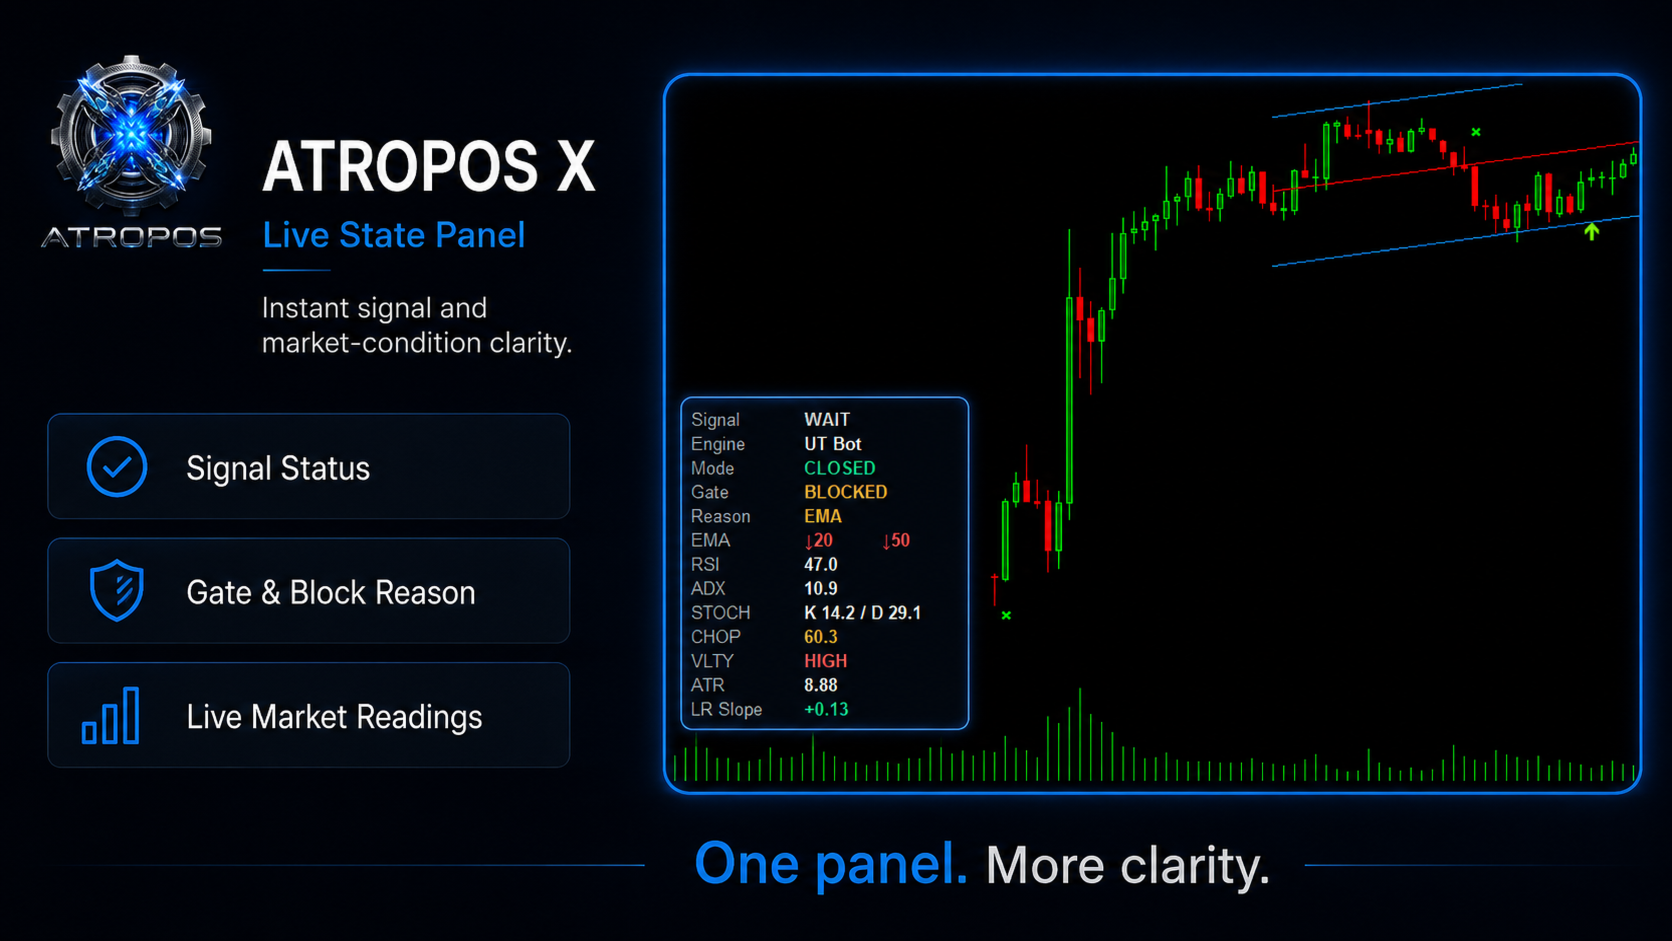
The built-in state panel summarizes important readings directly on the chart, helping you understand the current market environment without adding many separate indicators.

The panel can show:

  • Current signal state

  • Active engine

  • Signal mode

  • Gate status

  • Block reason

  • EMA direction

  • RSI

  • ADX

  • Stochastic K/D

  • Choppiness

  • Volatility state

  • ATR

  • Linear Regression slope

Linear Regression Context

Atropos X includes a Linear Regression visual tool that can help provide additional context for market structure, trend direction, price location, and general behavior around the signal area.

This gives traders more context instead of relying only on arrows.

Works Across Multiple Markets

Atropos X can be tested and used across different instruments, including:

  • Gold

  • Silver

  • Forex pairs

  • Indices

  • Oil

  • Crypto

  • Other CFD instruments

It can also be used on different timeframes depending on the trader’s style.

Practical Ways to Use Atropos X

You can use Atropos X as:

  • A direct signal indicator

  • A filtered signal indicator

  • A confirmation tool

  • A market-state dashboard

  • A trend and momentum assistant

  • A cleaner replacement for several separate indicators

  • A flexible research tool for testing signal combinations

Some traders may prefer simple engine signals. Others may prefer stricter confirmation using filters. Atropos X supports both approaches.

Who Is It For?

Atropos X may be useful for:

  • Traders who want cleaner charts

  • Traders who use technical confirmation before entries

  • Traders who want to compare signal engines

  • Traders who trade multiple symbols or timeframes

  • Traders who prefer customizable setups

  • Beginners who want a structured signal environment

  • Experienced traders who want more control over filtering

Important

Atropos X is a trading indicator and decision-support tool. It does not guarantee profits and it does not replace risk management.

Every trader should test settings carefully on the symbols and timeframes they trade. Market conditions change, and no indicator should be used blindly.

Final Note

Atropos X was built as a professional trading asset, not just another arrow indicator. It combines signals, filters, market readings, and visual context into one practical MT5 workspace.

If you want one indicator that helps reduce chart clutter, test different signal setups, and read the market with more structure, Atropos X was designed for that purpose.


レビュー 1
Oussama Anezha
145
Oussama Anezha 2026.08.19 11:04 

I have been using Atropos X for a while now and I have to admit that at the beginning I underestimated it. I thought it was just another signal indicator, but after spending time with it and actually reading the manual, I understood that this is really not the point of the product. What I like most is that before Atropos X I had several indicators and tools open on my charts. Now I can keep the chart much cleaner and read most of what I need directly from the state panel. The other big advantage for me is the flexibility. You are not forced to use one fixed signal setup. You can build and adjust the signal according to the symbol, timeframe and market condition you are trading. This is where the indicator became really useful for me. I started with some of the settings shared by the developer and then adjusted them based on my own experience, especially depending on the market and how I wanted to handle targets and exits. My advice is: don't buy this and spend five minutes with it and think you understand it. Read the manual, read the article and learn what every setting actually does. Once I did that, my opinion of the indicator changed completely. I would say it is more suitable for traders who already understand technical indicators and want more control. A beginner can definitely learn a lot from it, but this is not just a simple indicator where you blindly follow an arrow. Support has also been very good. Whenever I had questions, I received quick answers, and I also appreciated that useful settings and ideas were shared publicly in the comments instead of keeping everything hidden. For me Atropos X became more of a trading tool than just an indicator. It helped me remove a lot of unnecessary tools from my charts while still giving me the freedom to build the kind of signal I want. Definitely worth taking the time to learn properly. Thank you Ahmad so much for this Product and your Support !!!

おすすめのプロダクト
Impulse fractals indicator - is counter-trend oriented complex market fractal pattern.  Market creates bull/bear impulse, trend starts, fractals on impulsed wave are an agressive pullback signals. Buy arrow is plotted when market is bearish and it's impulse showed up-side fractal, and sell arrow is plotted when market is bullish and it's impulse showed dn-side fractal. Main indicator's adjustable inputs : impulsePeriod - main period of impulse histogram  filterPeriod  - smoothes impulse accordi
Woodie CCI MTF Plus The Woodie CCI MTF Plus is an advanced, multi-timeframe trading engine engineered to eliminate chart clutter and trading hesitation. Expanding on Ken Wood’s core methodology, this upgraded system integrates the classic Woodie CCI engine with a Dynamic Multi-Timeframe (MTF) Dashboard , Trend Age Tracking , and Consensus Background Alignment Alerts,  giving you full higher-timeframe context on a single chart. Core Trader Questions Answered What is the global market trend ac
UNIVERSAL MARKET LEVELS 2026 手動でのレベル描画は非常に時間がかかり、トレーダーによって結果が異なることがよくあります。このインジケーターは、チャート上に明確な重要なレベルを自動的に描画します。 7種類のレベル 前日レベル(高値 / 安値 / 終値) ヒストリカルレベル(価格反応が強かったゾーン) ミラーレベル(サポートがレジスタンスになる場所) リミットレベル(大口注文によって価格が維持されているレベル) アブノーマルバーによるレベル(高ATRを伴う強いインパルスムーブのレベル) 最初の1時間のレベル (NYSE) — これらのレベルは、ニューヨークセッション開始後のボラティリティの高い動きに対して反応することが多く、困難な市場状況でも機能することがあります。 ギャップレベル — 価格ギャップ後の不均衡ゾーン 手動で何かを描画する必要はありません — すべてがすでにチャート上にあります。 アプローチ — 市場理解 Universal Market Levelsは、著名なトレーダーや大手プロップトレーディング会社の教育資料で説明されているアプローチに基づいて
CrossPulse Dynamic ATR CrossPulse is an automated Expert Advisor for MetaTrader 5 that combines classic MACD crossover signals with ATR-based recovery position management. It is built for traders who want a rule-based scalping system with clear entry logic and configurable risk limits. HOW IT WORKS ENTRY (new position) • Long: MACD golden cross confirmed on the previous bar (MACD line crosses above Signal). • Short: MACD death cross confirmed
Manyal trading system, CovEchoTrend Robot, focuses on reliability and flexibility. By employing statistical analysis methods to study the relationships between the base indicator and market patterns, the system enables a deeper understanding of market processes. Intelligent pattern analysis: The application of statistical data processing helps identify key trend reversal points more accurately, signaling significant market shifts. Informed decision-making is based on the intersection of indicato
GoldEdge Pro – Smart Pullback Trading System GoldEdge Pro is an advanced Expert Advisor designed for XAUUSD, focusing on pullback and dip-detection strategies within established market trends. The system is built to identify temporary price retracements and execute trades with structured confirmation and risk control. Core Trading Concept GoldEdge Pro is based on a pullback trading methodology: 1. Dip Detection Engine The system identifies short-term market retracements using EMA alignment (8 /
MarketMagnet
Kelly Adediran Raymond
Are you ready to take your trading journey to new heights? Look no further than MarketMagnet, this groundbreaking indicator designed to propel your trading success with excitement and accuracy. Powered by the convergence of Momentum and CCI (Commodity Channel Index), MarketMagnet equips traders with the ultimate tool to determine direction and entry prices for a wide range of recommended currency pairs and instruments. It is designed for traders seeking to scalp for a few pips on lower timeframe
Tabajara Rules for MT5 , based on Professor André Machado’s Tabajara Setup, indicates the market direction using moving averages when there are candles aligned with the direction of the moving average. The indicator contains the color rule applied to the candles and the moving average. It allows changing the parameters: period and smoothing method of the moving average. It also allows changing the colors of the candles (borders and filling) and of the moving average. Professor André Machado’s
FREE
VibeFox Squeeze Detector — スクイーズの圧縮、モメンタム、エントリーポイント VibeFox Squeeze Detector は MetaTrader 5 向けのリアルタイム Squeeze Detector インジケーターです。市場が狭いレンジへと圧縮する局面を見つけ出し、その水面下で蓄積されるモメンタムを測定するため、相場が束縛から解き放たれた瞬間に動くことができます。古典的なスクイーズのロジックとモメンタム・ヒストグラムは独立したサブウィンドウに表示され、エントリーマーカーは価格チャート上に直接配置され、すべての操作は一つのモダンでインタラクティブなパネルにまとめられています。 インジケーターが測定するもの 核となる考え方は、異なる速さで拡張・収縮する二つのボラティリティ・エンベロープの比較です。 Bollinger Bands はボラティリティに素早く反応します。 Keltner Channel の内側で収縮すると、市場はスクイーズに入った状態です——方向性のある動きの前にエネルギーが蓄積される、圧縮されたレンジの局面です。Bollinger Ban
Alpha One MT5 - 高度なトレンド検出システム Alpha Oneは、明確な買い・売りシグナルを提供し、自動エントリー、ストップロス、3段階のテイクプロフィットレベルをチャート上に直接描画するプロフェッショナルなトレンドフォロー指標です。 本指標は、リアルタイムのトレンド強度と方向性を反映するため緑と赤に変化する15本の動的ラインで構成される独自の「エネルギーフィールド」可視化機能を備えています。緑のエネルギーは強気の優位性を、赤のエネルギーは弱気の圧力を示し、市場の勢いを瞬時に視覚的に把握できます。 シグナルシステム シグナルは、複数の独立した分析次元における勢いの変化を分析する多層確認プロセスを通じて生成されます。各シグナルは、チャートに表示される前に複数のコンポーネントによる合意が必要です。 再描画なし保証 全てのシグナルは確定済みクローズバーのみに基づいて算出されます。一度表示されたシグナルは移動・変更・消失することはありません。過去データに表示される内容は、リアルタイムで実際に発生したものと完全に一致します。バックテスト結果はライブパフォーマンスと一致しま
MSNR Precision Entry Pro Short description Rule-based MSNR support/resistance engine with freshness tracking, SBR/RBS role-reversal, liquidity sweep detection, market structure (BOS/MSS) and a non-repainting confluence-scored entry signal. Full description: MSNR Precision Entry Pro is a non-repainting MetaTrader 5 indicator built around the MSNR (Market Structure & Support/Resistance) methodology: trading from well-defined price zones only after they show a genuine reaction, not simply because
Ziva LSE Pro
Hassan Abdullah Hassan Al Balushi
ZIVA LSE Pro: Trade the Flow, Not the Noise ZIVA LSE Pro was developed around a simple belief: professional traders do not need more random signals; they need better context. This workflow reflects the ZIVA approach to filtering market noise and focusing on the liquidity and structural mechanics that influence price behavior. Most indicators treat the market like a static picture. ZIVA LSE Pro is built to read it as a dynamic environment where liquidity, structure, volatility, and execution con
TradePilot Execution Utility The Ultimate Execution & Risk Management Dashboard TradePilot Execution Utility is a high-performance trade management dashboard built specifically for professional manual traders and those undertaking Prop Firm challenges . It bridges the gap between complex risk mathematics and rapid execution, ensuring you never miss a setup or over-leverage your account. 1. Visual Risk-Based Lot Sizing Forget manual calculators. TradePilot uses your chart as the primary interface
Vertex Structure Dashboard delivers a complete multi-timeframe market structure analysis in a single, compact panel. It monitors up to 9   timeframes simultaneously and displays trend bias, structural breaks, momentum, and value zones in real time — no tab-switching, no manual   tracking.   The panel is fully draggable and collapsible. Its position persists across timeframe changes through GlobalVariables, so your layout stays   exactly where you placed it.   How It Works   Each enabled tim
SB Bot Alerts 是一款以 ATR 動態追蹤停損線 為核心的趨勢訊號指標,主要用來協助交易者快速辨識市場方向轉換與潛在進場機會。 指標會根據市場波動自動調整追蹤線位置,當價格由下往上突破動態追蹤線時,產生 BUY 訊號 ;當價格由上往下跌破追蹤線時,產生 SELL 訊號 。 本指標適合用於外匯、黃金、指數、加密貨幣等不同市場,也可作為趨勢判斷、進場確認或其他交易系統的輔助工具。 主要功能 自動計算 ATR 動態追蹤停損線 顯示 BUY / SELL 訊號 支援不同 ATR 週期設定 可調整靈敏度參數 支援一般 K 棒與 Heikin Ashi 訊號來源 可自由開啟或關閉交易訊號 可依趨勢方向改變 K 棒顏色 支援訊號警報提醒 適用於不同商品與時間週期 訊號邏輯 當價格由下往上穿越 SB 動態追蹤線時,指標會產生 BUY 訊號;當價格由上往下穿越 SB 動態追蹤線時,則產生 SELL 訊號。 靈敏度參數越小,追蹤線通常越靠近價格,訊號會較敏感;靈敏度參數越大,追蹤線距離價格越遠,訊號通常會較穩定。 Heikin Ashi 模式 使用者可選擇是否使用 Heikin Ashi 價格
ENG-GOLD Scalper It is an auxiliary indicator that identifies potential targets and determines the place of entry with a stop loss that works on Heiken Ashi candles  The green lines are usually the targets, the red lines are the stop loss, and the yellow lines are the entry location.  This file is recognized on small and medium frames, usually less than the watch frame I highly recommend using XAUUSD Nasdaq100 Dow30 USOIL 
This is the best indicator we have created by far, this indicator replicates the well known heiken ashi indicator,  but with a more precise entry point, this indicator can work on all time-frames and is strong on all the time frames , this indicator does not repaint nor does it lag , this indicator strategy combined with price action will change your trading experience , elevate your experience to the next level.
A useful and convenient tool for traders when analyzing and making decisions. Peculiarity The main feature of this indicator is its fast algorithm . The gain in the speed of calculating the polynomial and its value of the standard deviation in comparison with classical algorithms reaches several thousand times. Also, this indicator includes a Strategy Tester with a clear visualization of transactions, an equity chart and simultaneous calculation and display of the following data in the form of
EMA Scalper Indicator is an indicator of EMA lines and reversal EMA lines. Each pair of EMA channels area that can be used to make reversal entry. After the EMA lines are widening because of major trend, the area can be used to find profitable entry and exit, especially after EMA reversal. Do the cut loss whenever candle closed outside the area. The A, B, C, D, and E area are colored differently. Solid lines: Normal EMA lines. Dashed lines: Reversal EMA lines.
価格が流動性を探しに向かう可能性のある場所を把握 Liquidity Reaction Map MT5は、確定した価格構造に基づいて、潜在的なバイサイドおよびセルサイド流動性エリアを特定するチャート型市場分析インジケーターです。 スイングポイント、等しい高値と安値、前日および前週の水準、セッションの高値と安値、心理的なラウンド価格を整理された流動性マップに統合します。近接する水準は統合され、強度、現在価格からの距離、複数ソースの一致度に基づいて順位付けされます。 価格が流動性エリアに接近する、流動性をスイープする、反発する、またはブレイクする可能性のある場所を分析するために使用できます。取引の開始や管理は行いません。 流動性のソース 流動性マップは、次の情報から流動性を特定できます。 確定したスイング高値と安値 等しい高値と等しい安値 前日の高値と安値 前週の高値と安値 完了したセッションの高値と安値 心理的なラウンド価格水準 設定可能な複数の時間足 バイサイド流動性は関連する高値の上に表示され、セルサイド流動性は関連する安値の下に表示されます。 これらのエリアは、過去の価格構造から算
VP RSI Reversal Signal Arrows — Product Description Short Description VP RSI Reversal Signal Arrows is a clean MetaTrader 5 indicator that displays buy and sell reversal arrows when RSI exits oversold or overbought zones, with an optional moving average trend filter. Main Description VP RSI Reversal Signal Arrows is a visual technical analysis indicator for MetaTrader 5. It is designed for manual traders who want a simple RSI-based reversal assistant directly on the price chart. The indicator
Cyclic Impulse MT5 — このテクニカル指標はチャートを構築し、周期的な価格変動を識別します。これにより、反転する周期的な価格変動とエントリーシグナルを見つけることができます。 指標の仕組み 周期的な下降傾向が検出されると、ローソク足が閉じた後に青い下降バーが生成されます。このバーは現在のローソク足上でちらつく場合があり、シグナルはまだ確認されていません。青い矢印は価格チャートに複製されます。 周期的な上昇傾向が検出されると、ローソク足が閉じた後に赤い上向きバーが生成されます。このバーは現在のローソク足上でちらつく場合があり、シグナルはまだ確認されていません。オレンジ色の矢印は価格チャートに複製されます。 あらゆるチャート、時間枠、取引商品で使用できます。 複数のアラートタイプ。 価格チャートに追加の矢印を表示。 履歴データの再描画は行わず、ローソク足の終値に基づいて機能します。ローソク足が閉じても、矢印またはバーは消えません。 使いやすく、パラメータの設定も簡単で、不要な情報でチャートが乱雑になることはありません。 異なるパラメータを持つ2つのインジケーターを使用
Mac Rider Gold
Ignacio Agustin Mene Franco
MacRider GOLD is a professional grid-based Expert Advisor (EA) specifically designed for XAUUSD (Gold). It combines MACD signal filtering with dynamic trailing stops and advanced money management. The EA uses the MACD indicator to detect trend direction before placing pending orders, filtering out low-quality entries and focusing on high-probability setups. The grid system places BUY STOP and SELL STOP orders at configurable distances, while automatic profit closing and dynamic trailing stops
Key Features Strategy Core EMA Crossover System : Fast EMA (default: 20) and Slow EMA (default: 50) Generates buy signals when Fast EMA crosses above Slow EMA. Generates sell signals when Fast EMA crosses below Slow EMA. Fibonacci Filter : Calculates Fibonacci retrenchment levels (23.6%, 38.2%, 50%, 61.8%, 78.6%) based on recent price swings. Requires price to be near a Fibonacci level (configurable threshold) to validate trades. Risk Management Position Sizing : Dynamically calculates lot size
Functions Analyzes the current market trend Displays a numbering system based on trend structure (see below) Colors the chart background depending on trend direction Displays the ZigZag indicator Display Fibonacci Retracement with custom defined levels at the lates corrective trend movement Display Fibonacci Expansions with custom defined levels at the latest progressive trend movement Buffers for all relevant Trend parameters so EAs can access the trend information Background Information The
Nexus Target Pro Indicator Product Overview Nexus Target Pro is a technical indicator designed for breakout zone analysis. The tool charts a dynamic breakout box based on user-defined time ranges and plots arrow signals when price breaks out of the established zones. Technical Features Signal Generation: Displays non-repainting breakout direction arrows on the chart. Target Levels: Plots up to 5 calculated profit target levels based on the breakout box structure. Risk Levels: Displays a sugges
MTF Isolator EMA
Jake Jesus Herrera Turizo
Características Principales 1. Medía Móvil Multi-Timeframe (MTF) con Estabilidad Temporal EMA Macro ( InpMATimeframe ): Permite proyectar y visualizar en el gráfico actual una Media Móvil Exponencial (EMA) calculada desde una temporalidad superior (por defecto en gráfico diario PERIOD_D1 ). Independencia de Temporalidad: Mantiene los cálculos exactos y fijos del periodo que se requiera (la temporalidad macro seleccionada) sin que estos se modifiquen, distorsionen o recalibren indebidamente al
FREE
GOLDX King — Professional Gold Trading Expert Advisor for MT5 GOLDX King is a specialized Expert Advisor (EA) designed exclusively for Gold (XAUUSD) on MetaTrader 5. Built with a strong focus on risk control, disciplined entries, and long-term consistency , GOLDX King is designed for traders who are looking for a systematic approach to gold trading rather than unrealistic promises of extraordinary returns in a short period of time. Designed Exclusively for Gold GOLDX King focuses exclusively on
Binary Options Assistant (BOA) KAM Signals Indicator provides signals based on gkNextLevel Binary Options Strategy. Indicators: 3 Moving Averages & Stochastic Stop missing trades, stop jumping from chart to chart looking for trade set-ups and get all the signals on 1 chart! U se any of the BOA Signals Indicator with the  Binary Options Assistant (BOA) Multi Currency Dashboard .  All BOA Signal Indicator settings are adjustable to give you more strategy combinations. The signals can be seen vis
このプロダクトを購入した人は以下も購入しています
ARIPoint
Temirlan Kdyrkhan
1 (4)
ARIPoint is a powerful trading companion designed to generate high-probability entry signals with dynamic TP/SL/DP levels based on volatility. Built-in performance tracking shows win/loss stats, PP1/PP2 hits, and success rates all updated live. Key Features: Buy/Sell signals with adaptive volatility bands Real-time TP/SL/DP levels based on ATR Built-in MA Filter with optional ATR/StdDev volatility Performance stats panel (Success, Profit/Loss, PP1/PP2) Alerts via popup, sound, push, or email Cu
Boba Analysis Suite Boba Analysis Suite は、MetaTrader 5 向けの分析インジケーターです。市場構造、重要な価格帯、相場全体の状況を、一つのチャート画面にまとめて表示します。 トレーダーおよびトレーディング指導者としての実務経験をもとに開発され、市場の方向性の評価、重要な価格水準の特定、複数の時間足を組み合わせた分析など、体系的な分析プロセスを支援します。 相場の背景を踏まえた分析 個々のシグナルの意味は、相場の状況によって変わります。Boba Analysis Suite は、現在のチャート状況をより大きな市場構造と関連付け、あらかじめ定めたルールに沿って取引アイデアを検討するための分析を支援します。 主な分析機能: トレンドと市場構造: 市場の方向性と、その背景にある構造を評価します。 重要な価格帯と価格水準: さらに分析すべき重要な領域を視覚的に表示します。 複数の時間足: 異なる時間足の情報を組み合わせ、相場全体の状況を評価します。 視覚的な分析プロセス: 分析情報をチャート上で直接確認できます。 自主的な取引判断を支援 Boba
ARICoin is a powerful trading companion designed to generate high-probability entry signals with dynamic TP/SL/DP levels based on volatility. Built-in performance tracking shows win/loss stats, PP1/PP2 hits, and success rates all updated live. Key Features: Buy/Sell signals with adaptive volatility bands Real-time TP/SL/DP levels based on ATR Built-in MA Filter with optional ATR/StdDev volatility Performance stats panel (Success, Profit/Loss, PP1/PP2) Alerts via popup, sound, push, or email Cust
AriX
Temirlan Kdyrkhan
1 (4)
AriX Indicator for MT5 A powerful trend-following and signal-evaluation tool AriX is a custom MT5 indicator that combines Moving Averages and ATR-based risk/reward logic to generate clear buy/sell signals. It visualizes dynamic SL/TP levels, evaluates past trade outcomes, and displays win/loss statistics in a clean on-chart panel. Key features include: Buy/Sell signals based on MA crossovers ATR-based SL/TP1/TP2/TP3 levels with visual lines and labels Signal outcome tracking with real-time stat
Volume Arrow Signal Product Description Volume Arrow Signal is a smart trading indicator designed to help traders identify potential buy and sell opportunities using price action, volume behavior, and directional arrow signals. The indicator places clear arrows directly on the chart, making it easy to spot possible market reversals, trend continuations, and entry opportunities without spending hours analyzing charts manually. Whether you are trading Gold (XAUUSD) , Forex pairs, Indices, or Crypt
MERAVITH SCANNERは、MetaTrader 5用のプロフェッショナルな金融市場インジケーターで、複数の分析ツールを一つの統合システムにまとめています。独自の出来高加重平均価格(VWAP)手法を使用してすべての計算を自動で行い、主観的な解釈を完全に排除します。 このインジケーターは、すべての資産クラス(FX、株式、指数、商品、暗号通貨)およびM1から月足までのすべての時間軸で動作します。基本原理は「価格は出来高に従う」というものです。MERAVITHは機関投資家の出来高が集中するポイントを特定し、その集中から数学的に正確な価格レベルを導き出します。予測や投機は行わず、計算のみを行います。 MERAVITH SCANNERを使用すると、28の主要FX通貨ペアをすべての時間軸でわずか2~3分でスキャンできます。また、任意の市場をスキャンすることも可能です。例えば、約100銘柄の株式を約10分でスキャンできます。 インジケーターは、消耗レベル、均衡線、偏差、統計レベル、およびターゲット予測を算出します。 チャート要素 Origin Point :すべての計算が始まる起点です。イン
一言でいうと このインジケーターは RSI と MACD という2人の専門家を1つにまとめたもの です。2つのチャートを別々に見て判断する代わりに、両方が同意したときだけ「買い」または「売り」の矢印を表示します。 矢印は再描画されません 。一度出現すれば、そのまま固定されます。 「コンボ」の意味 通常、トレーダーは RSI(値動きの勢い)と MACD(トレンドの方向)を別々に見ます。しかし両者が矛盾することも多いです。 このインジケーターでは、 両方が同時に同意したときのみシグナル を出します。これにより、多くの偽シグナルが排除されます。 画面で見えるもの 価格チャートとは別のインジケーターウィンドウ 青と赤の矢印 —— そのまま使えるシグナル 拡大表示された MACD ヒストグラム(見やすく強調されている) RSI と MACD のラインも表示されるが、注目すべきは矢印 こんな人におすすめ 初心者 —— 2つのインジケーターを別々に解釈し、矛盾に対処する必要がない 経験者 —— シグナルの高速フィルタリングと、再描画しないクリアなロジック 迷いたくない人 —— 「買い」「売り」「待て
VTrende Pro
Andrii Diachenko
5 (1)
VTrende Pro - MTF indicator for trend trading with a display panel for MT5 *** Videos can be translated into any language using subtitles (video language - Russian) Although the signals of the VTrende Pro indicator can be used as signals of a full-fledged trading system, it is recommended to use them in conjunction with the Bill Williams TS. VTrende Pro is an extended version of the VTrende indicator. Difference between Pro version and VTrende: - Time zones - Signal V - signal 1-2 waves -    S
note: this indicator is for METATRADER4, if you want the version for METATRADER5 this is the link:  https://www.mql5.com/it/market/product/108106 TRENDMAESTRO ver 2.5 TRENDMAESTRO recognizes a new TREND from the start, he never makes mistakes. The certainty of identifying a new TREND is priceless. DESCRIPTION TRENDMAESTRO identifies a new TREND in the bud, this indicator examines the volatility, volumes and momentum to identify the moment in which there is an explosion of one or more of these da
相場が本当は何をしているのかを見抜く。   3つの市場フェーズ(収縮・拡張・トレンド)を目の前でライブに捉え、トレンド・フェーズの初期段階でより優れたエントリーを取りましょう   。      当て推量はもう終わり。機関投資家やスマートマネーのように相場を読み始めましょう。   Apex Market Structure Pro(MT5版)は、ノイズを取り除き、あらゆるローソク足の下にある真の構造を見せる高精度のスマートマネー分析ツ   ールです。流動性、構造転換、蓄積ゾーン、トレンドバイアスを、ひとつのクリーンでプロフェッショナルなオーバーレイに集約します。遅行   指標に見切りをつけ、明晰さをもってトレードする準備のできた本気のトレーダーのために作られました。   重要:本インジケーターは Heikin Ashi(平均足)ローソク足での動作を前提に設計されています。使用前にチャートを Heikin Ashi   に設定し、その真価を解き放ってください。分析のすべては Heikin Ashi の価格の流れを軸に構築されています。Apex Market Structure Pr
Title:FX-AIEA Supply and Demand Zone Indicator (MT5) — Technical Overview Version: 2.51 | Platform: MetaTrader 5 Introduction Supply and demand zones are considered a core manifestation of institutional order flow, providing a more direct reflection of buying and selling pressure than traditional support/resistance levels. This indicator attempts to automate the identification of high-probability supply and demand zones using an adaptive ZigZag algorithm, reducing the subjectivity and time asso
ORB Seeker MT5
Marcela Goncalves De Oliveira
数量限定で特別価格!希少性を維持するための特別価格です! たったの599ドル! ご購入後、ボーナスとしてORB Seeker EAと個人最適化セットファイルをお受け取りいただくため、私にご連絡ください。 クリーンなセッションブレイクアウトを自信を持ってキャッチしましょう! ORB Seeker MT5は、正確性、シンプルさ、柔軟性、そして明確なチャート構造を求めるトレーダー向けに開発された、プロ仕様のオープニングレンジブレイクアウト(ORB)インジケーターです。 このシステムは、あらゆる銘柄のプレマーケットまたはカスタムセッションのレンジを自動的にプロットし、エントリー、ストップロス、テイクプロフィット、およびオプションの50%部分TPレベルを含む明確なブレイクアウトシグナルを提供します。すべての計算結果はリアルタイムでチャート上に表示されます。 ロンドンオープン、ニューヨークセッション、アジアセッション、または独自のカスタム市場時間帯で取引できます。ORB Seeker MT5は選択したセッション時間帯に合わせて調整されるため、市場レンジ、ブレイクアウトレベル、トレードレベルの位
AriFocus - Non-Repainting Buy/Sell Signals AriFocus - one clear signal. AriFocus marks buy and sell signals directly on the chart and suggests a stop-loss level for each one. Every signal is confirmed on bar close and never repaints. - Buy/sell arrows, confirmed on bar close - Suggested stop-loss level for every signal - Trend band and candle coloring to show direction at a glance - 10 ready-made presets, or your own settings (14 calculation methods) - Pop-up, push and email alerts with entr
KenKem Master Volume Profiler - Brief Introduction A Display-only volume-profile cockpit for XAUUSD, BTCUSD and other liquid symbols. Draws profile structure, multi-timeframe flow, EMA trend and study-only setup markers. Places no orders. Not a signal service.  It maps where the market has actually traded and reads recent order flow, so you can see structure and lean at a glance.  What it shows: Master and local volume profiles (POC and value-area high/low) - the price shelves that matter. A liv
MasterTrend Indicator for MT5 A powerful trend-following and signal-evaluation tool MasterTrend   is a custom MT5 indicator that combines Moving Averages and ATR-based risk/reward logic to generate clear buy/sell signals. It visualizes dynamic SL/TP levels, evaluates past trade outcomes, and displays win/loss statistics in a clean on-chart panel. Key features include: Buy/Sell signals based on MA crossovers ATR-based SL/TP1/TP2/TP3 levels with visual lines and labels Signal outcome tracking wit
SMC Sweep Fvg MT5 — スマートマネーと同じ目線で、チャート上に市場を映す こんな経験はありませんか。価格がストップを巻き取り、反転し、まさに想定どおりの方向へ進む。方向は正しかった。間違えたのはエントリーだけです。 このインジケーターは、そうした場面を減らすために作られています。分析で最も重い部分——チャートのマークアップ——を引き受け、本当に重要な「判断」をあなたに残します。 チャートに表示されるもの マーケットストラクチャー — 実際の構造的高値・安値に HH / HL / LH / LL ラベルとレベルライン。トレンドが一目で分かり、推測は不要です。 インバランスゾーン(FVG) — 価格が急ぎ過ぎて通過し、後で戻りやすい領域。未埋めと既埋めのゾーンは別色で表示されます。 流動性の動き — 反転前に市場がレベルを巻き取る瞬間を追跡します。 トレード設計の完成形 — エントリー矢印、ストップロス、利益目標。すべて描画済みで、頭の中で計算する必要はありません。 トレンドフィルター — 上位足のラインで、主戦場の動きの側に立ち続けられます。 インジケーターは
PrimeScalping is a powerful trading companion designed to generate high-probability entry signals with dynamic TP/SL/DP levels based on volatility. Built-in performance tracking shows win/loss stats, PP1/PP2 hits, and success rates — all updated live. Key Features: Buy/Sell signals with adaptive volatility bands Real-time TP/SL/DP levels based on ATR Built-in MA Filter with optional ATR/StdDev volatility Performance stats panel (Success, Profit/Loss, PP1/PP2) Alerts via popup, sound, push, or e
The Expert Advisor and the video are attached in the Discussion tab . The robot applies only one order and strictly follows the signals to evaluate the indicator efficiency. Pan PrizMA CD Phase is an option based on the Pan PrizMA indicator. Details (in Russian). Averaging by a quadric-quartic polynomial increases the smoothness of lines, adds momentum and rhythm. Extrapolation by the sinusoid function near a constant allows adjusting the delay or lead of signals. The value of the phase - wave s
Классификатор силы тренда. Показания на истории не меняет. Изменяется классификация только незакрытого бара. По идее подобен полной системе ASCTrend, сигнальный модуль которой, точнее его аппроксимация в несколько "урезанном" виде, есть в свободном доступе, а также в терминале как сигнальный индикатор SilverTrend . Точной копией системы ASCTrend не является. Работает на всех инструментах и всех временных диапазонах. Индикатор использует несколько некоррелируемых между собой алгоритмов для класси
FFx Universal Strength Meter PRO is more than a basic strength meter. Instead of limiting the calculation to price, it can be based on any of the 19 integrated strength modes + 9 timeframes. With the FFx USM, you are able to define any period for any combination of timeframes. For example, you can set the dashboard for the last 10 candles for M15-H1-H4… Full flexibility! Very easy to interpret... It gives a great idea about which currency is weak and which is strong, so you can find the best pai
The FFx Universal MTF alerter shows on a single chart all the timeframes (M1 to Monthly) with their own status for the chosen indicator. 9 indicators mode (MACD-RSI-Stochastic-MA-ADX-Ichimoku-Candles-CCI-PSAR). Each can be applied multiple times on the same chart with different settings. Very easy to interpret. Confirm your BUY entries when most of the timeframes are showing green color. And confirm your SELL entries when most of the timeframes are showing red color. 2 Alert Options : input to s
The FFx Watcher PRO is a dashboard displaying on a single chart the current direction of up to 15 standard indicators and up to 21 timeframes. It has 2 different modes: Watcher mode: Multi Indicators User is able to select up to 15 indicators to be displayed User is able to select up to 21 timeframes to be displayed Watcher mode: Multi Pairs User is able to select any number of pairs/symbols User is able to select up to 21 timeframes to be displayed This mode uses one of the standard indicators
FFx Patterns Alerter gives trade suggestions with Entry, Target 1, Target 2 and StopLoss .... for any of the selected patterns (PinBar, Engulfing, InsideBar, OutsideBar) Below are the different options available: Multiple instances can be applied on the same chart to monitor different patterns Entry suggestion - pips to be added over the break for the entry 3 different options to calculate the SL - by pips, by ATR multiplier or at the pattern High/Low 3 different options to calculate the 2 TPs -
MetaTrader 4 version available here : https://www.mql5.com/en/market/product/24881 FFx Basket Scanner is a global tool scanning all pairs and all timeframes over up to five indicators among the 16 available. You will clearly see which currencies to avoid trading and which ones to focus on. Once a currency goes into an extreme zone (e.g. 20/80%), you can trade the whole basket with great confidence. Another way to use it is to look at two currencies (weak vs strong) to find the best single pairs
MetaTrader 4 version available here: https://www.mql5.com/en/market/product/25793 FFx Pivot SR Suite PRO is a complete suite for support and resistance levels. Support and Resistance are the most used levels in all kinds of trading. Can be used to find reversal trend, to set targets and stop, etc. The indicator is fully flexible directly from the chart 4 periods to choose for the calculation: 4Hours, Daily, Weekly and Monthly 4 formulas to choose for the calculation: Classic, Camarilla, Fibonac
ClassicSBA
Umri Azkia Zulkarnaen
this indicator very simple and easy if you understand and agree with setup and rule basic teknical sba you can cek in link : please cek my youtube channel for detail chanel : an for detail info  contact me  basicly setup buy (long) for this indicator is Magenta- blue and green candle or magenta - green  and green candlestik and for setup sell (short) is Black - yellow - and red candle or black - red  and red candlestik
A scalping indicator based on mathematical patterns, which on average gives signals with relatively small SL, and also occasionally helps to catch big moves in the markets (more information in the video) This indicator has three main types of notifications: The first type warns of a possible/upcoming signal on the next bar The second type indicates the presence of a ready signal to enter the market/open a position The third type is for SL and TP levels - you will be notified every time price re
Индикатор Coefficient Of Determination (COD) представляет собой значение коэффициента детерминации или квадрат коэффициента корреляции между зависимой переменной — ценой и объясняющей переменной — тиковым объемом. Что это дает нам на практике? COD отлично распознает кульминацию трендовых движений, что позволяет подбирать оптимальные точки и ловить развороты рынка. Как использовать индикатор: Наиболее популярная торговая стратегия строится совместно с трендовым индикатором Moving Average (MA), пе
Recommended TimeFrame >= H1. 100% Non Repainted at any moment.  Use it carefully, only with Trend Direction. Trading Usage: 2 Variants: as Range System or as BreakOut System (Both Only With Trend Direction)::: (Always use StopLoss for minimise Risk); [1] as Range System: (Recommended) in UP TREND:  - BUY in Blue Line , then if price goes down by 50 points (on H1) open Second BUY.   Close in any Profit you wish: TrailingStop(45 points) or Close when Price touches upper Gold Line. in DOWN TREND
this indicator is a Spike detector indicator, it is specially designed to trade Boom 1000, Boom 500, Crash 1000 and Crash 500 We recommend using it on Deriv Boom and Crash indices only Its setting is intuitive, familiar, easy to use it has notification functions; audible notifications and push notifications. this tool is simple to use, easy to handle This update is based on different strategies for spikes
作者のその他のプロダクト
Professional Automated Trading Expert Advisor for MetaTrader 5 Atropos Gold is an automated trading system built around a proprietary market-behavior model rather than simple indicator crossovers or conventional lagging-indicator signals. The objective is not to create an unrealistic historical chart with an extraordinary win rate or an artificially perfect equity curve. The objective is to trade a defined market logic, manage positions systematically, and give the trader clear control over posi
Atropos Manager  Professional Trade Management Utility for MetaTrader 5. ( User Guide & Manual ) Atropos Manager is built for traders who open multiple positions and need a faster, cleaner way to manage them after entry. It does not predict the market and it does not generate entry signals. Its purpose is simple: help you manage open trades with structure, speed, and control directly from the chart. Whether you trade manually, use pending orders, enter from mobile, follow signals, or use another
フィルタ:
Oussama Anezha
145
Oussama Anezha 2026.08.19 11:04 

I have been using Atropos X for a while now and I have to admit that at the beginning I underestimated it. I thought it was just another signal indicator, but after spending time with it and actually reading the manual, I understood that this is really not the point of the product. What I like most is that before Atropos X I had several indicators and tools open on my charts. Now I can keep the chart much cleaner and read most of what I need directly from the state panel. The other big advantage for me is the flexibility. You are not forced to use one fixed signal setup. You can build and adjust the signal according to the symbol, timeframe and market condition you are trading. This is where the indicator became really useful for me. I started with some of the settings shared by the developer and then adjusted them based on my own experience, especially depending on the market and how I wanted to handle targets and exits. My advice is: don't buy this and spend five minutes with it and think you understand it. Read the manual, read the article and learn what every setting actually does. Once I did that, my opinion of the indicator changed completely. I would say it is more suitable for traders who already understand technical indicators and want more control. A beginner can definitely learn a lot from it, but this is not just a simple indicator where you blindly follow an arrow. Support has also been very good. Whenever I had questions, I received quick answers, and I also appreciated that useful settings and ideas were shared publicly in the comments instead of keeping everything hidden. For me Atropos X became more of a trading tool than just an indicator. It helped me remove a lot of unnecessary tools from my charts while still giving me the freedom to build the kind of signal I want. Definitely worth taking the time to learn properly. Thank you Ahmad so much for this Product and your Support !!!

レビューに返信