VSA Supply and Demand


********************************************************************************************

          ---VSA Supply and Demand---

This is a actually set of three indicators that form a unity for effective monitoring of the movement of smart money. They are based on the volume and basic patterns of the VSA methodology.
 
1.VSA.ex5
2.Volume Supply and Demand.ex5
3.Bars and Candles Supply and Demand.ex5 

But here I offer you only the first indicator, which is called the VSA indicator with basic VSA signals.

Four basic VSA patterns for buying are: SC (selling climax), SHK (shakeout), BRB (bottom reversal bar) and BH (bag holding) and....
four basic VSA patterns for selling are: BC (buying climax), UT (upthrust), TRB (top reversal bar) and ERM (end of rising market). 
Which makes a total of eight climatic patterns. In addition to climatic patterns there are triggers known as No Supply and No Demand (white and red arrows on the chart). 


It is suitable for all types of trading such as:  Day traders, Scalpers, Swing traders. Anyone using Volume or VSA strategies. 


Works best for: Indices, Metal (Gold), Commodity, Forex, Crypto

What you get:
        Clear Demand Vol. (BUY) signals
        Clear Supply Vol. (SELL) signals
        Detection of No Demand / No Supply zones
        Volume climaxes & reversals
        High Volume levels HVL (support and resistance)
        Real-time alerts (no delay)

No repaint, Lightweight & fast, Clean chart visualization,Easy to use.

****************************************************************************************************
*************************************************************************************************

           ---Volume Supply and Demand.ex5---

Volume Supply and Demand. An indicator that very accurately shows the movement of demand and supply in the market. 

Green bars - Demand
Red bars - Supply
Yellow bars - Climactic bars
White bars - Very low bars
Blue bars - Doji bar

Professionals must act quickly as soon as market conditions change. The only way to react so quickly is to understand and respond, almost instinctively, to what the market is telling them. They read the market through volume and its relationship to price movement.
You too can read the market just as effectively, but you have to know what you're looking at and what you're looking for.

This indicator is best used in combination with the other two indicators that I offer, namely VSA Supply and Demand and Bars and Candles Supply and Demand. Together they form a unity that is very effective in finding imbalances in the market.
 

******************************************************************************************************

      ---Bars and Candles Supply and Demand.ex5---

This indicator colors candles or bars according to the volume of supply and demand, in addition, it also marks HVL - High Volume Levels, with red dot lines (resistance) and green dot lines (support). Lines that serve as support and resistance zones. Zones between which the price moves most often, i.e. to which it returns and which it tests most often. 

Green bars - Demand
Red bars - Supply
Yellow bars - Climactic bars
White bars - Very low bars
Blue bars - Doji bar

Professionals must act quickly as soon as market conditions change. The only way to react so quickly is to understand and respond, almost instinctively, to what the market is telling them. They read the market through volume and its relationship to price movement.
You too can read the market just as effectively, but you have to know what you're looking at and what you're looking for.

This indicator is best used in combination with the other two indicators that I offer, namely VSA Supply and Demand and Volume Supply and Demand. Together they form a unity that is very effective in finding imbalances in the market.

******************************************************************************************************




推荐产品
MQL5 Market Description: CJ Smart Alpha Genesis - AI Connector CJ Smart Alpha Genesis - AI Connector MT5 is not just another Expert Advisor; it is your direct gateway to an institutional-grade Quantitative AI and Large Language Model (LLM) ecosystem. Designed for serious investors, prop-firm challengers (e.g., FTMO), and fund managers, this EA acts as a high-speed execution terminal on your MT5, while the heavy lifting—complex machine learning calculations, multi-timeframe matrix analysis, an
Oneiroi
Oleksandr Powchan
5 (1)
Oneiroi trades hard oversold and overbought conditions. On M15 you can achieve a very high hitrate. The system does not trade a lot because meeting the three conditions is quite hard. It will work on any pair and any broker but some are better than others. The EA will work also on small accounts but i would highly recomend to use a 100kcent account. Our Goal is to help you be way more profitable and way more stress free, so you can enjoy the things that are important to you and your family.
Xau Marti MT5
BILLY ARANDUQUE ABCEDE
Get the EA for FREE Just sign up and use my broker. Broker Link :  https://fbs.partners?ibl=684451&ibp=26113188 Setfile Here :  https://drive.google.com/file/d/1ZKvGf5KaUTZvrt2YE98a18sp7nzGUpVf/view?usp=sharing MT4 Version Here :  https://www.mql5.com/en/market/product/136465 XAU Marti The Smart Choice for Gold & Forex Traders -  Profit Potential! Why This EA Stands Out: RSI-POWERED ENTRIES   - Combines the reliability of RSI indicators with advanced money management for high-probabi
The Red Devil Shorter is a fully automatic short setup based on EMAs and SMAs. Attention:  Only 9 of 10 copies left at the price of $250, after that the price goes up to $499 Signal:  https://www.mql5.com/de/signals/1826330 We use this great EA exclusively for the EUR/CHF pair, as we developed it specifically for that. The idea behind the setup is the weakness the EUR/CHF shows in the default time.  The trades are mainly closed by counter signals or the set time. In rare cases, trades are closed
Smart Reversal Prophets
Loys Steve Dzene Tagne
Avez-vous toujours rêvé de pouvoir entrer sur le marché juste après la clôture d'une bougie… et de voir le marché évoluer immédiatement dans votre sens ? Avez-vous toujours souhaité détecter les retournements de tendance plus tôt, éviter les faux signaux et, surtout, saisir les tendances longues avant la majorité des traders ? Aujourd'hui, je vais vous présenter mon nouvel indicateur : Prophète du retournement intelligent. Contrairement aux indicateurs traditionnels qui réagissent avec un certa
CRT + Volume Profile  Candle Range Theory levels on several timeframes, filtered by the previous session's volume profile, with lower-timeframe entries (CISD / MSS) and strips of higher-timeframe candles drawn right of price. One indicator for the whole CRT workflow: where the range is, whether the sweep happened at a level that matters, and where the entry shift is. HOW THE CRT MODEL IS DETECTED - C1 is the range candle. Its high and low become CRT H and CRT L, with the 0.5 level between the
Core Scalper RSI
Ignacio Agustin Mene Franco
CORE SCALPER RSI A gold scalper that trades in the direction of momentum Core Scalper RSI gauges market strength using the RSI indicator, triggering only when momentum is clearly leaning in one direction. Designed for XAUUSD on the M5 timeframe—where gold moves rapidly and every second counts. The concept in 3 steps 1️⃣ Take the pulse The RSI determines who’s in control: if the momentum is bullish, it enables buy trades; if bearish, it enables sell trades. If the market is indec
Quantum Frequency Indicator MT5 Universal Market Frequency Analyzer for MT5 Trade Forex, Crypto, Stocks & Indices With Advanced Frequency-Based Signals Overview The Quantum Frequency Indicator (QFI) MT5 Version is a next-generation analytical tool designed to detect the hidden frequency structures within financial markets. Based on 14 years of research into market vibrations, price cycles and energy flow patterns, QFI provides traders with highly refined Buy and Sell zones across all major
Z Score Spring v2
Marcin Kucharski
Z-Score Spring v2 is a MetaTrader 5 oscillator based on a rolling Z-score. It measures how many standard deviations price (or log returns) has moved from its recent mean over N bars. Features: • Z-score line with levels at 0, ±Exit, ±Entry (defaults: 0, ±1, ±2) • Momentum colors on the line (visual only — arrows use Z-cross logic) • Long / short entry arrows on closed bars (default) Line colors (spring momentum, informational): • Silver — neutral (small Z change) • Orange — tension (Z and dZ
GoldEdge Pro Showtime
Vittaya Klangpimanarkart
GoldEdge Pro – Smart Pullback Trading System GoldEdge Pro is an advanced Expert Advisor designed for XAUUSD, focusing on pullback and dip-detection strategies within established market trends. The system is built to identify temporary price retracements and execute trades with structured confirmation and risk control. Core Trading Concept GoldEdge Pro is based on a pullback trading methodology: 1. Dip Detection Engine The system identifies short-term market retracements using EMA alignment (8 /
LiquiditySweepEngineAutoTargets Advanced Liquidity, Market Structure & Precision Signal Indicator for MetaTrader 4 LiquiditySweepEngineAutoTargets is an advanced multi-layer market analysis indicator designed to identify high-probability trading opportunities by combining market structure, liquidity behavior, order blocks, breakout confirmation, retests, dynamic support and resistance, higher-timeframe bias, and a weighted confluence scoring system into one unified MT4 trading tool. The system
Urgently mt5
Tatiana Savkevych
The Urgently indicator is designed to quickly determine the situation in the market, reflect the state of the market and signal profitable levels for opening trades. Market conditions change quickly enough, requiring constant calibration of trading strategies. Recommended for use in conjunction with any of the oscillators. The Urgently forex market trend indicator shows the trend direction and entry points. It smooths out price fluctuations when generating a signal by averaging the data and the
HLC Ticks Channel
Dmitiry Ananiev
Советник скальпер торгует в тиковом канале основанном на канале Дончиана. Уникальный алгоритм расчета канала учитывает тиковые движения рынка и подстраивается под канал, для получения максимальной прибыли.  Советник рассчитан на брокеров с минимальным спредом и комиссиями. Работает на многих кроссах. В роботе возможна торговля фиксированным лотом или лотом пропорциональным депозиту.  Так же предусмотрен виртуальный стоплосс который отрабатывает расширения спреда в Ролловер и на новостях.
# MT5 挤压动量指标 使用功能强大的**挤压动量指标**,释放爆发式市场机遇。该指标专为 MetaTrader 5 平台专业开发。 这款先进的波动率和动量指标可帮助交易者在重大市场行情发生前识别低波动时期。该指标结合了布林带和肯特纳通道的优势,揭示市场何时处于“挤压”状态,并准备突破。 内置的动量柱状图使趋势方向和动量变化一目了然,帮助交易者自信而精准地入场交易。 ## 功能特性 * 高级挤压检测系统 * 专业 MT5 平台实现 * 突破爆发前检测波动挤压 * 动态颜色变化的动量直方图 * 挤压状态点,方便解读市场状况 * 整合: * 布林带 * 肯特纳通道 * 线性回归动量 * 早期趋势转变检测 * 简洁流畅的独立窗口显示 * 完全自定义设置 * 轻量级优化,运行流畅 ## 动量直方图颜色 * 亮绿色 → 上涨动量增强 * 深绿色 → 上涨动量减弱 * 亮红色 → 下跌动量增强 * 深红色 → 下跌动量减弱 ## 挤压点颜色 * 白色 → 挤压开启(低波动/突破设置) * 金色 → 挤压释放(潜在突破行情) * 红色 → 无挤
Flashe
Kodjo Olivier Leonard Daga
FLASHE INDICATOR - La Révolution du Trading Intelligent PRÉSENTATION FLASHE INDICATOR est un système de trading de nouvelle génération qui repousse les limites de l'analyse technique traditionnelle. Développé par l'équipe DovTech, cet indicateur allie intelligence artificielle et algorithmes propriétaires pour offrir une expérience de trading unique. Conçu aussi bien pour le Day Trading que pour le Swing Trading, FLASHE s'adapte à toutes les conditions de marché et à tous les styles de
Nexus Target Pro Indicator Product Overview Nexus Target Pro is a technical indicator designed for breakout zone analysis. The tool charts a dynamic breakout box based on user-defined time ranges and plots arrow signals when price breaks out of the established zones. Technical Features Signal Generation: Displays non-repainting breakout direction arrows on the chart. Target Levels: Plots up to 5 calculated profit target levels based on the breakout box structure. Risk Levels: Displays a sugges
Kadenspikekiller
Netsai Mundawata
Boom & Crash AI Spike Detector MT5 – Advanced Edition + Weltrade Support Unlock the Next Generation of Boom & Crash Trading Experience a smarter way to trade with our Advanced AI Boom & Crash Spike Detector for MT5. Powered by enhanced AI technology and intelligent market filtering, this indicator delivers high-probability Buy and Sell signals with improved accuracy and reduced false entries. Designed for scalpers, day traders, and swing traders, the latest version combines precision, spee
Totz Gold Scalper EA
Dominador Bantillo Saturno
Gold Scalper Pro is a fully automated Expert Advisor designed specifically for intraday trading and scalping on Gold (XAUUSD). Built with advanced technical indicator confluence, dynamic ATR risk management, and built-in protection mechanisms, this EA aims to capture high-probability momentum moves while protecting capital. The EA includes a real-time, customizable dark-mode dashboard that displays active order stats, live spread, floating P&L, dynamic SL/TP distances, and account details dire
Gold Edge Guardian EA
Carlos Andres Castrillon Duenas
XAU Edge Guardian XAU Edge Guardian is an automated Expert Advisor developed specifically for trading XAUUSD on MetaTrader 5. The system continuously analyzes market conditions and manages trades according to a structured internal strategy. It is designed to provide disciplined execution, automatic trade management, and controlled exposure without requiring constant manual supervision. Main Features Fully automated trading for XAUUSD. Automatic buy and sell execution. Integrated Stop Loss and Ta
Aurum Knight Scalper
Donald Burne Pinnock
Aurum Knight Scalper — 一款通过 MQL5 市场验证的专业级剥头皮引擎,专为黄金(XAUUSD)打造。它不等待滞后指标发出信号 — 它在 tick 速度爆发和影线拒绝发生的瞬间立即反应,在图表附加时即刻开仓。当您享受生活时 — 享用午餐、搭乘航班、终于睡个好觉 — 这个不知疲倦的小引擎正紧盯着黄金的每一个 tick,测量最近 3 个 tick 的速度爆发,在价格假突破并瞬间反弹的那一刻嗅出流动性扫荡,并以让您的经纪商目瞪口呆的即时执行速度出击。它不滞后。它不抱希望。它不"等等看"。它看到,对照 H1 趋势验证,然后在您的大脑还没反应过来发生了什么之前就扣动扳机。 如果您没有它,这部分应该真正困扰您:您每交易一天黄金而没有这个机器人,您就把本应属于您账户的钱留在了桌面上。您像 2010 年那样手动计算手数。您在猜测止损距离时市场正在嘲笑您。您看着点差扩大,仍然像新手一样点击"买入"。Aurum Knight 不会做这些。它根据您的确切余额自动调整仓位规模,硬限制风险以确保您永远不会爆仓,使用 ATR 精度将止损和止盈适配实时波动率,在 1× ATR 时锁定盈亏平衡
Introduction This indicator detects volume spread patterns for buy and sell opportunity. The patterns include demand and supply patterns. You might use each pattern for trading. However, these patterns are best used to detect the demand zone (=accumulation area) and supply zone (=distribution area). Demand pattern indicates generally potential buying opportunity. Supply pattern indicates generally potential selling opportunity. These are the underlying patterns rather than direct price action. T
Smart Liquidity Profile MT5
Suvashish Halder
5 (2)
The Smart Liquidity Profile is color-coded based on the importance of the traded activity at specific price levels, allowing traders to identify significant price levels such as support and resistance levels, supply and demand zones, liquidity gaps, consolidation zones, Buy-Side/Sell-Side Liquidity and so on.  Smart Liquidity Profile allows users to choose from a number of different time periods including 'Auto,' 'Fixed Range,' 'Swing High,' 'Swing Low,' 'Session,' 'Day,' 'Week,' 'Month,' 'Quart
Quantum bot
Samuel Bedin
quantum bot designed for forex trading. test on eur/usd gives good returns. based on several indicators include risk management. best timeframes 1h; 4h. this bot was backtesting for the past year and gives 2000% return profit. no hidden lost trades in code. settings are customizables to give you better experience of trading. contact me for more details or installation guide
精简说明(主展示) FVG Decision Checklist 市场结构与决策状态观察指标 本指标用于 交易逻辑观察与决策状态分析 , 不用于自动交易执行 。 核心特性: 不下单 不提供买卖点 展示当前市场是否 允许或不允许 考虑交易方向 关注 结构与过程 ,而非入场点 指标主要评估: 公平价值缺口(FVG)的结构有效性 市场行为确认(扫流动性 / 推动 / 回踩) 波动率与风险环境(基于 ATR) 最终输出如 ALLOW / WAIT / RISK HIGH 表示的是 系统状态判断 ,而非交易指令。 ️ 本指标为 逻辑观察与研究用途 发布。 指标内弹窗 / 注释说明 重要说明(Important Notice) 本指标 不会生成交易入场点 。 所有显示的文字与状态,均为 决策状态提示 ,例如: 当前市场结构是否成立 条件是否完整 当前风险是否偏高 常见状态包括: ALLOW_LONG / ALLOW_SHORT WAIT RISK_HIGH / NO_TRADE 这些状态的含义是: “系统正在评估是否具备交易前提条件” 而不是 “此刻应当下单” 具体的交易
An ICT model Twenty Two
Brighton Mufaro Mudzingwa
ICT TWENTY TWO MODEL Unlock institutional-grade price action trading with our precision MetaTrader 5 port of the renowned ICT Model 2022 framework . Whether you are trading major Forex pairs or high-volatility Synthetic Crash Indices that spike, this algorithm automates complex concepts so you can catch high-probability entries effortlessly. Core Features & AdvantagesNon-Repaint Guarantee: Structure and signals are strictly confirmed on closed bars only, ensuring your historical backtests and li
ENGLISH DESCRIPTION (MQL5 Standard Optimized) Product Name: BW SiegeTank28 EM AI (MT5) [Subtitle: Cognitive Order Flow | 17-Sensor Kinetic Matrix | Prop-Firm EDSM Architecture] IMPORTANT! After your purchase, simply send me a private message and I’ll provide you with the installation guide and setup instructions. Introduction: Command the Kinetic Accumulation Phase Welcome to the absolute pinnacle of institutional algorithmic execution. BW SiegeTank28 EM AI is an enterprise-grade Expert Advis
Determining the current market trend is a key task for successful trading. It is for this purpose that the Book Scheme indicator was developed, which is an advanced algorithm for visually displaying a trend on a chart. Many traders dreamed of having reliable moving averages that kept up with the market. It was this dream that I turned into reality with the help of my indicator. Book Scheme allows you to predict future values ​​and create accurate signals for entering and exiting the market. T
OrderFlow Quantum Pro (OFQP) Stop guessing where the big money moved. See it scored, filtered and drawn on your chart. Optimized for XAUUSD (Gold). Works on any symbol and timeframe, with M5 to H1 as the primary focus. Most indicators show you arrows. OFQP shows you the reasoning behind them. Gold punishes traders who rely on a single indicator. It hunts stops, fakes breakouts and reverses hard from liquidity. Moving-average crosses and RSI flips were never built for that. OFQP is built around h
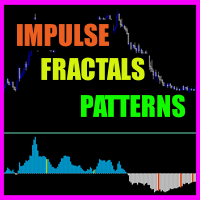
Impulse fractals indicator - is counter-trend oriented complex market fractal pattern.  Market creates bull/bear impulse, trend starts, fractals on impulsed wave are an agressive pullback signals. Buy arrow is plotted when market is bearish and it's impulse showed up-side fractal, and sell arrow is plotted when market is bullish and it's impulse showed dn-side fractal. Main indicator's adjustable inputs : impulsePeriod - main period of impulse histogram  filterPeriod  - smoothes impulse accordi
Gold Squeeze Pro
Dmitriq Evgenoeviz Ko
Gold Squeeze Pro MT5 — Алгоритм "Золотого Треугольника" Gold Squeeze Pro — это высокотехнологичный торговый эксперт, разработанный специально для работы с золотом ( XAUUSD ) на таймфрейме M5 . В основе алгоритма лежит стратегия «Золотого Треугольника», объединяющая фазовый анализ волатильности (Bollinger Bands + Keltner Channels) с импульсными фильтрами Vortex и Momentum. Результаты стресс-тестирования (Historical Backtest): Начальный депозит: $500 Конечный результат: $13,000,000+ Профит-фактор
该产品的买家也购买
ARIPoint
Temirlan Kdyrkhan
1 (4)
ARIPoint is a powerful trading companion designed to generate high-probability entry signals with dynamic TP/SL/DP levels based on volatility. Built-in performance tracking shows win/loss stats, PP1/PP2 hits, and success rates all updated live. Key Features: Buy/Sell signals with adaptive volatility bands Real-time TP/SL/DP levels based on ATR Built-in MA Filter with optional ATR/StdDev volatility Performance stats panel (Success, Profit/Loss, PP1/PP2) Alerts via popup, sound, push, or email Cu
Boba Analysis Suite
Trade Ready Solutions LLC
5 (2)
Boba Analysis Suite Boba Analysis Suite 是一款适用于 MetaTrader 5 的分析指标。它将市场结构、关键价格区域和整体市场背景整合到同一图表视图中。 该指标源于交易及交易教学的实践经验,旨在帮助用户建立有条理的分析流程:评估市场方向、识别重要价位,并结合多个时间周期进行分析。 结合市场背景进行分析 单个信号的意义取决于市场背景。Boba Analysis Suite 帮助用户将当前图表状况与更大范围的市场结构相结合,并根据预先制定的规则评估交易思路。 分析功能包括: **趋势与市场结构:**评估市场方向及相关结构背景。 **关键价格区域与价位:**在图表上直观标示值得进一步分析的重要区域。 **多时间周期:**整合不同时间周期的信息,评估整体市场背景。 **可视化分析流程:**直接在图表上查看分析信息。 自主做出交易决策 Boba Analysis Suite 适合希望系统分析图表并结合多个时间周期信息的交易者。 该指标用于辅助分析,不会开仓或平仓,也不能替代交易策略或风险管理。每一笔交易的决策均由用户自行做出。 使用与许可 平台:Meta
AriFocus
Temirlan Kdyrkhan
AriFocus - Non-Repainting Buy/Sell Signals AriFocus - one clear signal. AriFocus marks buy and sell signals directly on the chart and suggests a stop-loss level for each one. Every signal is confirmed on bar close and never repaints. - Buy/sell arrows, confirmed on bar close - Suggested stop-loss level for every signal - Trend band and candle coloring to show direction at a glance - 10 ready-made presets, or your own settings (14 calculation methods) - Pop-up, push and email alerts with entr
OrderFlow Absorption – 專業級MT5買賣差與吸收訊號指標 釋放真正訂單流分析的力量,OrderFlow Absorption 是MetaTrader 5上最強大的買賣差(Delta)直方圖與吸收訊號指標。專為想看清每一個價格波動背後真相的交易者設計,這個工具揭示了隱藏的買賣壓力與推動市場的吸收事件。 功能特色 買賣差直方圖視覺化:   以清晰的色彩直方圖即時顯示買方與賣方壓力。 吸收訊號偵測:   先進邏輯自動辨識多空吸收事件,及早預警潛在反轉。 圖表標記:   吸收訊號直接標示於主圖表,方便視覺辨識。 彈出式警報:   新吸收訊號出現時即時通知。 自訂門檻:   過濾弱訊號,專注高勝率機會。 資源管理:   高效運算,適用於大型圖表也能流暢運行。 全品種兼容:   適用於任何商品與週期,包括外匯、指數、商品等。 簡易整合:   參數簡單,快速上手與調整。 OrderFlow Absorption 的邏輯說明 OrderFlow Absorption 採用專利演算法,能在沒有完整Tick數據的情況下,估算每根K棒的買賣壓力(Delta)。它分析成交量、價格行為、K
Meravith Scanner
Ivan Stefanov
5 (3)
MERAVITH SCANNER 是一款适用于 MetaTrader 5 的专业金融市场指标,将多种分析工具整合为一个统一的系统。它基于专有的成交量加权平均价格(VWAP)方法自动完成所有计算,完全消除主观判断。 该指标适用于所有资产类别(外汇、股票、指数、大宗商品、加密货币)以及从 M1 到 Monthly 的所有时间周期。其核心原理是价格跟随成交量。MERAVITH 识别机构资金成交量的集中区域,并从该集中区域中推导出数学上精确的价格水平。它不预测,不推测。它只计算。 使用 MERAVITH SCANNER,您可以在 2–3 分钟内扫描全部 28 个主要外汇货币对的所有时间周期。您也可以扫描任何您选择的市场——例如,大约 100 只股票约需 10 分钟。 该指标计算耗尽水平、平衡线、偏差、统计水平以及目标投射。 图表元素 Origin Point 标记所有计算的起始位置。指标会自动将其放置在最佳位置。红色标签(TOP)表示市场高点并带有看跌倾向。绿色标签(BOTTOM)表示市场低点并带有看涨倾向。 Sentiment Line 是一条动态曲线,反映基于成交量加权计算得出的市场情绪。
TrendMaestro5
Stefano Frisetti
note: this indicator is for METATRADER4, if you want the version for METATRADER5 this is the link:  https://www.mql5.com/it/market/product/108106 TRENDMAESTRO ver 2.5 TRENDMAESTRO recognizes a new TREND from the start, he never makes mistakes. The certainty of identifying a new TREND is priceless. DESCRIPTION TRENDMAESTRO identifies a new TREND in the bud, this indicator examines the volatility, volumes and momentum to identify the moment in which there is an explosion of one or more of these da
Meravith MT5
Ivan Stefanov
5 (3)
MERAVITH 是一款适用于 MetaTrader 5 的多周期成交量与流动性指标,它在每一个时间周期上显示趋势、支撑与阻力区域、入场、目标和止损。它为您提供完整的市场流动性地图,一个对冲基金风格的流动性工具,并用专有的成交量加权平均价格方法自动完成全部计算,因此没有主观解读。 适用于外汇、黄金(XAUUSD)、指数和加密货币,适用于所有时间周期。 购买后赠送:一套关于如何用 MERAVITH 交易的视频课程。购买后请给我发消息。 MERAVITH 的功能 分析所有时间周期,并显示每个周期上正在生效的趋势。 标记流动性区域(Volume Equilibrium),即多头与空头成交量相等的位置。 将所有时间周期的流动性水平直接显示在您的图表上。 写出市场的文字分析供您参考。 根据当前趋势计算入场、目标、支撑位和止损。 计算您交易的风险回报比。 按您的账户余额计算仓位大小,并估算潜在利润。 在市场出现重要变化时提醒您:警报、电子邮件和推送到手机的通知。 主要线条 Bullish / Bearish Volume Exhaustion 线:目标位。 趋势线:随趋势改变颜色(多头或空头),显
Cycles Plotter
Edoardo Centorame
Cycles Plotter 带移动平均线和开始日期的可自定义周期指标 Cycles Plotter 是一种高级技术指标,可根据用户输入绘制两个完全可自定义的正弦周期。它不会自动生成周期:所有周期都完全根据用户设置的参数计算,为交易者提供一种视觉工具,用于研究价格波动和潜在的趋势变化,而不产生自动信号或预测。 关键点: 用户定义的周期:周期 1 P1 和 2 P2 完全由用户配置。可以设置周期长度、幅度、移动平均线以及精确的开始日期和时间。如果用户未输入参数,则不会绘制任何周期。 幅度控制:每个周期可以具有不同的幅度,从而可以相对于参考移动平均线调整波动的高度。 趋势检测:快速和慢速移动平均线表示周期的方向: Fast MA 大于 Slow MA 上涨阶段 绿色 lime Fast MA 小于 Slow MA 下跌阶段 magenta 红色 Fast MA 约等于 Slow MA 横向阶段 flat 橙色 蓝色 周期绘图:每个周期有三条独立的线: 上涨阶段 绿色 lime 下跌阶段 magenta 红色 横向阶段 flat 橙色 蓝色 可自定义的开始日期和时间:可以定义每个周期开始绘制
AriX
Temirlan Kdyrkhan
1 (4)
AriX Indicator for MT5 A powerful trend-following and signal-evaluation tool AriX is a custom MT5 indicator that combines Moving Averages and ATR-based risk/reward logic to generate clear buy/sell signals. It visualizes dynamic SL/TP levels, evaluates past trade outcomes, and displays win/loss statistics in a clean on-chart panel. Key features include: Buy/Sell signals based on MA crossovers ATR-based SL/TP1/TP2/TP3 levels with visual lines and labels Signal outcome tracking with real-time stat
看清市场真正在做什么。   在您眼前实时观察三大市场阶段(收缩、扩张、趋势),并在趋势阶段的早期阶段抓住更优的入场点。   不要再猜测。开始像机构和聪明钱那样解读市场。   Apex Market Structure Pro(MT5 版)是一款精准的聪明钱分析工具,它剥离噪音,向您展示每根 K 线之下的真实结构:流动性、结构转变、吸   筹区域与趋势偏向,全部呈现在一个简洁、专业的图层中。专为厌倦了滞后指标、准备以清晰视角交易的严肃交易者打造。   重要提示:本指标专为 Heikin Ashi(平均足)K 线设计。使用前请将图表切换为 Heikin Ashi,以释放其全部威力。全部分析都围绕 Heikin   Ashi 的价格流构建。正是在这里,Apex Market Structure Pro 发挥出最佳表现。   交易者为何选择 Apex Market Structure Pro:   流动性,一览无遗: 瞬间看清止损池所在之处。卖方与买方流动性会被自动标注。实时关注尚未被扫的价位,捕捉价格攫取流动性并反转的精确时   刻。在聪明钱交易的地方交易。   会说话的结构:
FX-AIEA 供给需求区智能识别指标(Supply and Demand Indicators MT5)——技术原理与参数讨论 版本:2.51 | 适用平台:MetaTrader 5 引言 供给需求区是机构订单流的重要表现形式,相比传统支撑阻力位能更直接地反映买卖力量的失衡。本指标尝试通过算法自动识别高概率供需区域,以减少手动绘制的耗时与主观性。其核心逻辑基于自适应 ZigZag 算法,提取波峰波谷并生成区域标识 。 核心技术特点 全自动绘制机制 :基于改良版 ZigZag 动态提取有效极值,标记潜在供给区与需求区。指标遵循 MQL5 原生   prev_calculated   机制,在新 K 线生成时自动重绘,支持跨周期强制计算( Forced_TimeFrame   参数)。 区域边界模式 :支持宽带(覆盖K线影线极值)与窄带(仅覆盖实体)两种模式,用户可通过   use_narrow_bands   参数切换,以适应不同交易风格。 滤噪算法 :启用   kill_retouch   后,自动剔除被后续行情反复轻触但未有效突破的弱势区域,以提升信号有效性。 视觉与性能 :支持自
ORB Seeker MT5
Marcela Goncalves De Oliveira
特价促销,限量供应,保持产品稀缺性! 仅售 599 美元! 购买后请联系我以获取奖励的 ORB Seeker EA 和个人优化设置文件。 自信地捕捉干净利落的比赛片段! ORB Seeker MT5 是一款专业的开盘区间突破 (ORB) 指标,专为追求准确性、简洁性、灵活性和清晰图表结构的交易者而设计。 它能自动绘制任何交易品种的盘前或自定义交易时段区间,然后给出清晰的突破信号,包括入场点、止损点、止盈点以及可选的50%部分止盈位。所有数据均实时计算并直接显示在图表上。 您可以选择交易伦敦开盘、纽约交易时段、亚洲交易时段,或者自定义交易时段。ORB Seeker MT5 会自动适应您选择的交易时段,让您精准掌握市场波动范围、突破位和交易位。 每次购买均免费赠送 ORB Seeker EA 智能交易系统。该 EA 系统读取指标的突破信号并可自动下单,您可以选择手动交易,也可以让 EA 系统根据指标的信号逻辑自动处理入场。   为什么选择 ORB Seeker MT5 支持多个交易时段 - 您可以自行设置伦敦、纽约、亚洲或自定义交易时段的盘前交易时间和交易时段。 完整的突破视觉效果 -
Volume Arrow Signal Product Description Volume Arrow Signal is a smart trading indicator designed to help traders identify potential buy and sell opportunities using price action, volume behavior, and directional arrow signals. The indicator places clear arrows directly on the chart, making it easy to spot possible market reversals, trend continuations, and entry opportunities without spending hours analyzing charts manually. Whether you are trading Gold (XAUUSD) , Forex pairs, Indices, or Crypt
Gold Xausd Hunter
Metin Erkamoglu
5 (2)
MATADOR GOLD XAUUSD M5 Scalp Signals for MT5 MATADOR GOLD is a decision-support indicator for MetaTrader 5, designed for traders who analyze short-term Gold movement on the M5 timeframe. The indicator does not open, close, or manage trades automatically. It provides buy and sell signal guidance so the user can make their own trading decisions according to their risk plan, broker conditions, and trade management rules. Main purpose MATADOR GOLD is built to help traders avoid noisy signal flow and
Zain Gold ScalpingV5
Ahmed Gamal Abdel Nasser Mohamed
Zain Gold Scalping V5 is a technical analysis indicator for MetaTrader 5 designed for Forex and Gold markets. It provides chart-based market information, trend analysis, signal conditions, and an on-screen dashboard to help traders analyze price movement across multiple timeframes. Main Features The indicator supports multiple timeframes, including M1, M5, M15, M30, H1 and higher timeframes. It can be used with Gold (XAUUSD), Forex currency pairs, indices and other supported instruments. The in
KenKem Master Volume Profiler - Brief Introduction A Display-only volume-profile cockpit for XAUUSD, BTCUSD and other liquid symbols. Draws profile structure, multi-timeframe flow, EMA trend and study-only setup markers. Places no orders. Not a signal service.  It maps where the market has actually traded and reads recent order flow, so you can see structure and lean at a glance.  What it shows: Master and local volume profiles (POC and value-area high/low) - the price shelves that matter. A liv
VTrende Pro
Andrii Diachenko
5 (1)
VTrende Pro - MTF indicator for trend trading with a display panel for MT5 *** Videos can be translated into any language using subtitles (video language - Russian) Although the signals of the VTrende Pro indicator can be used as signals of a full-fledged trading system, it is recommended to use them in conjunction with the Bill Williams TS. VTrende Pro is an extended version of the VTrende indicator. Difference between Pro version and VTrende: - Time zones - Signal V - signal 1-2 waves -    S
First time on MetaTrader, introducing IQ Star Lines, an original Vedic Astrology Based Intraday Trading Indicator. We don't offer free or bonus indicators in exchange of reviews from you. You won't need any free products with this indicator to make it work. ;) Enjoy! Welcome to the new and updated  IQ Star Lines , the ultimate fusion of ancient planetary cycles and modern quantitative trading, published for the first time on Metatrader. This is an indicator built by the developer, who has spent
Boom & Crash & PainX & GainX Ultimate Spike Detector Trade Spikes With Confidence — Not Guesswork Catching spikes should be one of the most profitable strategies in synthetic markets. But for most traders, it becomes one of the most frustrating. You enter too early… price goes against you. You wait for a spike… it never comes. You finally catch one… but don’t know whether to hold or close. You make profit… then give it all back because there’s no exit plan. This is exactly the problem the Ultim
历史相似性匹配指标  概述 历史相似性匹配器(Historical Similarity Matcher)是 MetaTrader 5 的技术分析指标。它扫描历史价格数据,寻找与用户在图表上选定的参考时期具有统计相似性的片段。当找到匹配时,指标会显示历史模式,并根据这些历史片段的后续走势绘制潜在未来价格走势的投影。 本指标仅供教育和分析用途,不构成财务、投资或交易建议。不保证结果或盈利能力。过去表现不代表未来结果。交易存在重大损失风险。用户对自己的交易决策和结果负全责。  功能特点 - 识别与选定参考时期具有相关性的历史价格片段 - 支持正向和反向模式匹配 - 显示多个匹配的历史模式(数量可配置) - 为每个匹配绘制基于历史延续的独立投影线 - 可选 OpenCL 支持,在兼容硬件上加速计算(不支持时回退到 CPU) - 适用于任何时间周期和交易品种 - 允许在不同于当前图表的时间周期上进行扫描 - 在图表上提供启动扫描和导出结果的按钮 - 导出每个匹配的截图以及包含匹配详情的 CSV 文件  工作原理 1. 用户通过在图表上放置两条垂直线或在输入参数中设置日期来选择
一句话理解 这是一个 二合一的智能指示器 ——把 RSI 和 MACD 两位“专家”的意见打包成一个简单的结论:出现箭头,就行动;没有箭头,就等待。 而且箭头 不会重绘 ,收盘后是什么样,永远就是什么样。 它解决了什么问题 很多交易者同时看 RSI(判断动量和超买超卖)和 MACD(判断趋势方向),但两者经常给出矛盾信号。 这个指示器的做法是: 只有两人同时同意 ,才发出信号。这就过滤掉了大量假信号和模糊时段。 你实际看到的东西 独立的指示器窗口(不遮住 K 线图) 清晰的 买入箭头 和 卖出箭头 放大版的 MACD 柱状图(更容易看清动量变化) RSI 和 MACD 的线依然在,但你的注意力只需放在箭头上 谁适合用 新手 :不用学两个指标如何配合,跟着箭头做即可 老手 :节省时间,快速过滤噪音,且不重绘的特性让回测结果可信 所有讨厌信号闪烁的人 为什么它不重绘 因为它的判断逻辑基于 完整收盘后的价格数据 。信号只有在满足条件的那一刻才会固定下来,之后不会因为后续 K 线的变化而修改之前的箭头。 这意味着你可以放心做回测,也能在实盘中信任你看到的每一个信号。 底层特点(不复杂地说) 它
MasterTrend
Temirlan Kdyrkhan
MasterTrend Indicator for MT5 A powerful trend-following and signal-evaluation tool MasterTrend   is a custom MT5 indicator that combines Moving Averages and ATR-based risk/reward logic to generate clear buy/sell signals. It visualizes dynamic SL/TP levels, evaluates past trade outcomes, and displays win/loss statistics in a clean on-chart panel. Key features include: Buy/Sell signals based on MA crossovers ATR-based SL/TP1/TP2/TP3 levels with visual lines and labels Signal outcome tracking wit
Volality 75 Boom crash VIX
Cristofher Robles
4.5 (2)
Volatility 75 Boom Crash VIX Pro V2 Volatility 75 Boom Crash VIX Pro V2 is a high-performance trading indicator specifically engineered for Synthetic Indices (Deriv) and Forex . This tool focuses on identifying institutional liquidity zones and generating high-accuracy, non-repainting signals based on Price Action and Fibonacci levels. Key Advantages: No Repainting: Once a signal arrow appears and the candle closes, it will never move or disappear. Institutional Liquidity Zones: Automatically ca
SMC Sweep Fvg MT5
Daniil Sleptsov
5 (1)
SMC Sweep Fvg MT5 — 像聪明钱一样看市场,就在你的图表上 你一定有过这种感觉:价格扫掉你的止损,随后反转,并正好走到你预期的方向。方向你是对的,错的只是入场。 这个指标就是为了让这类情况少发生。它接手分析中最繁重的部分——图表标注,把真正重要的留给你:决策。 你会在图表上看到什么 市场结构 — 真实的结构高点与低点,带有 HH / HL / LH / LL 标记和水平线。趋势一目了然,无需猜测。 失衡区(FVG) — 价格推进过快、之后常会回补的区域。未回补与已回补的区域用不同颜色显示。 流动性行为 — 指标跟踪市场在反转前扫过关键水平的时刻。 现成的交易布局 — 入场箭头、止损位与盈利目标。全部画好,无需心算。 趋势过滤 — 更高周期的趋势线,帮你站在主趋势一侧。 指标关注流动性扫荡、失衡形成与结构状态——并只突出这些因素同时对齐的情形。 统计面板——回应每一个疑虑 你不必只听别人说。图表上的内置面板会按所选历史显示: 分析周期(K线数量); 检测到的情形总数; 多少到达目标、多少触及止损; 仍在运行中的数量; 以点数计的净结果。 切换品种——面板重
==================================================================== SMC Pro v6.1 APEX AI — XAUUSD Gold Empire MetaTrader 5 指标 · Smart Money Concepts · 预测智能引擎 ==================================================================== SMC Pro v6.1 APEX AI 是一套专业的 Smart Money Concepts 指标系统,专为 MetaTrader 5 上的 XAUUSD(黄金)打造。 它将完整的 SMC 框架——Order Blocks、Liquidity sweeps(流动性扫荡)、Fair Value Gaps、Break of Structure、Change of Character——与 8 个全新的 AI 驱动模块相结合,直接在图表上呈现精准的可视化信号、预测轨迹线、彩色的 SL/TP 风险回报框,以及三级自适应 TP Ladde
PrimeScalping
Temirlan Kdyrkhan
PrimeScalping is a powerful trading companion designed to generate high-probability entry signals with dynamic TP/SL/DP levels based on volatility. Built-in performance tracking shows win/loss stats, PP1/PP2 hits, and success rates — all updated live. Key Features: Buy/Sell signals with adaptive volatility bands Real-time TP/SL/DP levels based on ATR Built-in MA Filter with optional ATR/StdDev volatility Performance stats panel (Success, Profit/Loss, PP1/PP2) Alerts via popup, sound, push, or e
Elliott Wave Engine
Enrique Gauto Sand
Elliott Wave Engine The Auto Elliott Engine is a tool designed for MetaTrader 5 that automates the identification, decomposition, and projection of price structures based on the Elliott Wave Theory. Powered by a pattern-recognition engine, this indicator processes price action to identify market configurations, translating data into structured scenarios. Key Features Multi-Degree Recognition: Analyzes price action across multiple fractal levels. From higher degrees, such as Supercycle or Cycle,
TraderHUD
Justino Porto Neto
5 (1)
TraderHUD v2 — 专业交易者的完整面板 TraderHUD v2 是 MetaTrader 5 最完整可视化指标的进化版本。它将交易者在图表上需要看到的所有信息整合到一个工具中,以做出更明智的决策:时间背景、美元强度、统计区间、枢轴点位、运动速度和宏观趋势——全部集成、可配置且不会使图表显得杂乱。 此版本基于实盘交易的实际使用经验构建,遵循明确的理念: 更多背景,更少噪音 。 v2 新增功能 将 8 个模块完全整合到单一指标中 可配置的侧边面板,DayRange 和 DollarFlow 自动衔接 市场时段标记与整点时间一起显示 经典枢轴点,可选择在各水平之间显示均线 两个标记为测试版的实验性模块:波动率和宏观趋势均线 完全可配置的布局——角落位置、宽度、颜色和字体 模块 计时器与点差 当前K线的倒计时,每500毫秒更新一次,不依赖于tick 计时器旁边显示实时点差 可配置的分隔符——计时器默认为"t",点差默认为"s" 智能锚定:当价格接近底部边缘时,文本会自动上移 整点时间与市场时段 垂直线指示下一个整点时间——新资金可能进入的时刻 带有时间和开盘时段名称的标
XCalper TFO
Aecio de Feo Flora Neto
This oscillator was developed exclusively by xCalper in 2015 based on moving averages calculations to indicate and try predicting oversold and overbought levels. The fast line (white, by default) oscillates basically between values -0.5 (oversold) and +0.5 (overbought). Whenever this line crosses upward value -0.5, it means an oversold price level. When it crosses downward value +0.5, it means an overbought price level. When fast line crosses value 0.0 and returns, it is a strong pull-back indic
筛选:
无评论
回复评论