Bears CD HTB

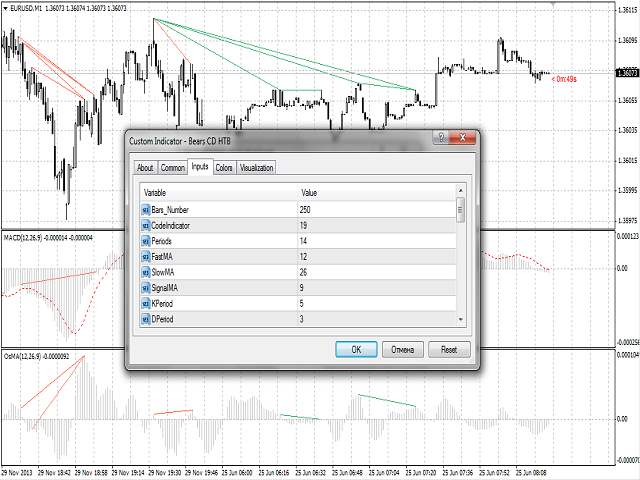
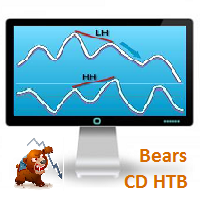
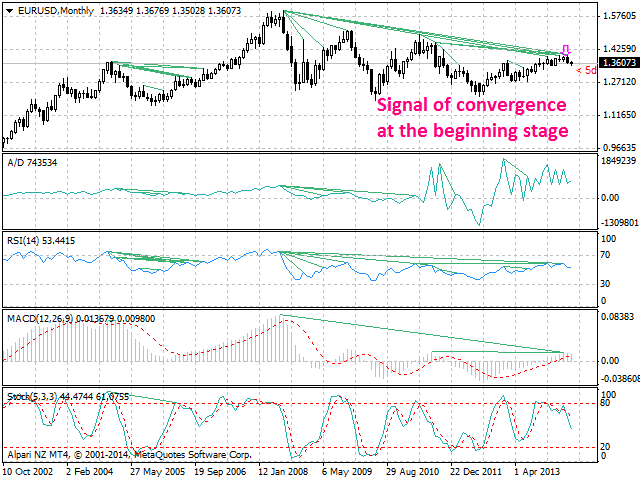
Bears CD HTB (Bears Convergence/Divergence High Top Bottom) is a universal analytical bears convergence/divergence indicator between a financial instrument and any of the twenty two standard indicators included in МetaTrader 4 package. The indicator is the second out of the two possible versions (HBT and HTB) of the bearish convergence/divergence origins.

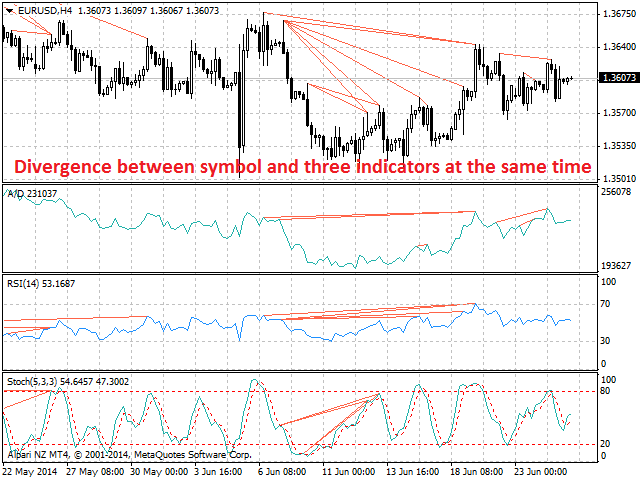
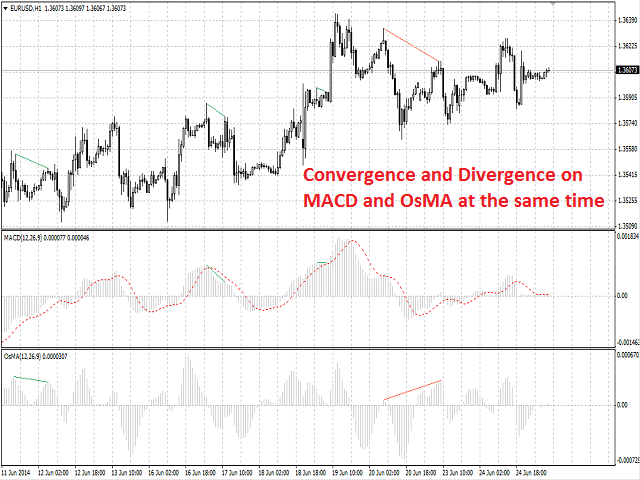
Due to its multiple use feature, the indicator allows you to find convergences/divergences between the price and various standard indicators simultaneously.

Users can select the sell graphical symbol and its width, as well as the color of convergence/divergence lines.


Features

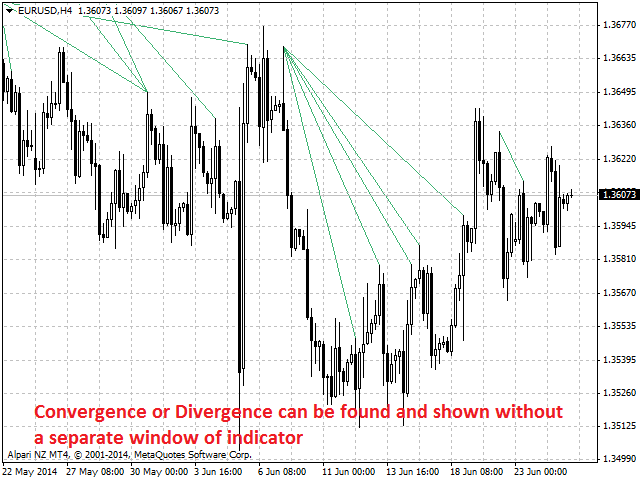
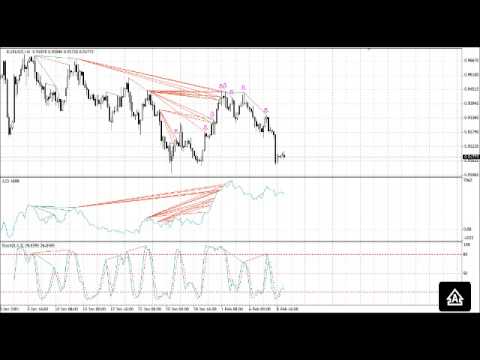
The indicator is not a lagging one. It works by ticks and is able to show convergence/divergence in the symbol's window even if there is no a separate window with a conventional indicator used for search. This allows you to open additional windows with any other indicators for a joint analysis.

As an option, the indicator can notify of a new signal using the graphical sell symbol instead of convergence/divergence lines.

In most cases, convergence/divergence is considered to be confirmed if it takes the form of a line with a graphical symbol remaining on the chart.

Attention: Since the indicator is downloaded, graphical symbols are displayed in the main window only after a new convergence/divergence signal appears (unlike convergence/divergence lines). Graphical symbols are not displayed for the past periods (before the indicator was downloaded).
If convergence/divergence lines are absent in the main window after launching the indicator, keep switching timeframes, till they are detected. Absence of lines indicates the absence of convergence/divergence on the current timeframe. If the lines are present only in the main window, but not in the additional one, you should recheck the type and the specified parameters of the basic indicator, for which you want to find convergence/divergence.

The indicator's operation is displayed in the attached video. 

The indicator can notify of the appearance of a formed signal by playing an audio signal, as well as display the time remaining until the end of the formation of the current bar in the format of <d:h:m:s, where:

  • < - the current bar.
  • d - days.
  • h - hours.
  • m - minutes.
  • s - seconds.

Sample e-mail notification:

  • Subject: Bears CD HTB Signal
  • Message: Signal,M30 - Bearish Convergence between EURUSD and A/D - 2014.08.06 10:18:00


Purpose

The indicator can be used for manual or automated trading within an Expert Advisor. Values of indicator buffer of the double type can be used for automated trading: 

  1. Sell signal - buffer 0, must not be zero.


Input Parameters

  1. Bars_Number - number of bars for calculation.
  2. CodeIndicator - basic indicator code:
    • 0 - AD (an indicator of accumulation and distribution of volume) - (default).
    • 1 - OBV (On Balance Volume).
    • 2 - Volume (tick volume indicator).
    • 3 - Force (Force Index indicator).
    • 4 - %R (Bill Williams oscillator).
    • 5 - ATR (Average True Range).
    • 6 - CCI (Commodity Channel Index).
    • 7 - DeMarker (DeMarker indicator).
    • 8 - BW MFI (Market Facilitation Index).
    • 9 - MFI (Money Flow Index).
    • 10 - Momentum (Momentum indicator).
    • 11 - RSI (Relative Strength Index).
    • 12 - RVI (Relative Vigor Index).
    • 13 - Standard Deviation.
    • 14 - Stochastic.
    • 15 - ADX (Average Directional Movement indicator).
    • 16 - AC (indicator of acceleration).
    • 17 - AO (Williams' oscillator).
    • 18 - Gator (Bill Williams' Alligator).
    • 19 - MACD (moving average convergence/divergence).
    • 20 - OsMA (moving average of oscillator).
    • 21 - BearsPower.
    • 22 - BullsPower.
  3. Periods - basic indicator calculation period.
  4. FastMA - fast Moving Average calculation period for basic MACD or OsMA.
  5. SlowMA - slow Moving Average calculation period for basic MACD or OsMA.
  6. SignalMA - calculation period of basic MACD or OsMA indicator's signal line.
  7. KPeriod - К period of basic Stochastic.
  8. DPeriod - D period of basic Stochastic.
  9. Slowing - Slowing period of basic Stochastic.
  10. Stoch_Price - basic Stochastic's price type:
    • Low/High (by default).
    • Close/Close.
  11. Price_Field - Stochastic averaging type:
    • Simple.
    • Exponential (by default).
    • Smoothed.
    • Linear weighted.
  12. Jaw_Period - blue line (Alligator's Jaws) averaging period of the basic indicator.
  13. Jaw_Shift - basic indicator's blue line shift relative to the price chart.
  14. Teeth_Period - red line (Alligator's Teeth) averaging period of the basic indicator.
  15. Teeth_Shift - basic indicator's red line shift relative to the price chart.
  16. Lips_Period - green line (Alligator's Lips) averaging period of the basic indicator.
  17. Lips_Shift - basic indicator's green line shift relative to the price chart.
  18. Applied_Price - the price used:
    • Close price (by default).
    • Open price.
    • High price.
    • Low price.
    • Median price.
    • Typical price.
    • Weighted price.
  19. MA_Method - method of averaging:
    • Simple.
    • Exponential (by default).
    • Smoothed.
    • Linear weighted.
  20. Mode - the index of the line (MAIN - 0 (by default) or SIGNAL - 1) of the basic indicator, based on which ADX, RVI, Stochastic, Gator or MACD are calculated.
  21. Arrow_Symbol - graphical sell symbol type (recognizes one of the eight user-defined symbols, see the screenshot):
    • 68
    • 72
    • 159
    • 218
    • 222
    • 226 (by default)
    • 234
    • 242 
  22. Arrow_Width - graphical symbol width (allowable values - 1, 2, 3, 4 and 5).
  23. Sound_Mail_Numbers - number of audio and e-mail notifications on the last two bars.
  24. DrawLineInd - display of convergence/divergence line.
    • true - draw the lines (by default).
    • false - do not draw the lines.
  25. Convergence - calculating convergence or divergence:
    • true - convergence (by default).
    • false - divergence.
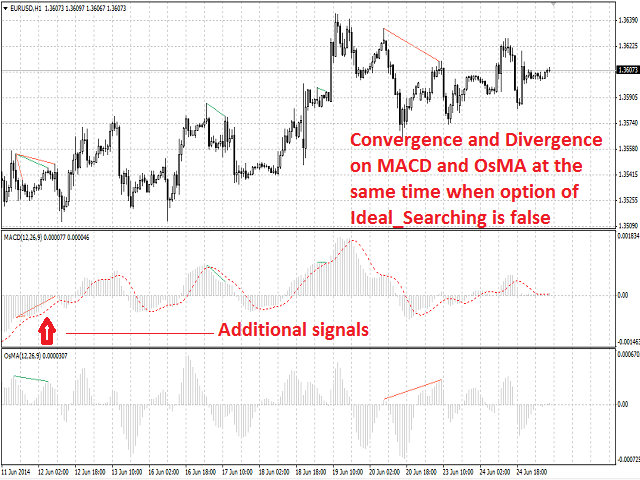
  26. Ideal_Searching - searching onvergence/divergence in non-ideal conditions:
    • true - ideal search conditions (by default).
    • false - non-ideal search conditions.
  27. Play_Sound - enable/disable sound notification.
  28. Show_Time - displaying time remaining until the formation of the current bar.
  29. Send_Mail - send an e-mail notification.
  30. ConvLevelColor_1 - color of the convergence line in the main window.
  31. ConvLevelColor_2 - color of the convergence line in the additional indicator window.
  32. DivLevelColor_1 - color of the divergence line in the main window.
  33. DivLevelColor_2 - color of the divergence line in the additional indicator window.
推荐产品
Description Bulls CD LBT (Bulls Convergence/Divergence Low Bottom Top) is a universal analytical bulls convergence/divergence indicator between a financial instrument and any of the twenty two standard indicators included in МT4 package. The indicator is the first out of the two possible versions (LBT and LTB) of the bullish convergence/divergence origins. Due to its multiple use feature, the indicator allows you to find convergences/divergences between the price and various standard indicators
Description Impulse Grand   Global  is an indicator impulse trading system based on  Moving Average  and  MACD Classic  Global . The idea of the impulse system based on Moving Average and MACD Histogram was first offered by Dr. Alexander Elder in his book "Come Into My Trading Room". The system allows users to choose the calculation method ( Moving Average  and  MACD Classic Global ) based on a  single, double or triple moving average  with identification of primary signal of probable reverse of
Description Bulls CD LTB (Bulls Convergence/Divergence Low Top Bottom) is a universal analytical bulls convergence/divergence indicator between a financial instrument and any of the twenty two standard indicators included in МT4 package. The indicator is the second out of the two possible versions (LBT and LTB) of the bullish convergence/divergence origins. Due to its multiple use feature, the indicator allows you to find convergences/divergences between the price and various standard indicators
ATTENTION: the utility cannot work in the Strategy Tester, if you want to try the demo version for free for a week, or have any questions, write me an email! You can find my address on my user profile. TrendLine Auto Executor   is a software capable of identifying the trendlines you have drawn on the chart and opening orders as soon as they are touched or exceeded. The software allows you to manage two orders at a time for each chart by tracking two groups of trendlines, one for each order, and
The utility is designed to close several types of orders. Closing is done by pressing the hot key. How to place and delete orders by voice using the utilities of this type, see the video below the description.  https://www.youtube.com/channel/UCTpVWJkEic6TzoXr0qc9RIw/featured Provided closing options: KEY "1" DELETE BUY STOP. KEY "2" DELETE SELL STOP. KEY "3" DELETE BUY AND SELL STOP. KEY "4" DELETE BUY LIMIT. KEY "5" DELETE SELL LIMIT. KEY "6" DELETE BUY AND SELL LIMIT. KEY "7" DELETE ALL PEND
FREE
Price Levels
Igor Semyonov
Description The indicator is intended for labeling the chart using horizontal levels and/or half-round prices. The indicator works on any financial instrument regardless of the name and the number of digits. A user can choose colors for the indicator lines. Input Parameters Calc_Method - method of calculation of the lines: levels of round prices. levels of half-round prices. Digits_Accepted - flag for calculating the levels according to number of decimal places in the quotes of a financial inst
This is the linear regression indicator for basic indicators included in the standard package of the MetaTrader 4 terminal. It is used for the analysis of price movements and market mood. The market mood is judged by the slope of the linear regression and price being below or above this line. Regression line breakthrough by the indicator line may serve as a market entry signal. There is possibility of setting the color for bullish and bearish sentiments of the basic indicators as well as plottin
Description A colored channel indicator Price Channel to be drawn on the main chart of a financial symbol. It can color bullish and bearish moods based on the middle line of the indicator, as well as change the color of the upper and lower lines of the channel. Purpose The indicator can be used for manual or automated trading in an Expert Advisor. Values of indicator buffer of the double type can be used for automated trading:  The middle line of the indicator - buffer 4. The upper line of the
A script to open and Close  charts of  multiple pairs instantly with custom template $30 for the next 25 downloaders, next price: $45 Features: Chart Opener : Open chart(s) of multiple pairs simultaneously Template Opener : Load any User specified template (.tpl) to the opened chart(s) Chart Closer : Close chart(s) of multiple pairs simultaneously Disclaimer: Any loss involving this trading tool is the sole responsibility of the User, and not the responsibility of the Creator of this trading
Description A colored universal multicurrency/multi-symbol indicator  MACD Histo Smart  (MACD histogram) based on double or triple moving average .  Comparing to the standard MACD Histo this indicator is more sensitive to what allows generating advance signals. he indicator may be used with any broker, irrespective of the name of the financial instrument since it is necessary to manually enter the name as an input parameter. If you enter a non-existent or incorrect name of a financial instrument
GoT Hedge Manager
Andi Chandra Wijaya
GoT Hedge Manager This Tool is suitable for traders who use Hedging Strategy GoT Hedge Manager Hello Traders...!! This tool is to help you to manage your hedge order It will not take any order if you not trigger the order by placing the line order Requirement and Recommendation: ============== =================== Currency Pair Any Timeframe Any Account Type Any Leverage Any Execution Mode Hedging   VPS Mandatory for stable 24/7 operation Functions: Help you to place hedge orders Adjust
MagicExcel
Alessandro Brunelli
MagicExcel will allow you to extrapolate, from your trades, reports split down by Expert Advisor. The generated reports allow you to quickly compare statistics of trades data from different Expert Advisors, different symbols and also the behavior of an Expert Advisor against different symbols. Additionally, if selected, a report will be created that shows the behavior of the Expert Advisor over time. This is a very useful tool for a trader who works with many Expert Advisors at the same time. R
Ultimate pattern builder indicator Allows you to build any pattern with up to 3 candlesticks (+ special fourth). This indicator is special because you can create any pattern you want, by modifying body and both wicks separately to your needs. If you ever wanted to create your own patterns , or just adjust any known popular pattern, then this is perfect for you. With this indicator you can learn how to build candles, testing it in strategy tester and get marked new candles on realtime charts, ho
FREE
The indicator detects and displays Shark harmonic pattern (see the screenshot). The pattern is plotted by the extreme values of the ZigZag indicator (included in the resources, no need to install). After detecting the pattern, the indicator notifies of that by a pop-up window, a mobile notification and an email. The indicator highlights the process of the pattern formation and not just the complete pattern. In the former case, it is displayed in the contour triangles. After the pattern is comple
Trade History Exporter automatically exports trade history to a CSV (comma separated values) file. Trade History Exporter: - automatically exports trade history every time a trade is closed - allows you to manually force an export by using the "W" key on your keyboard - can use Order Comments as Magic Numbers - useful for instance when using a Trade Copier - calculates the Net Profit per trade
Trade Advisor MT4
Agus Santoso
3.5 (2)
交易顾问:掌握图表 专业交易者的终极专家顾问 (EA) 助手 版本 MT4 版本 | MT5 版本 | 博客 v.3.0 - Telegram Bot 集成 注意:MT4 版本比 MT5 版本更轻量 交易顾问:掌握图表 交易顾问是一款先进的交易助手,旨在通过集成关键市场分析工具和交易者的无缝功能来增强交易策略。以下是交易顾问成为交易者强大资产的概述: 主要功能和优势 1. 供需区:交易顾问帮助用户识别关键的供需区,确保在市场中更具战略性的进入和退出点。 2. 智能货币概念:此功能使交易者能够更好地了解市场趋势和结构,清晰地识别看涨、看跌和盘整阶段。 3. 公允价值差距检测:交易顾问定位公允价值差距,帮助交易者发现潜在的市场不平衡,以获得最佳的进入和退出机会。 4. 枢轴点计算:自动计算枢轴点,帮助交易者准确预测潜在的市场逆转和延续。 5. 每周高低点跟踪:监控每周高低水平,更容易识别重要的价格水平并了解近期市场行为。 6. 成交量概况分析:Trade Advisor 包括成交量概况分析,帮助用户了解最高交易量发生的位置,并支持更准确的市场评估。 7. 支撑
The script opens a separate window and displays information about the current open positions in it. The informer will be useful to those who operate with a large number of positions open on different instruments in different directions. It allows you to quickly decompose the loading of the deposit by instruments, visually identify the most tense places in the aggregate position. For the exposed stop orders, it calculates the total risks and goals.
RadarPriceActionSmallTF
Roman Lipatov
5 (2)
This panel is designed for quick visual search for the price action patterns on several instruments simultaneously. It is possible to add and remove instruments. Clicking the signal button allows you to quickly move to the chart with the identified pattern and timeframe. The panel searches for 8 candlestick patterns: PIN-BAR, EXTERNAL BAR, INSIDE BAR, DOJI, LEVEL, HIGH/LOW OF N BAR, FAKEY, ONE-WAY N BAR. Any of the patterns or the periods can be disabled by clicking its title. It can also search
My FX Journal
Nguyen Duy Thanh
This is a script in the entire application that records your trading logs that I created myself to practice trading skills. The whole set includes: script, and web app: https://myfxjournal.cloud It is very simple with only two options: Type (select dropdown) and Ticket (input). If you choose to record open positions, please choose Type = Opening_Trade, otherwise choose Type = Closed_Trading (this is under the Account History tab) ***********This is the part used on the website**************
The indicator looks for market sentiment impulses and notifies traders accordingly. The indicator can notify of a detected impulse via a sound or alert, as well as emails. You can select the color and display type for bullish and bearish moods. Mood arrow appears on the current bar and remains intact after the bar is formed provided that the bar forming conditions have not changed. At least 100 history bars are required for the indicator operation. Inputs Period - period of the indicator calcul
The indicator detects and displays М. Gartley's Butterfly pattern. The pattern is plotted by the extreme values of the ZigZag indicator (included in the resources, no need to install). After detecting the pattern, the indicator notifies of that by the pop-up window, a mobile notification and an email. The pattern and wave parameters are displayed on the screenshots. The default parameters are used for demonstration purposes only in order to increase the amount of detected patterns. Parameters z
Description Bears CD HBT (Bears Convergence/Divergence High Bottom Top) is a universal analytical bears convergence/divergence indicator between a financial instrument and any of the twenty two standard indicators included in МT4 package. The indicator is the first out of the two possible versions (HBT and HTB) of the bearish convergence/divergence origins. Due to its multiple use feature, the indicator allows you to find convergences/divergences between the price and various standard indicators
SwitchRefresh
Ahmet Metin Yilmaz
Switch & Refresh Charts This Script shows all the charts open on your MT4 platform in sequence with a delay of the second you specify, and refreshes the displayed charts if desired. When it comes to the first chart you started, it waits for the minute you specify and starts the same cycle again. The file you downloaded is located in the 'Scripts' section and when you come to the graphic you started to finalize, it should be removed from the chart as seen in the screenshot.
Great Indicator
Ruben David Santana Rodriguez
Les presento un indicador que funciona como estrategia por si solo , trabaja muy bien en periodos de 4 horas pero puedes aplicarlo a cualquier timeframe , las señales son muy faciles de interpretar , en momento en que la linea naranja pasa hacia arriba las media azul y roja , se entra en largos , la operativa se mantiene abierta hasta que la linea naranja cruce la media mas cercana ya sea la azul o la roja , si la operacion era long y la linea azul cruza hacia arriba la linea roja y la naranja c
MACD Divergence Finder
Segundo Calvo Munoz
MACD Divergence Finder Indicator will help you to find Divergences between your typical MACD values and the Chart Prices as potential points of actual Trend Reversion or Pull Backs to increase your positions as per the current Trend. Indicator Windows draws MACD value and Divergence arrows but not MACD Signal as it is not considered relevant to detect this kind of Classic Divergences. In some computer/VPS with old microprocessors or low RAM size, when you launch this Indicator (attach it, change
This indicator is suitable for trading on the pair  and many more. There is also an interactive panel for quickly changing settings. The indicator itself uses universal calculations of additional accuracy, but so far they are optimized for some currency pairs. Many settings can be configured on the main menu. He displays his calculations on the graph in the form of icons. There are two types of icons. In the tester, it works fine by default in the settings. You can specify a color for its icons
Superior Telegram Signals Multi-Platform Trade Copier & Notification System   Available for MetaTrader 4 and MetaTrader 5 Superior Telegram Signals   is a utility that connects a trading terminal to the Telegram application. It is designed to send automated trade notifications, chart screenshots, and account status updates to a specified Telegram chat, channel, or group. Use Cases This tool can be used by: Signal Providers:   To automate the broadcasting of trade signals, modifications, and clos
Automatically closes orders when profit per lot or total profit reaches your specified level Per a lot : The amount of wins per lot in the selected symbol. Each orders is calculated as 1 lot. Example: If EURUSD total lot is 2.05 and earnings per lot is $ 100, then 100 * 2.05 = 205 $. Orders will be closed when EURUSD has a total profit of $ 205. When the total of all orders on the selected symbol reaches the specified amount, it closes all orders belonging to the symbol. For example: There are 3
Waddah Attar Easy Positions Risk Management This EA gives you a full ability to close one position or close all positions . Close buy or sell trades in any position . Close profit or loss position . by clicking on a command button on the chart with confirmation message . Show you  a full information about your positions like : count - lots - average price - points - profit -  profit % - used margin for this position and the risk percent . and also the scrolled table of trades that position has
Description Strongest Higher Level  is an indicator that automatically plots the nearest level of strongest resistance and support in the main chart based on prices of the higher timeframe that differs it from Strongest Level indicator. Repeated usage of the indicator with various number of bars creates a system of support and resistance! The indicator calculates and plots levels based on number of bars set by the user.  It is recommended to set numbers from a golden ratio according to Fibonacci
该产品的买家也购买
欢迎来到 Trade Manager EA——这是一个终极风险管理工具,旨在使交易变得更直观、精准和高效。它不仅仅是一个下单工具,而是一个用于无缝交易计划、仓位管理和风险控制的全面解决方案。不论您是新手交易员、资深交易员,还是需要快速执行的剥头皮交易员,Trade Manager EA 都可以满足您的需求,适用于外汇、指数、大宗商品、加密货币等各种市场。 借助 Trade Manager EA,复杂的计算已成过去。只需分析市场,在图表上用水平线标记入场、止损和止盈,设置您的风险水平,Trade Manager 就会立即计算出理想的头寸规模,并实时显示以点、账户货币计价的止损和止盈。每笔交易都得以轻松管理。 主要功能: 头寸规模计算器 :根据定义的风险瞬间确定交易规模。 简单的交易计划 :在图表上用可拖动的水平线直接计划交易,设置入场、止损和止盈。 实时显示 SL 和 TP :以账户货币、点或分显示止损和止盈,便于分析。 高级保护工具 盈亏平衡选项 : 基本盈亏平衡 :当您的交易达到设定水平时自动保护利润。 多级盈亏平衡 :设置多达 4 个级别以逐步保护利润。 尾随止损选项 : 基本尾随
Local Trade Copier EA MT4
Juvenille Emperor Limited
4.96 (110)
通过 Local Trade Copier EA MT4 获得非常快速的交易复制体验。它的简单1分钟设置,使您可以在同一台Windows计算机或Windows VPS上在多个MetaTrader终端之间复制交易,具有闪电般快速的复制速度,低于0.5秒。 无论您是初学者还是专业交易者, Local Trade Copier EA MT4 都提供了广泛的选项,可根据您的特定需求进行自定义。对于任何希望增加利润潜力的人来说,这都是终极解决方案。 今天就尝试一下,看看为什么它是市场上最快、最简单的贸易复印机! 提示: 您可以在您的模拟账户中下载并试用 Local Trade Copier EA MT4 模拟版: 这里 将下载的免费演示文件粘贴到您的 MT4 >> 文件 >> 打开数据文件夹 >> MQL4 >> 专家文件夹并重新启动您的终端。  免费演示版本每次可在 4 小时内发挥全部功能,仅限演示帐户。 要重置试用期,请转至 MT4 >> 工具 >> 全局变量 >> Control + A >> 删除。 请仅在非关键模拟账户上执行此操作,不要在挑战道具公司账户中执行此操作。 如果您无法在
Exp COPYLOT CLIENT for MT4
Vladislav Andruschenko
4.69 (65)
MetaTrader 4 专业交易复制器 快速、专业、可靠的 MetaTrader 4 交易复制器。 COPYLOT 可在 MetaTrader 4 与 MetaTrader 5 终端之间复制外汇交易,并为不同账户类型和交易场景提供灵活的同步方案。 COPYLOT MT4 版本支持: MetaTrader 4 → MetaTrader 4 MetaTrader 5 Hedge → MetaTrader 4 MetaTrader 5 Netting → MetaTrader 4   MT5 版本 完整说明 + DEMO + PDF 如何购买 如何安装 如何获取日志文件 如何测试与优化 Expforex 的全部产品 您也可以使用 MetaTrader 5 版本,在 MetaTrader 5 → MetaTrader 5 和 MetaTrader 4 → MetaTrader 5 之间进行复制: COPYLOT CLIENT for MT5 COPYLOT 是一款专业级交易复制器,可稳定运行于 2、3 甚至 10 个终端之间。 支持从模拟账户和投资者密码账户进行复制 可同时运行在多个终端上
Strategy Builder offers an incredible amount of functionality. It combines a trade panel with configurable automation (covert indicators into an EA), real-time statistics (profit & draw down) plus automatic optimization of SL, TP/exit, trading hours, indicator inputs. Multiple indicators can be combined into an single alert/trade signal and can include custom indicators, even if just have ex4 file or purchased from Market. The system is easily configured via a CONFIG button and associated pop-up
Trade Assistant MT4
Evgeniy Kravchenko
4.43 (197)
它有助于计算每笔交易的风险,容易安装新的订单,具有部分关闭功能的订单管理, 7 种类型的追踪止损和其他有用的功能。 附加材料和说明 安装说明 - 应用程序说明 - 模拟账户应用程序的试用版 线条功能  - 在图表上显示开仓线、止损线、止盈线。 有了这个功能,就可以很容易地设置一个新的订单,并在开仓前看到它的附加特性。   风险管理  - 风险计算功能在考虑到设定的风险和止损单的大小的情况下,计算新订单的成交量。它允许你设置任何大小的止损,同时观察设定的风险。 批量计算按钮 - 启用 / 禁用风险计算。 在 " 风险 " 一栏中设置必要的风险值,从 0 到 100 的百分比或存款的货币。 在 " 设置 " 选项卡上选择风险计算的变量: $ 货币, % 余额, % 资产, % 自由保证金, % 自定义, %AB 前一天, %AB 前一周, %AB 前一个月。   R/TP 和 R/SL - 设置止盈和止损的关系。 这允许你设置相对于损失的利润大小。 例如, 1 : 1 - 这决定了 TP = SL 的大小。 2 : 1 - 这意味着 TP 是 SL 的两倍。 RR - 它禁用比率。  
PZ Trade Pad Pro MT4
PZ TRADING SLU
3.67 (3)
这是一个可视化的交易面板,可帮助您轻松进行交易管理,避免人为错误并增强交易活动。它结合了易于使用的视觉界面以及完善的风险和位置管理方法。 [ 安装指南 | 更新指南 | 故障排除 | 常见问题 | 所有产品 ] 易于使用 从图表轻松交易 精确的风险管理交易,无忧 保本是重中之重 让利润不受您的关注 尽快享受无风险交易 所有已开通交易的自动追踪止损 交易开始后立即设置初始止损 进行交易后,EA将执行以下任务: 初始止损/获利被自动放置 它会尽快锁定自由行(可选) 它将止损首次移动到盈亏平衡点(可选) 它使用您所需的方法跟踪止损,直到止损为止 其他很酷的功能是: 出色的终端活动报告 单一但功能强大的尾随止损方法 干净的图表界面 没有输入参数 我进行交易后会怎样? 这是您进行交易后EA的操作: 它放置初始止损并获利订单。 尽快搭便车并确保保本。默认情况下,这是通过在达到盈亏平衡点时关闭50%的交易来完成的,默认情况下为5点。这意味着,如果您日后被淘汰,您将一无所获(可选)。 盈亏平衡后,跟踪止损开始运行。 它跟踪止损,直到止损为止,让利润运行。 尾随止损如何运作? 追踪止损表示为所管
一款面向手动交易的专业面板,把完整的交易流程都收进图表上的一个窗口,从精准入场到账户防护。按设定的风险精确计算手数,借助 RR Tool 直接在图表上用线条搭建交易,开立市价单和挂单、网格与 OCO。持仓的后续管理交给面板打理:最多五级分批平仓、六种跟踪止损、保本以及 Virtual SL/TP。日、周、月三档限额守护本金,一旦被突破即自动触发。 使用指南与免费 Live 演示 免费的 Live 演示版可在此获取 ( Free Live Demo )。 产品的使用指南见此 ( User Manual )。 NT Trade Manager 把交易者的整套工作流程收进图表上一块紧凑的面板,无需在终端各窗口之间反复切换,也不必在每次入场前埋头计算。它为坚持手动、独立判断的交易者而打造:主观交易者、剥头皮和波段交易者,外汇、金属、指数、大宗商品乃至加密货币等任何品种都适用。决策由你拍板,执行的琐碎操作、风控纪律和持仓跟踪则交给面板。没有你的指令,什么都不会发生:这是一件实战工具,而不是全自动交易程序,也不是信号服务。 功能概览 每笔交易的手数都严格按设定的风险算出:可取账户余额的百分比
Trading History MT4
Siarhei Vashchylka
5 (9)
Trading History - A program for trading and money management on the history of quotes in stratagy tester. It can work with pending and immediate orders, and is equipped with trailing stop, breakeven and take profit functions. Very good for training and testing different strategies. Manual (Be sure to read before purchasing) Advantages 1. Allows you to test any trading strategy in the shortest possible time 2. An excellent simulator for trading training. You can gain months of trading experience
MACD Divergence Scanner is a multi-timeframe and multi-symbol dashboard and alert that checks all timeframes and symbols to find regular and hidden divergences between price chart and MACD indicator. This divergence scanner is integrated with support and resistance zones so you can check the MACD divergences in the most important areas of the chart to find trend reversals in the price chart. Download demo version   (works on M 1,M5,M30,W1   timeframes) Full description of scanner parameters ->  
King Trade Copier MT4
Mohammed Maher Al-sayed Mohammed Ahmed Saleh
King Trade Copier MT4 – Lightning-Fast Local Trade Copier (Master + Slave in ONE file) King Trade Copier is a professional local trade copier that mirrors every trading action from one Master account to unlimited Slave accounts on the same PC or VPS — with an internal copy latency of just a few milliseconds. It was built by a real trader for daily real-money use, with one goal: whatever happens on the Master must happen on the Slave, instantly and without exceptions. Watch the demo video to s
SmartFastTrade AI
Muhammad Faisal Sagala
Transform Your Trading with SmartFastTrade AI: Speed and Ease at Your Fingertips! Introduction Are you a trader struggling with slow order execution? Do you want a tool that can assist you in making quick and accurate trading decisions? If yes, then SmartFastTrade AI is the answer to all your trading needs. With its unique combination of speed, user-friendliness, and advanced features, SmartFastTrade AI will help you unlock your full trading potential. Let's delve deeper into why this innovativ
TradePanel MT4
Alfiya Fazylova
4.84 (95)
交易面板是一款多功能交易助手。该应用包含超过50种手动交易功能,并允许您自动执行大多数交易任务。 在购买之前,您可以在演示账户上测试演示版本。下载用于演示账户的试用版应用程序: https://www.mql5.com/zh/blogs/post/762579 。 完整说明 这里 。 贸易. 只需单击一下即可执行交易操作: 打開掛單和頭寸,並自動計算風險。 一鍵打開多個訂單和頭寸。 打開訂單網格。 按組別關閉掛單和頭寸。 反轉頭寸方向(關閉買入>打開賣出,關閉賣出>打開買入)。 鎖定頭寸(通過開啟缺少的頭寸,使買入和賣出頭寸的數量相等)。 一鍵部分關閉所有頭寸。 將所有頭寸的止盈和止損設置在同一價格水平。 將所有頭寸的止損設置在盈虧平衡水平。 開倉時,可使用以下功能: 在多個訂單或倉位之間分配計算出的數量(在單擊一次時開啟多個訂單和倉位)。 在開啟訂單前在圖表上可視化交易水平。 僅在當前點差不超過設定值時才開啟倉位。 止盈和止損之間的自動比例。 虛擬止損和止盈。 自動將止損和止盈的大小增加為當前點差的大小。 基於ATR指標讀數計算止盈和止損。 設置掛單的到期日期。 為掛單設置追蹤(掛單
试用版下载 Copy Cat More (跟单猫) MT4 交易跟单器 (Trade Copier) 不仅仅是一个简单的本地交易跟单器;它是一套 完整的风险管理与执行框架 (risk management and execution framework), 专为当今的交易挑战而设计。从自营公司 (prop firm) 挑战到个人投资组合管理,它凭借 稳健的执行、资金保护、灵活的配置和先进的交易处理的结合,适应各种情况。 该跟单器同时支持   主控端 (Master,发送方) 与 受控端 (Slave,接收方)   两种模式,可实时同步市价单与挂单、交易修改、部分平仓以及对锁平仓 (Close By) 操作。它兼容模拟与真实账户、交易或投资者登录,并通过持久化交易记忆 (Persistent Trade Memory) 系统确保恢复——即使 EA、终端或 VPS 重启也不例外。可借助唯一 ID 同时管理多个主控端与受控端,跨经纪商差异则通过前缀/后缀调整或自定义品种映射自动处理。 试用版:  先试用看看 :   你可以从下方链接下载并体验   Copy Cat More (跟单猫
Telegram to MT4 Multi-Channel Copier 可自动将您 Telegram 频道中的交易信号直接复制到 MetaTrader 4。无需机器人,无需浏览器扩展,无需手动复制。您在 Telegram 上收到信号,EA 会在几秒钟内在您的终端上开仓。 本产品包含两个组件:一个监听您 Telegram 频道的 Windows 应用程序,以及在您的 MT4 终端上执行信号的 EA。同时也提供 MT5 版本。 设置指南和应用程序下载: https://www.mql5.com/en/blogs/post/768988 工作原理 Windows 应用程序使用您自己的 API 凭据连接到 Telegram,而不是机器人。这意味着它可以读取您订阅的任何频道、群组或话题,包括私人和 VIP 频道。检测到信号后,它会进行解析并发送给 EA。EA 根据您的经纪商解析交易品种名称,基于您的风险设置计算手数,然后开仓。 整个过程都是自动的。您无需守在电脑前。 打开应用程序并登录 Telegram(仅第一次)。 选择要监听的频道或话题。 按下 Start。EA 会处理其余的一切。 支持的
The product will copy all telegram signal to MT4   ( which you are member  ) , also it can work as remote copier.  Easy to set up, copy order instant, can work with almost signal formats, image signal, s upport to translate other language to English Work with all type of channel or group, even channel have "Restrict Saving Content", work with  multi channel, multi MT5 Work as remote copier: with signal have ticket number, it will copy exactly via ticket number. Support to backtest signal. How to
MT4 至 Telegram 信号提供者 是一款易用、可完全自定义的工具,它使发送信号到 Telegram 成为可能,将您的账户变成信号提供者。 消息的格式 可以完全自定义! 但是,为了简便使用,您也可以选择一个预设模板,并能够启用或禁用消息的特定部分。 [ 演示 ]  [ 手册 ] [ MT5 版本 ] [ Discord 版本 ] [ Telegram 频道 ]  New: [ Telegram To MT5 ] 设置 可通过 用户指南 获取逐步说明。 无需了解 Telegram API;开发者提供所需的一切。 主要特性 自定义发送给订阅者的订单详情的能力 您可以创建分层订阅模型,例如铜牌、银牌、金牌。金牌订阅可获得所有信号等。 按订单号、符号或备注过滤订单 包括执行订单的图表的屏幕截图 在发送的屏幕截图上绘制已关闭的订单,以便额外验证 推迟发送新订单消息的可能性,以便在发送前对位置进行调整 订单详情的全透明度: 新的市场订单 *附带屏幕截图 订单修改(止损、获利点) 已关闭订单 *附带屏幕截图 部分关闭订单 ** 新的挂起订单 修改的挂起订单(进场价格) 挂起订单激活(
Exp Averager
Vladislav Andruschenko
4.82 (22)
MetaTrader 4 用 Averager —— 专业的持仓均价管理与交易篮子恢复系统 这是一款为回撤中的持仓而打造的专业 Expert Advisor,核心任务不是寻找入场点,而是通过均价管理、追加开仓和整组仓位控制,帮助交易者更从容地处理亏损仓位与价格回撤。 Averager 并不是一个独立的自动交易系统,它不会像完整策略那样自动寻找市场信号并主动交易。它的价值在于:当你已经有持仓之后,它可以按照你的设定,对整组交易进行更聪明、更系统化的管理。 如果你希望在 MetaTrader 4 中获得一套更成熟的交易恢复逻辑,让仓位管理不再只是简单补单,而是围绕平均价格、统一止盈和整组追踪进行完整控制,那么这款产品正是为此而设计。 MT5版本 | 详细描述 + DEMO + PDF | 如何购买 | 如何安装 | 如何获取日志文件 | 如何测试和优化 | Expforex 的所有产品 为什么选择 Averager 针对回撤仓位进行均价管理 支持 顺势追加开仓 与 逆势均价开仓 整组仓位统一追踪止损 自动重算平均价格与整组共同退出点 支持灵活控制距离、手数增长和最大仓位数量 非常适合配合
神速EA跟单(TradeMirror)是一款MT4/MT5平台的订单复制软件。 使用教程 请点击 神速EA跟单使用教程 链接以查看更多使用教程 为什么选择神速EA跟单 我们深知对于金融软件而言安全、稳定和隐私的重要性,因此我们在细节处对这三大要素进行了额外的加固: 提供用户友好的图形界面,操作简单易用 注重隐私安全,适合对订单分发有隐私要求各种金融场景 精准复制订单,毫秒级分发 支持全平台,MT4/MT5全面覆盖 智能感知系统状态,邮件通知守护交易安全 核心功能列表 对于跟单软件而言,功能并不是越多越好的,因此经过严谨的需求分析,我们对程序进行了精简,并最终保留了如下核心功能: 多重连接 邮件通知 手数缩放 信号过滤 反向跟单 重置止盈/止损 免费演示 在购买Trademirror之前,你总是可以尝试免费演示。 点击本页面上的免费演示按钮 点击是的,我有Metatrader 4/5 允许浏览器打开Mt4/5 在Mt4/5中,找到专家顾问/市场/TradeMirror,打开它并点击测试 启用复盘显示(否则你将看不到GUI界面)。 点击开始 现在你可以在可视化图表上看到TradeMirro
FORBEX Market Watch Trading Hours PRO NEWS Professional Market Session, Trading Schedule & Economic News Dashboard for MetaTrader 4 FORBEX Market Watch Trading Hours PRO NEWS is an advanced all-in-one MT4 dashboard designed to provide traders with real-time market session monitoring, broker trading schedules, live countdowns, intelligent voice alerts, and economic news awareness from one clean professional interface. The EA automatically scans your Market Watch symbols and displays current tradi
CloseIfProfitorLoss with Trailing
Vladislav Andruschenko
4.87 (31)
Close If Profit or Loss with Trailing for MetaTrader 4 — 按总盈利或总亏损自动平仓 这是一款适用于 MetaTrader 4 的实用型交易管理工具。当总盈利或总亏损达到您设置的水平时,EA 可以自动关闭选定的持仓。 Expert Advisor 会监控当前交易,计算浮动盈亏,并可使用利润跟踪功能,帮助交易者比手动操作更快地管理风险和锁定结果。 MetaTrader 4 仍然被大量手动交易者、剥头皮交易者、网格交易者和 EA 用户使用。但 MT4 本身没有一个方便的内置工具,可以按一组订单的总结果来自动平仓。这个工具正是为了解决这个问题。 Close If Profit or Loss with Trailing 可用于手动交易,也可以与其他 Expert Advisors、网格系统、加仓策略、恢复策略和多品种交易一起使用。您设置规则,EA 负责监控结果,并在条件达到时执行平仓。 MT5 版本 | 完整说明 + DEMO + PDF | 如何购买 | 如何安装 | 如何获取日志文件 | Expforex 的所有产品 为什么 MT4
RS Trade Copier - 超快 本地跟单系统,配备 真正的 图形界面。别再手动输入账号了。告别200多个晦涩的参数设置。 一款可靠且灵活的工具,用于在 MT4 和 MT5 多个终端之间复制交易操作。适合专业交易员、信号服务商以及个人投资者使用。能够以高精度和低延迟将一个或多个信号源(Provider)的 交易操作同步 到一个或多个接收端(Client)。支持简单自动配置和高级手动设置。不会干扰手动或其他 EA 开的订单。完全 在 MT4 本地运行 ,无需第三方服务器。 RS Trade Copier 与其他解决方案的对比 RS Trade Copier 其他解决方案 设置 可视化分步向导。 设置大约需要 1 分钟。 200 多个晦涩的输入参数。 设置大约需要 20 分钟。 速度 异步交易操作。* 批量平仓 50 个头寸仅需 ~1 秒。 缓慢的顺序执行。 批量平仓 50 个头寸需要约 25 秒。 界面 真正的图形界面,支持 11 种语言的工具提示。 无需手册即可上手。 EA 属性中“输入参数”选项卡下的长长参数列表。 需要阅读所有文档。 批量操作 完全支持。 接收端上的批量平仓
您在寻找 MT5 版本吗? 如果您使用的是 MetaTrader 5,请点击此处获取原生版本: https://www.mql5.com/zh/market/product/155546 Multi-Currency Strength Dashboard PRO — 专业货币强弱指标 (MT4) Multi-Currency Strength Dashboard PRO 是一款专为 MetaTrader 4 设计的高级指标,用于实时测量外汇市场主要货币的相对强弱。它分析多达 28 个主要货币对,计算 8 种主要货币的标准化强度,并通过一个完整的仪表盘显示,帮助您快速识别最值得关注或应避免的货币对。 指标目标 提供货币强弱的清晰、直观视图。 通过突出显示“强 vs 弱”的组合,帮助识别强劲趋势。 作为过滤器,优化交易货币对的选择。 综合外汇市场分析,无需打开多个图表。 主要功能 多货币分析 :同时计算 8 种主要货币(USD, EUR, GBP, JPY, CHF, CAD, AUD, NZD)的强度。 分析多达 28 个货币对 :自动检测经纪商提供的可用货币对。 完整的可
Trade copier MT4
Alfiya Fazylova
4.56 (32)
Trade Copier 是一种专业实用程序,旨在复制和同步交易账户之间的交易。 复制发生从供应商的帐户/终端到收件人的帐户/终端,安装在同一台计算机或 vps 上。 促销活动 - 如果您已经购买了“Trade copier MT5”,您可以免费获取“Trade copier MT4”(用于 MT4 > MT5 和 MT4 < MT5 的复制)。欲了解更多详细条款,请通过私人消息与我们联系! 在购买之前,您可以在演示帐户上测试演示版本。 演示 这里 。 完整说明 这里 。 主要功能和优点: 支持复制MT4>MT4、MT4>MT5、MT5>MT4,包括МТ5 netting账户。 供应商和收件人模式在同一产品中实现。 简单直观的界面,允许您直接从图表中实时控制复制。 连接中断或终端重新启动时不会丢失设置和位置。 允许您选择要复制的符号,也可以替换接收者的符号,例如 EURUSD> USDJPY。 支持回拷贝。 能够仅复制某些订单。 允许您设置开仓交易价格的最大差异和最大时间延迟。 正确复制部分订单关闭的执行。 计算复制手数的几种方法。 同步止盈和止损。有几种方法可以计算它们的位置。 支持
Trade Copier Global
Laszlo Tormasi
5 (15)
Trade Copier Global: The name speaks for itself. This copier allows you to copy orders between MT4 terminals even if they are not installed on the same computer. Features Copying trades between MT4 terminals around the world with a short delay. Automatically recognizes symbol prefixes. Can connect many Slaves to the same Master. Supports pending and market orders. Supports partial order close (with limitations, see below) Can send messages and notifications to the Slaves from the Master Several
跟单->方便快捷的界面交互,用户上手即用       ->>>> 推荐在windows电脑,或者VPS Windows上使用 特色功能: 多样化个性跟单设置: 1.对不同的信号源可以设置不同的手数模式 2.不同的信号源分别设置正向反向跟单 3.信号分别设置注释 4.是否根据合约手数校准手数 多样化个性跟单设置2: 1.对不同的品种可以设置不同的手数模式 2.不同的品种分别设置正向反向跟单 3.信号分别设置注释 4.是否根据合约手数校准手数 注释过滤,MAGIC过滤,信号手数过滤,本地品种过滤 净持仓模式(该模式下手数计算仅支持倍率) 工作时间设置 反向同步接收端的平仓 订单绑定功能:任意订单可以绑定到设置信号源订单上 (双击表格更改) 账户风险控制  基本功能: 跟单正常交互速度0.5s以下 自动检测信号源,并显示信号源账号列表 自动匹配品种,不同平台常用交易品种(后缀不同等特殊情况)95%自动匹配,基本无需手动设置,品种映射表可随意双击更改对应品种.(映射表具有快速搜索品种功能) 4种手数计算模式(1.倍率 2.固定手数 3.自适应资金风险 4.源账户资金比例风险) 特殊手数模式
News Filter EA: Advanced Algo Trading Assistant News Filter EA is an advanced algo trading assistant designed to enhance your trading experience. By using the   News Filter EA , you can integrate a Forex economic news filter into your existing expert advisor, even if you do not have access to its source code. In addition to the news filter, you can also specify   trading days   and   hours   for your expert. The News Filter EA also includes   risk management   and   equity protection   features
立即在一張圖表上查看按日和按週的已平倉交易歷史記錄、當前未平倉交易以及外匯風險敞口!使用熱圖來識別有利可圖的交易以及您交易組合中的當前虧損情況。 快速關閉按鈕 使用快速關閉按鈕可以關閉單一符號的每筆交易、全部關閉單筆交易,或點擊按鈕以取得部分利潤或損失。不再需要在清單中尋找交易並研究如何關閉部分交易。儀表板還會顯示您在交易外匯對時目前對每種貨幣符號的風險敞口,這可以幫助您識別重大新聞事件發生前可能過度暴露的領域。您可以使用按鈕在新聞發布前立即快速降低您的風險,或者如果新聞已經發生並為您帶來利潤,只需單擊即可快速獲得該利潤! 開放交易熱圖 交易熱圖是一種視覺化工具,專為使用頭寸交易或波段交易策略的交易者設計,使用美元成本平均法來擴大和縮小交易規模。您可以快速識別您的投資組合中可以存入的單一交易,以及您可以部分平倉的虧損交易。只需使用全部或部分關閉按鈕即可立即賺錢並降低風險。 快速識別控制回撤的機會 虧損控制切換「D 按鈕」將突出顯示您的投資組合中所有虧損高於每個交易符號平均價格的交易。這是透過在所有符號的單一交易周圍添加一個矩形來實現的,這樣您就可以看到首先要關注哪些交易。 這使
Простая в управлении Торговая панель обеспечит безопасную торговлю. Вычислит объём сделки от заданного уровня Stop Loss и величины убытка. Поможет рассчитать сейф, и в ноль закрыть неверную сделку. Интуитивно понятный интерфейс делает панель удобной в управлении, освобождая внимание трейдера для принятия решения о входе в сделку. Программа сделает все расчёты за вас. Поэтому работа с помощью панели Снайпер - оптимальное решение для торговли с соблюдением Мани-менеджмента. А это главный ключ к по
Grid Manual MT4
Alfiya Fazylova
4.71 (17)
Grid Manual是一个交易面板,用于处理订单网格。 该实用程序是通用的,具有灵活的设置和直观的界面。 它不仅可以在亏损方向上设置订单网格,还可以在盈利方向上设置订单网格。 交易者不需要创建和维护订单网格,实用程序会这样做。 打开一个订单就足够了,Grid manual会自动为它创建一个订单网格,并伴随它直到非常关闭。 完整说明和演示版 此處 。 该实用程序的主要特性和功能: 伴隨以任何方式打開的訂單,包括從移動終端打開的訂單。 適用於兩種類型的網格:“限制”和“停止”。 使用兩種方法計算網格間距:固定和動態(基於 ATR 指標)。 允許您更改未結訂單網格的設置。 顯示圖表上每個網格的盈虧平衡水平。 顯示每個網格的利潤率。 允許您一鍵關閉網格中的盈利訂單。 讓您一鍵關閉每個訂單網格。 允許您對訂單網格應用追踪止損功能。 允許您在訂單網格上應用將訂單網格的止損轉移到盈虧平衡水平的功能。 相對於訂單網格的盈虧平衡水平自動重新排列止盈(僅在限價網格模式下,距離取決於所選的計算類型:“保守”或“激進”)。 最多可管理 20 個訂單網格,每個網格最多可包含 100 個訂單。
Trader Evolution MT4
Siarhei Vashchylka
5 (2)
" Trader Evolution " - A utility designed for traders who use wave and technical analysis in their work. One tab of the utility is capable of money management and opening orders, and the other can help in making Elliott wave and technical analysis. Manual (Be sure to read before purchasing) | Version for MT5 Advantages 1. Trading in a few clicks. Immediate and pending orders are available in the panel 2. Money management. The program automatically selects the appropriate lot size 3. Simplifies
作者的更多信息
Reversal Bars
Igor Semyonov
Description The indicator determines the appearance of the bars that signal of a reversal of current local moods and plays a beep. It also paints these bars in accordance with the bullish and/or bearish priority. You can select the color for bullish and bearish moods. Inputs Sound_Play - a flag that allows the sound notification. Use Detection of the reversal bar can be a signal to perform appropriate trading activities.  The indicator can be used for manual or automated trading in an Expert A
Main Candles
Igor Semyonov
The indicator detects the following types of Japanese candlesticks: Doji, Hammer and/or Hanging Man, Shooting Star and/or Inverted Hammer, Spinning Top, Maribozu. The indicator is intended for manual and/or automated trading within an Expert Advisor. There is a possibility to choose colors for bullish and bearish candlesticks. For automated trading, use any indicator buffer of the double type: 0, 1, 2 or 3, whose value is not zero!
The indicator is intended for detecting big (long) and/or small (short) candlesticks. There is possibility of coloring the bullish and bearish candlesticks. The indicator can be used for manual and/or automated trading within an Expert Advisor. The indicator data that can be used for automated trading can be taken from one of four buffers of the double type: 0, 1, 2 or 3. Values must not be equal to zero. 
The indicator of DeMark fractals. The indicator can be drawn on the basis of price data and on the basis of a moving average. There is a possibility to color the up and down fractals. The indicator can be used for manual and for automated trading within an Expert Advisor. For automated trading, use any indicator buffer of the double type: 0 - up fractals, 1 - down fractals! Values of the buffers must not be equal to zero.  A moving average is drawn on the basis of input parameters: Calc_Method 
Stochastic Global
Igor Semyonov
4 (1)
Description A universal colored indicator Stochastic. The rising and falling lines and the levels of the indicator can be colored.   The indicator can be calculated as the standard one on the basis of a price or as a derivative on the basis of the following nineteen other indicators included in the standard package of the MetaTrader 4 terminal: AD - an indicator of accumulation and distribution of volume. OBV - On Balance Volume. Volume - tick volume indicator. AC - indicator of acceleration. AO
Description A universal colored indicator MACD Histo. The rising and falling of the indicator histogram can be colored.   The indicator can be calculated as the standard one on the basis of a price or as a derivative on the basis of the following twelve other indicators included in the standard package of the MetaTrader 4 terminal: AD - an indicator of accumulation and distribution of volume. OBV - On Balance Volume. Volume - tick volume indicator. Force - Force Index indicator. MFI - Money Flow
Description A colored universal indicator MACD Line (MA convergence-divergence indicator, shown as a histogram). The rising and falling of the indicator histogram can be colored. The indicator can be calculated as the standard one on the basis of a price or as a derivative on the basis of the following twelve other indicators included in the standard package of the MetaTrader 4 terminal: AD - an indicator of accumulation and distribution of volume. OBV - On Balance Volume. Volume - tick volume i
RSI Global
Igor Semyonov
Description A universal indicator RSI together with moving averages based on it. Depending on the need, moving averages can be disabled. You can color the indicator lines and levels: lines of RSI, moving average lines and thresholds of overbought and oversold levels.   The indicator can be calculated as the standard one on the basis of a price or as a derivative on the basis of the following eighteen other indicators included in the standard package of the MT4 terminal: AD - an indicator of accu
CCI Global
Igor Semyonov
5 (1)
Description A universal indicator CCI together with moving averages based on it. Depending on the need, moving averages can be disabled. You can color the indicator lines and levels: lines of CCI, moving average lines and thresholds of overbought and oversold levels.   The indicator can be calculated as the standard one on the basis of a price or as a derivative on the basis of the following eighteen other indicators included in the standard package of the MetaTrader 4 terminal: AD - an indicato
Description A multi-purpose multi-colored/multi-symbol indicator, which is a set of standard tools from the MetaTrader 4 terminal. The difference is that below the basic price chart it allows to calculate and build in a separate window any of the twenty indicators in a colored form, painting bulls and bears in different colors, for any financial instrument in accordance with the list below:  AD - an indicator of accumulation and distribution of volume. OBV - On Balance Volume. Force - Force Inde
AO Global
Igor Semyonov
Description A colored universal indicator AO (Awesome Oscillator). The rising and falling of the indicator histogram can be colored.   The indicator can be calculated as the standard one or as a derivative on the basis of the following eleven other indicators included in the standard package of the MetaTrader 4 terminal: AD - an indicator of accumulation and distribution of volume. OBV - On Balance Volume. Volume - tick volume indicator. Force - Force Index indicator. MFI - Money Flow Index. ATR
Description A colored universal indicator MACD Classic (MA convergence-divergence indicator) that combines two indicators: MACD Line and MACD Histo. The rising and falling lines, the signal line and the indicator histogram can be colored. The indicator can be calculated as the standard one on the basis of a price or as a derivative on the basis of the following twelve other indicators included in the standard package of the MetaTrader 4 terminal: AD - an indicator of accumulation and distributio
Description The universal colored multicurrency/multisymbol indicator MACD Classic, consisting of two MACD indicators: MACD Line and MACD Histo. The indicator may be used with any broker, irrespective of the name of the financial instrument since it is necessary to manually enter the name as an input parameter. If you enter a non-existent or incorrect name of a financial instrument, you will receive an error message that this financial instrument is unknown (does not exist). Inputs Currency_Nam
Description A colored universal indicator/oscillator based on crossing moving averages. The rising and falling lines of the indicator histogram can be colored. The combined use of the line and the histogram increases the level of the analysis when making a decision to open or close deals. The indicator can be calculated as the standard Price Oscillator or as a derivative on the basis of the following eleven other indicators included in the standard package of the MetaTrader 4 terminal: AD - an i
Description A universal colored multicurrency/multi-symbol indicator RAVI. Was proposed by T. Chand as a trend indicator. RAVI means Range Action Verification Index. The indicator may be used with any broker, irrespective of the name of the financial instrument since it is necessary to manually enter the name as an input parameter. If you enter a non-existent or incorrect name of a financial instrument, you will receive an error message that this financial instrument is unknown (does not exist).
Description A colored multicurrency/multisymbol oscillator of the market mood. The oscillator is designed for detecting the continuation or change of the market mood prior to its occurrence. An excellent example is the screenshots that show all the features of the oscillator. The oscillator may be used with any broker, irrespective of the name of the financial instrument since it is necessary to manually enter the name as an input parameter. If you enter a non-existent or incorrect name of a fin
Inside Bar
Igor Semyonov
Description The indicator determines the appearance of internal bars on the chart, and paints them in accordance with the bullish and/or bearish mood. The indicator can notify of the appearance of a formed internal bar by playing a beep, as well as display the time remaining until the end of the formation of the current bar in the format of <d:h:m:s, where: < means the current bar. d - days. h - hours. m - minutes. s - seconds. The bullish and bearish mood can be colored. Inputs Sound_Play - a
Description The indicator determines the appearance of bars that notify of the reversal of the current trend, and paints them in accordance with the bullish and/or bearish mood. The indicator can notify of the appearance of a formed reversal bar by playing a beep, as well as display the time remaining until the end of the formation of the current bar in the format of <d:h:m:s, where: < means the current bar. d - days. h - hours. m - minutes. s - seconds. You can select the color for bullish and
Description A universal colored multicurrency/multi-symbol indicator of moving averages: Moving Average, Double Moving Average, Triple Moving Average . The indicator is drawn in a separate window, so below the main trading chart a user can see the development of another financial instrument. It is very useful when considering the combined values of various moving averages for different financial instruments below the main trading chart.  The indicator may be used with any broker, irrespective of
Description A universal colored indicator of moving averages: Moving Average, Double Moving Average, Triple Moving Average . The indicator provides various opportunities for the analysis of prices based on different ways of constructing moving averages in the window of the main financial instrument. You can color bullish and bearish moods. Inputs MA_Type - type of multiplicity: Moving Average. Double Moving Average. Triple Moving Average. MA_Period - the MA period. MA_Method - the averaging met
Description A colored universal multicurrency/multi-symbol indicator Bollinger Bands to be drawn in a separate window below the main financial instrument. The rising and falling line of the main indicator and Bollinger Bands can be colored. The indicator can be calculated based on one of the eleven basic indicators included in the standard package of the MetaTrader 4 terminal: AD - an indicator of accumulation and distribution of volume. OBV - On Balance Volume. Force - Force Index indicator. MF
Description A colored universal multicurrency/multi-symbol indicator Channel to be drawn in a separate window below the main financial instrument. The indicator uses the calculation method of the Price Channel indicator. The rising and falling line of the main indicator and the Channel lines can be colored. The indicator can be calculated based on one of the eleven basic indicators included in the standard package of the MetaTrader 4 terminal: AD - an indicator of accumulation and distribution o
Keltner Channel
Igor Semyonov
5 (1)
Description Keltner's colored channel indicator,also called STARC band, drawn in the main chart window. The indicator uses the calculation technique of the three drawing options: basic, improved and modified . The first two were proposed by Keltner, the third one - by a successful trader L. Rakshe. You can also search for your own best parameters of the indicator. The upper, middle and lower bands can be colored. The indicator includes the basic analytical tool of the market moods by Keltner. Th

ZigZag Global
Igor Semyonov
Description A colored universal multicurrency/multi-symbol indicator ZigZag to be drawn in a separate window below the main financial instrument. The indicator may be used with any broker, irrespective of the name of the financial instrument since it is necessary to manually enter the name as an input parameter. If you enter a non-existent or incorrect name of a financial instrument, you will receive an error message that this financial instrument is unknown (does not exist).  The indicator can
Description A colored channel indicator Price Channel to be drawn on the main chart of a financial symbol. It can color bullish and bearish moods based on the middle line of the indicator, as well as change the color of the upper and lower lines of the channel. Purpose The indicator can be used for manual or automated trading in an Expert Advisor. Values of indicator buffer of the double type can be used for automated trading:  The middle line of the indicator - buffer 4. The upper line of the
Description Candlesticks is a colored multicurrency/multy-symbol indicator. It shows a financial instrument as a candlestick chart in a separate window below the chart of the main financial symbo. The indicator may be used with any broker, irrespective of the name of the financial instrument since it is necessary to manually enter the name as an input parameter. If you enter a non-existent or incorrect name of a financial instrument, you will receive an error message that this financial instrume
Description Candlestick Tools  is a colored multicurrency/multy-symbol indicator. It shows one of four standard indicators as a candlestick chart in a separate window below the chart of the main financial symbol. The indicator is calculated based on one of two indicators included in the standard package of the МetaТrader 4 terminal: CCI - Commodity Channel Index. RSI - Relative Strength Index. The default indicator is Commodity Channel Index. The indicator may be used with any broker, irrespecti
Pivot Pro
Igor Semyonov
Description Pivot Pro  is a universal color indicator of the  Pivot Points  levels systems. You can select one of its three versions:  Standard   Old , Standard New  and  Fibo . The system will automatically calculate the  Pivot Point  on the basis of market data for the previous day ( PERIOD_D1 ) and the system of support and resistance levels, three in each. It can also display price tags for each level. You can color the indicator lines. Only a method of calculation of the third level of supp
Price Levels
Igor Semyonov
Description The indicator is intended for labeling the chart using horizontal levels and/or half-round prices. The indicator works on any financial instrument regardless of the name and the number of digits. A user can choose colors for the indicator lines. Input Parameters Calc_Method - method of calculation of the lines: levels of round prices. levels of half-round prices. Digits_Accepted - flag for calculating the levels according to number of decimal places in the quotes of a financial inst
Description A colored universal multicurrency/multi-symbol indicator MACD Line Smart (the indicator moving average convergence divergence is displayed as a histogram) based on double or triple moving average .  Comparing to the standard MACD this indicator is more sensitive to what allows generating advance signals. he indicator may be used with any broker, irrespective of the name of the financial instrument since it is necessary to manually enter the name as an input parameter. If you enter a
筛选:
无评论
回复评论