RTS5Pattern profi
- 指标
- Tomas Belak
- 版本: 10.50
- 更新: 8 七月 2025
- 激活: 10
RTSPattern v10.50 – Elevate Your Price Action to a Data-Driven Strategy
RTSPattern v10.50 is more than just an indicator — it’s a precision tool that brings pattern recognition and predictive modeling into your price action workflow. Whether you’re identifying recurring structures or validating market behavior, RTSPattern helps you move from guesswork to statistical confidence.
What makes RTSPattern unique:
- Intuitive Pattern Selection
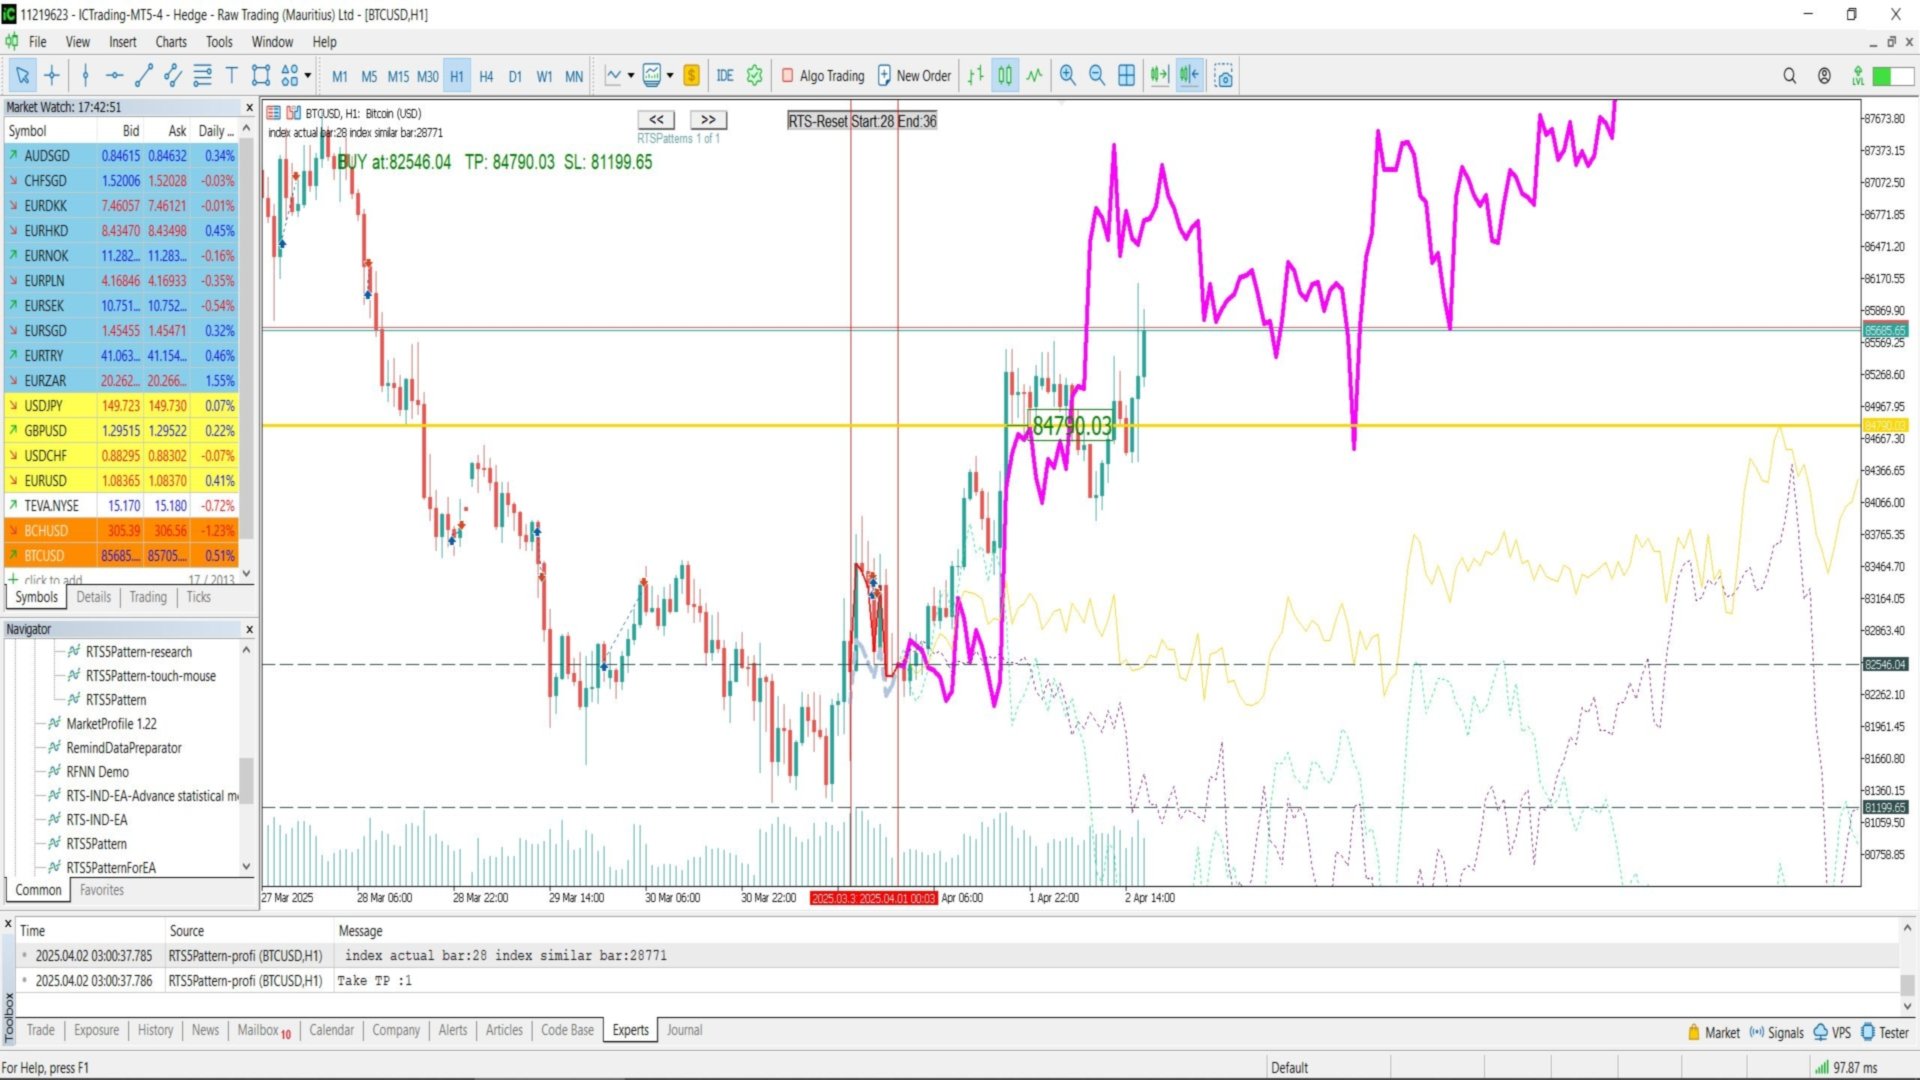
Simply click the first and last candle of any pattern you see on the chart. The algorithm scans thousands of historical bars to find the closest matches — instantly. - Real Historical-Based Prediction
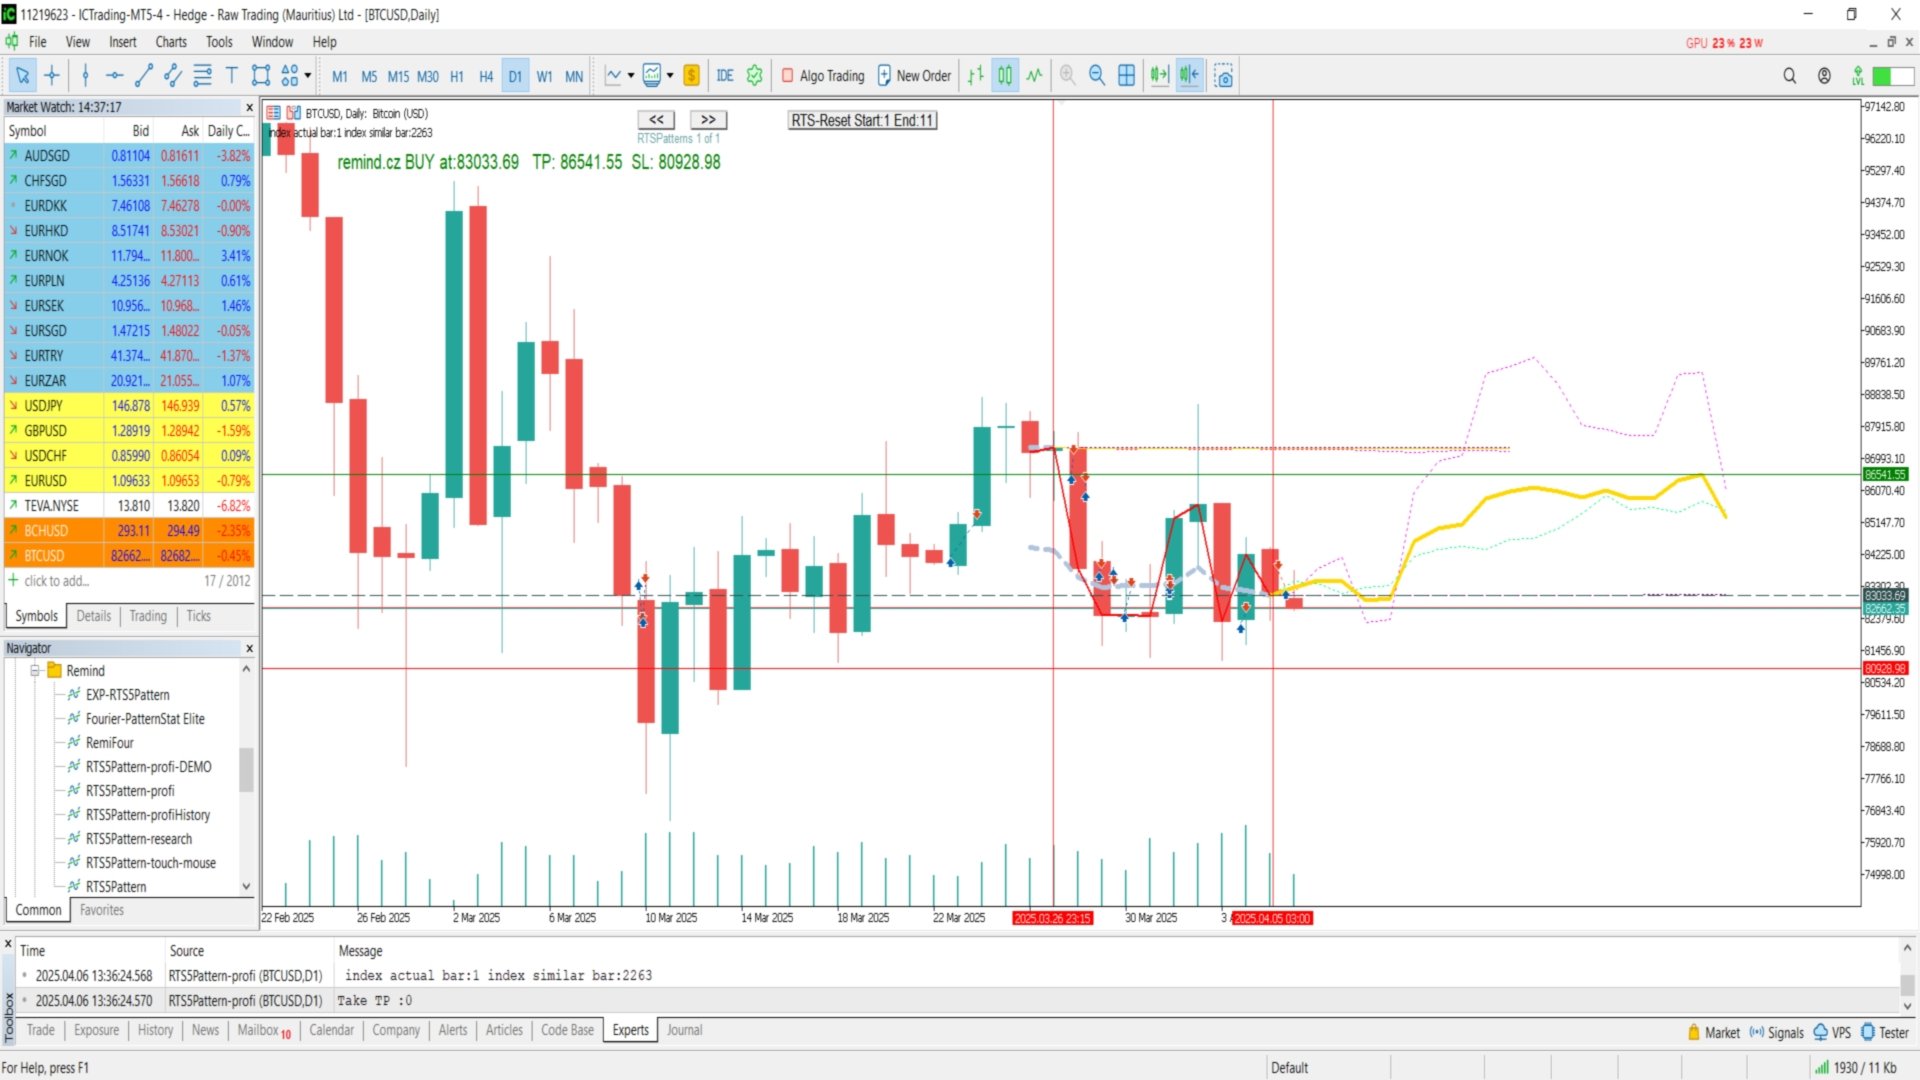
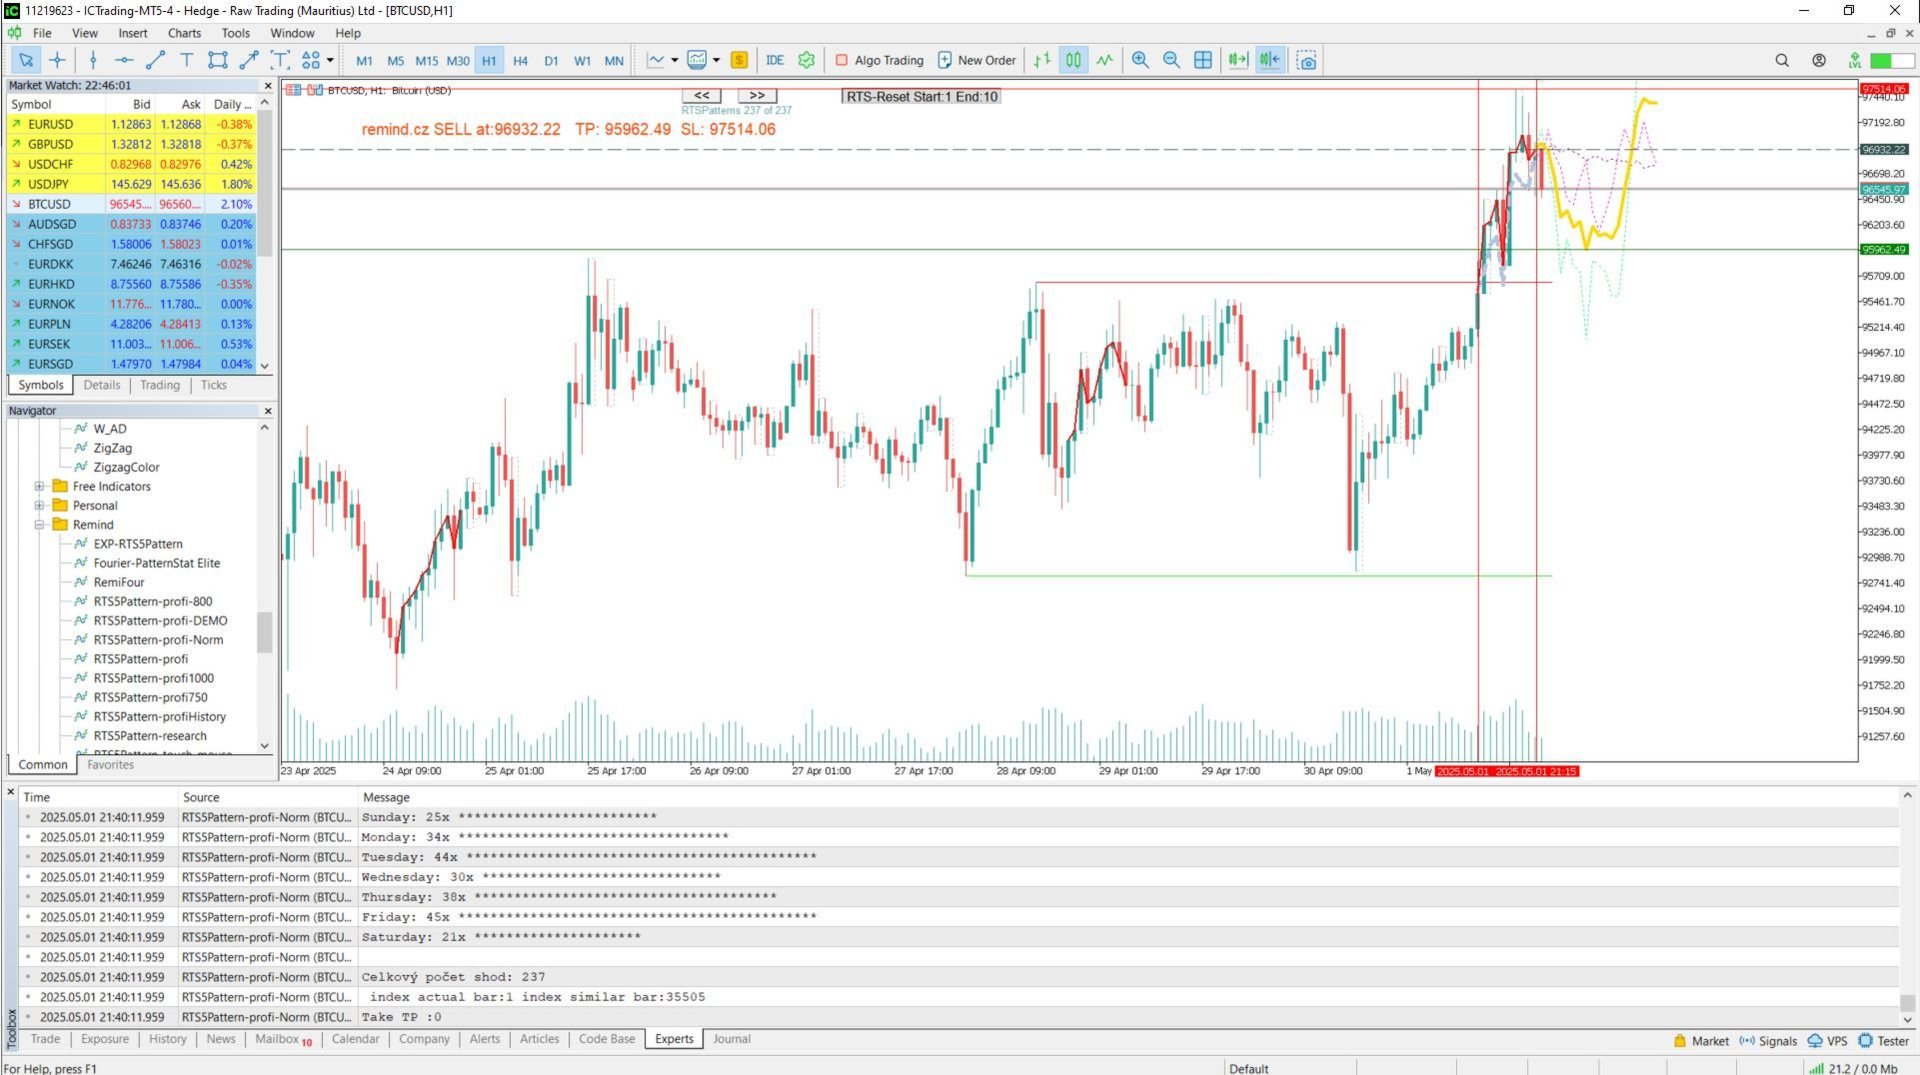
The indicator pulls the 3 most statistically similar patterns from history and constructs a weighted future projection, offering both visual guidance and probabilistic context. - Auto-Generated TP/SL Levels
Based on the behavior of similar patterns, RTSPattern calculates realistic take profit and stop loss zones. These aren’t based on hope — they’re derived from how the market actually behaved after similar patterns in the past. - Optimized for Performance
Version 10.50 introduces major optimizations in calculation speed, memory handling, and visual responsiveness. Ideal for high-speed scalpers, swing traders, and prop firm evaluations like FTMO. - Seamless Visual Integration
The interface is clean, intuitive, and interactive — no bulky menus or clutter. Visual lines, buttons, and labels appear right on the chart where you need them, when you need them.
Here’s how RTSPattern elevates Price Action:
Traditional price action relies on subjective interpretation — a human eye trying to find and trust recurring formations.
RTSPattern keeps the discretion of the trader intact, but overlays it with data-driven historical validation.
You no longer ask “Have I seen this before?” — the tool shows you exactly when and how often it happened, what followed, and how close your current setup matches.
It adds context to conviction — the most powerful upgrade to any price action methodology.
RTSPattern v10.50 helps transform raw observation into precision forecasting.
Try the demo (valid through October 30, 2025) and see your chart in a completely new light — one that looks both backward and forward with clarity.
RTS5Pattern is the perfect tool for any trader working with Price Action and classic support/resistance levels. It helps traders quickly and effectively verify whether a visually identified pattern has historical support and provides context for anticipating future price movement.