RTS5Pattern profi
- Göstergeler
-
Tomas Belak
 Welcome.
 - Sürüm: 23.11
- Güncellendi: 26 Temmuz 2026
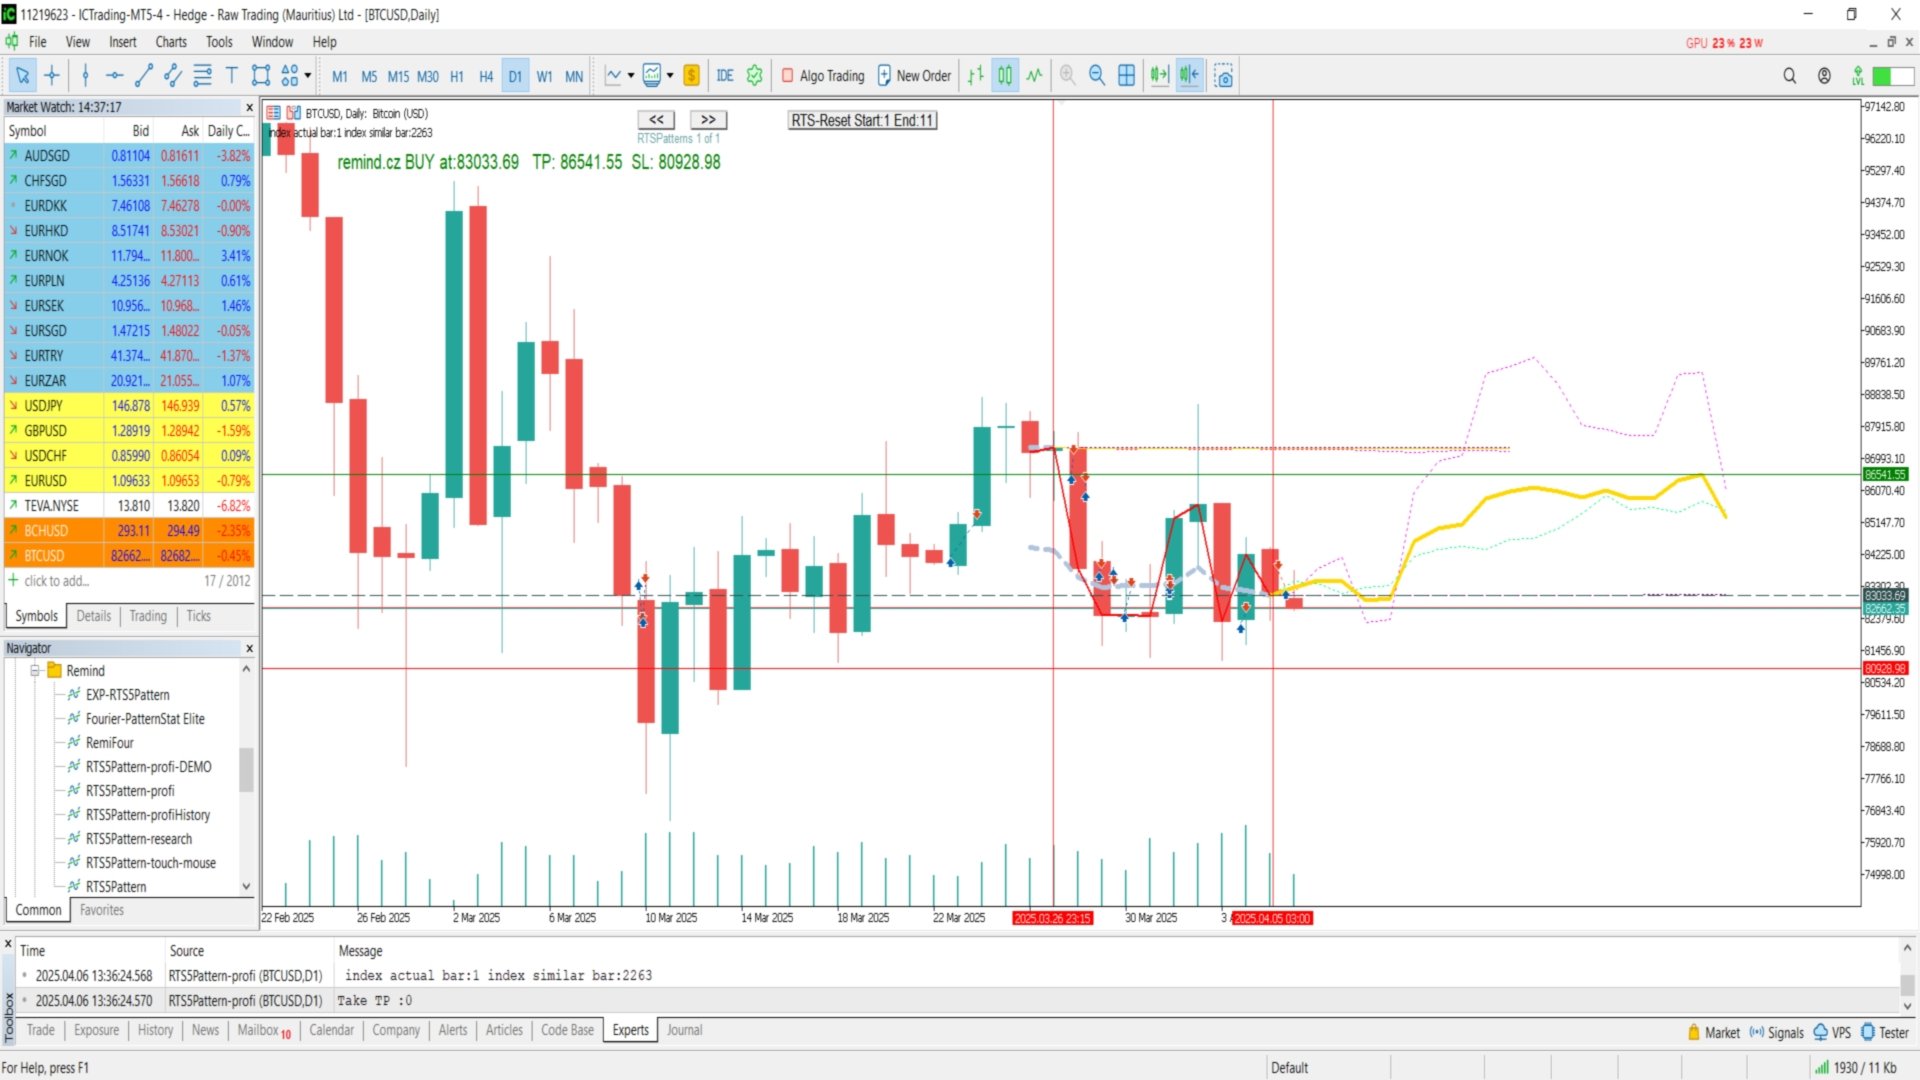
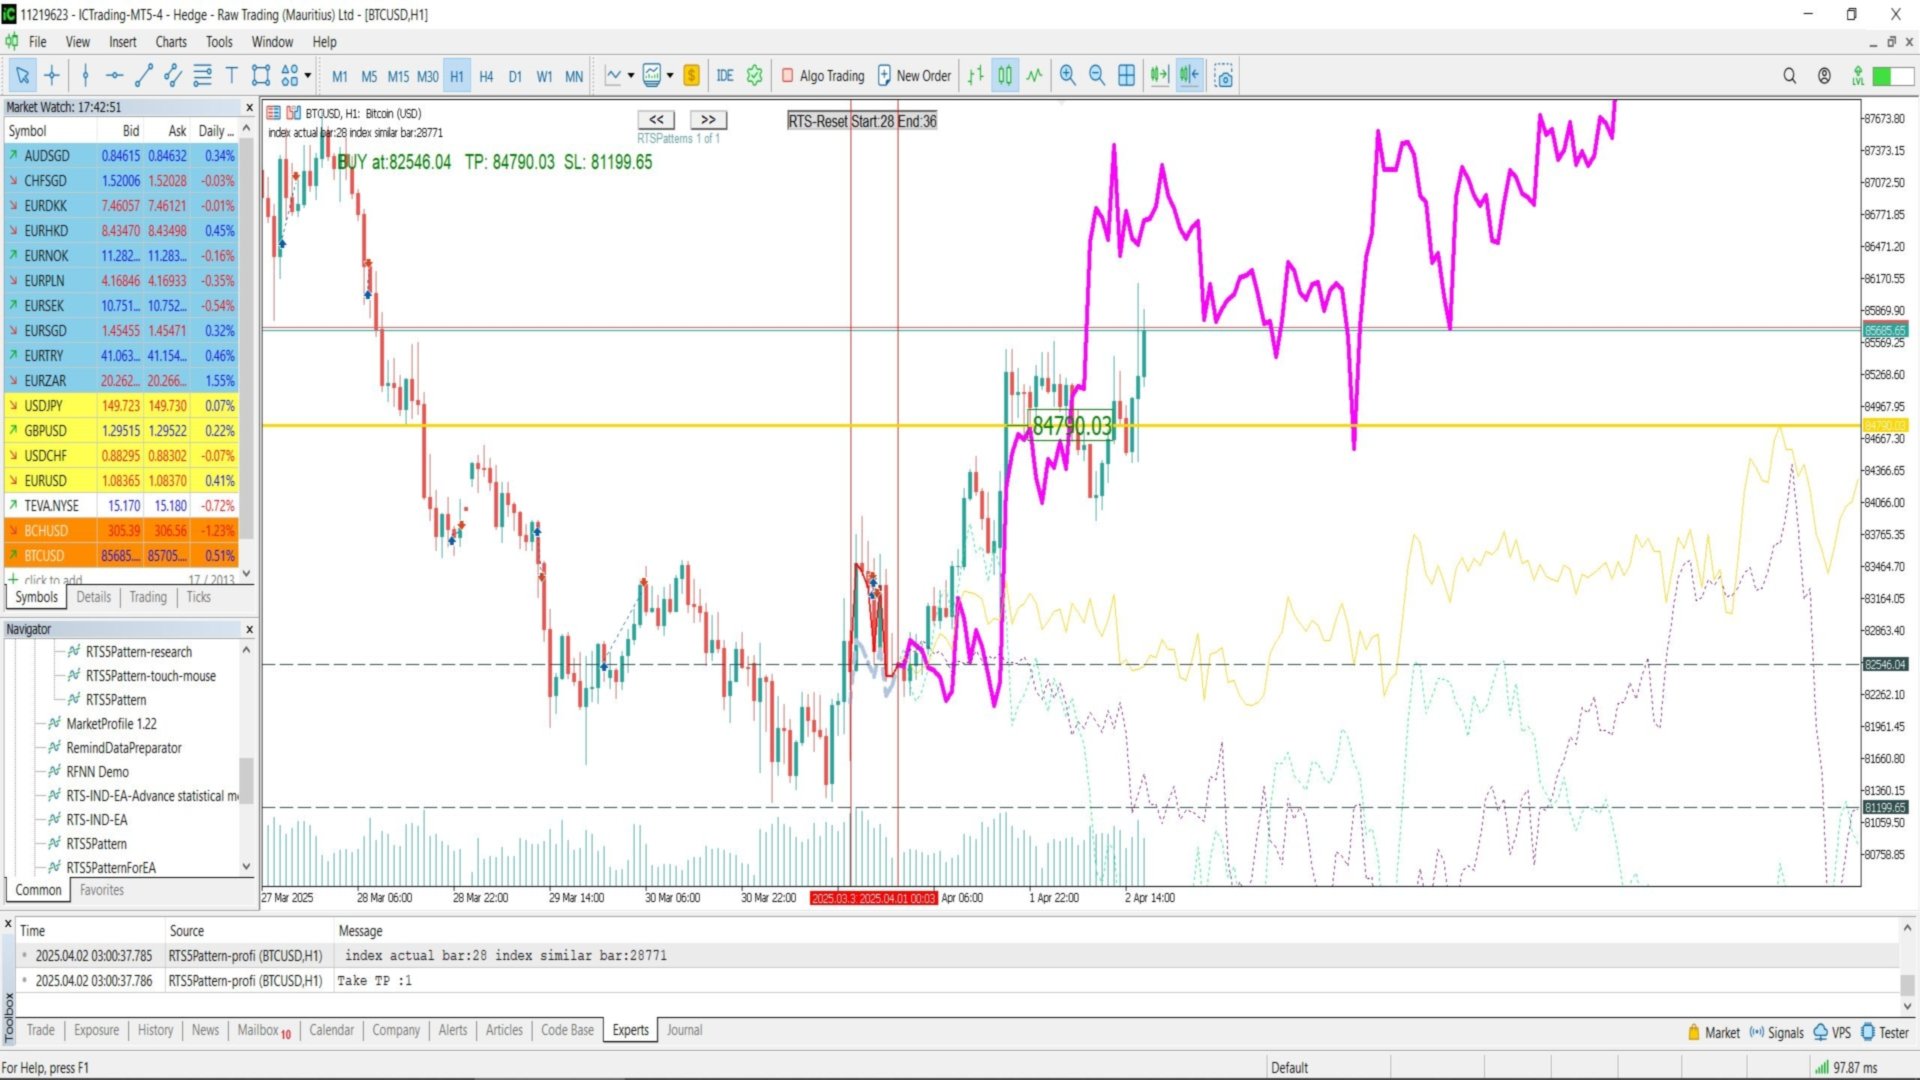
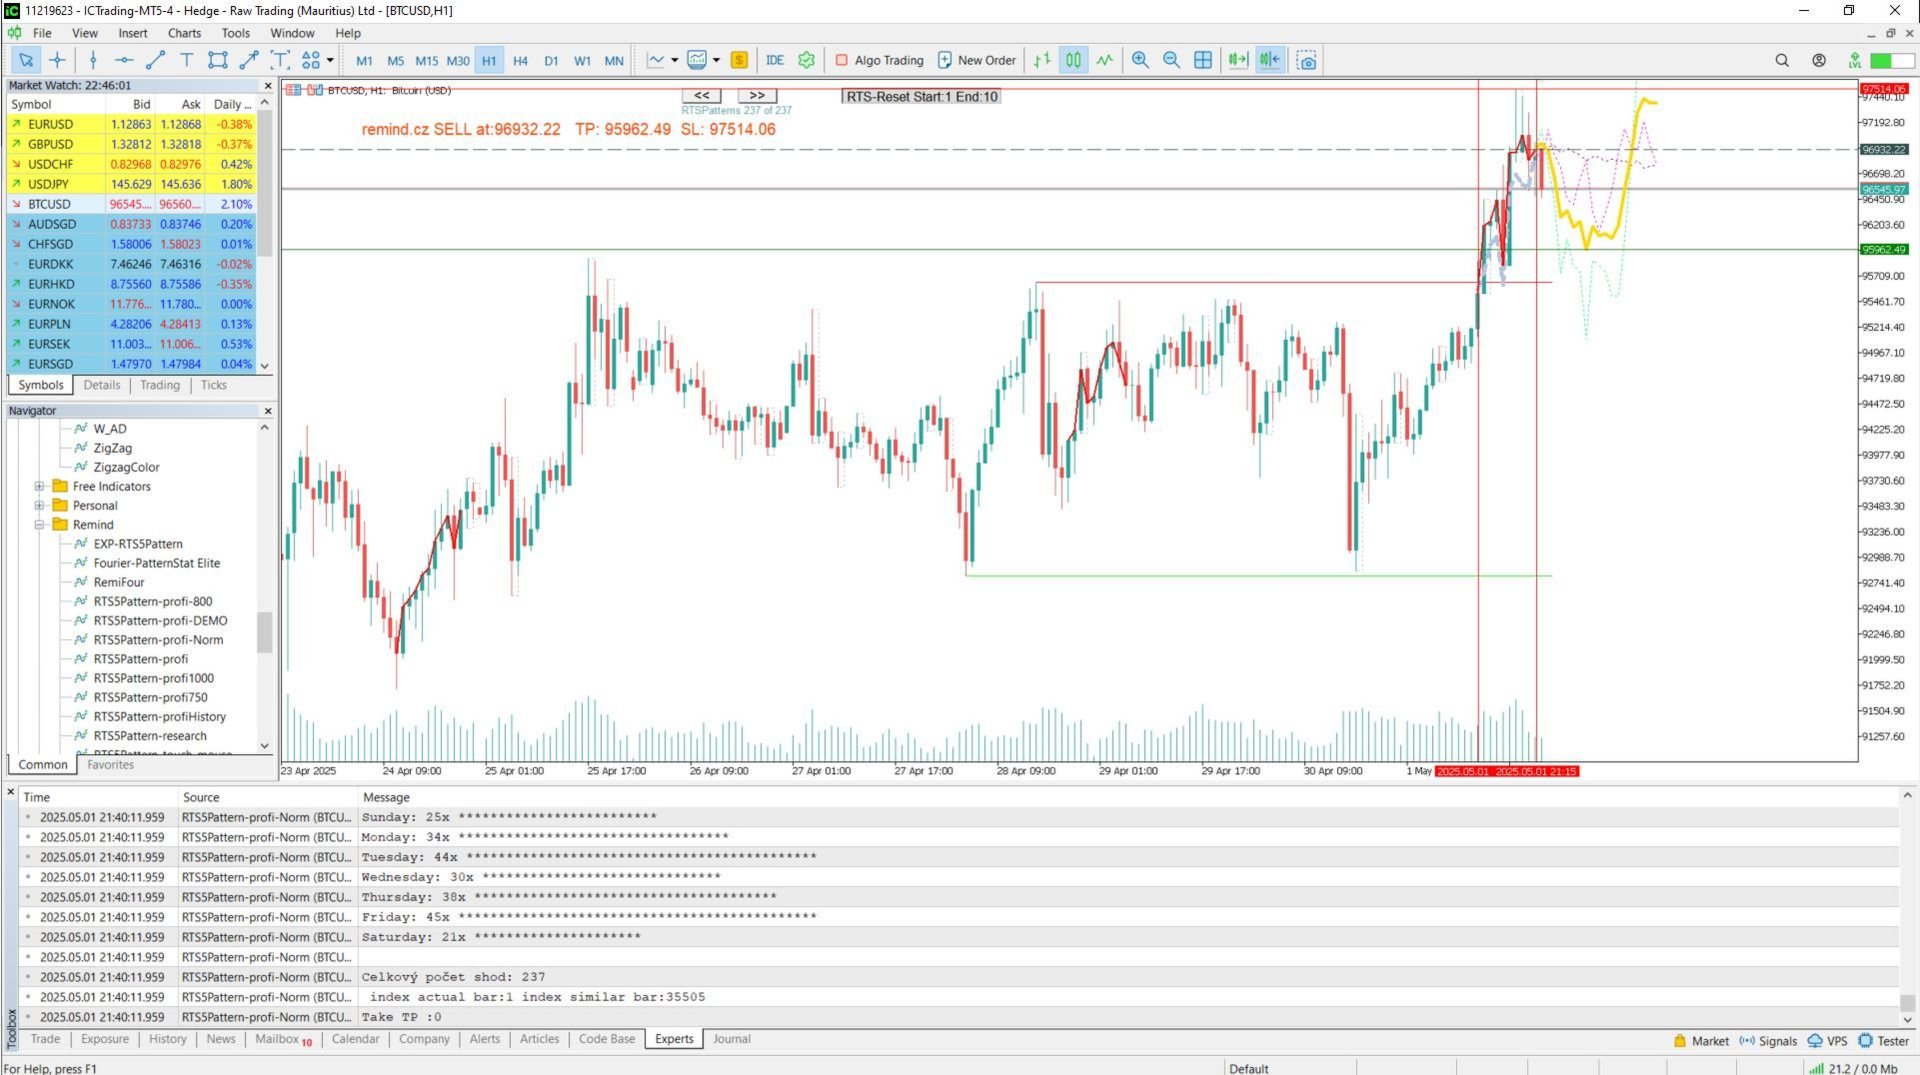
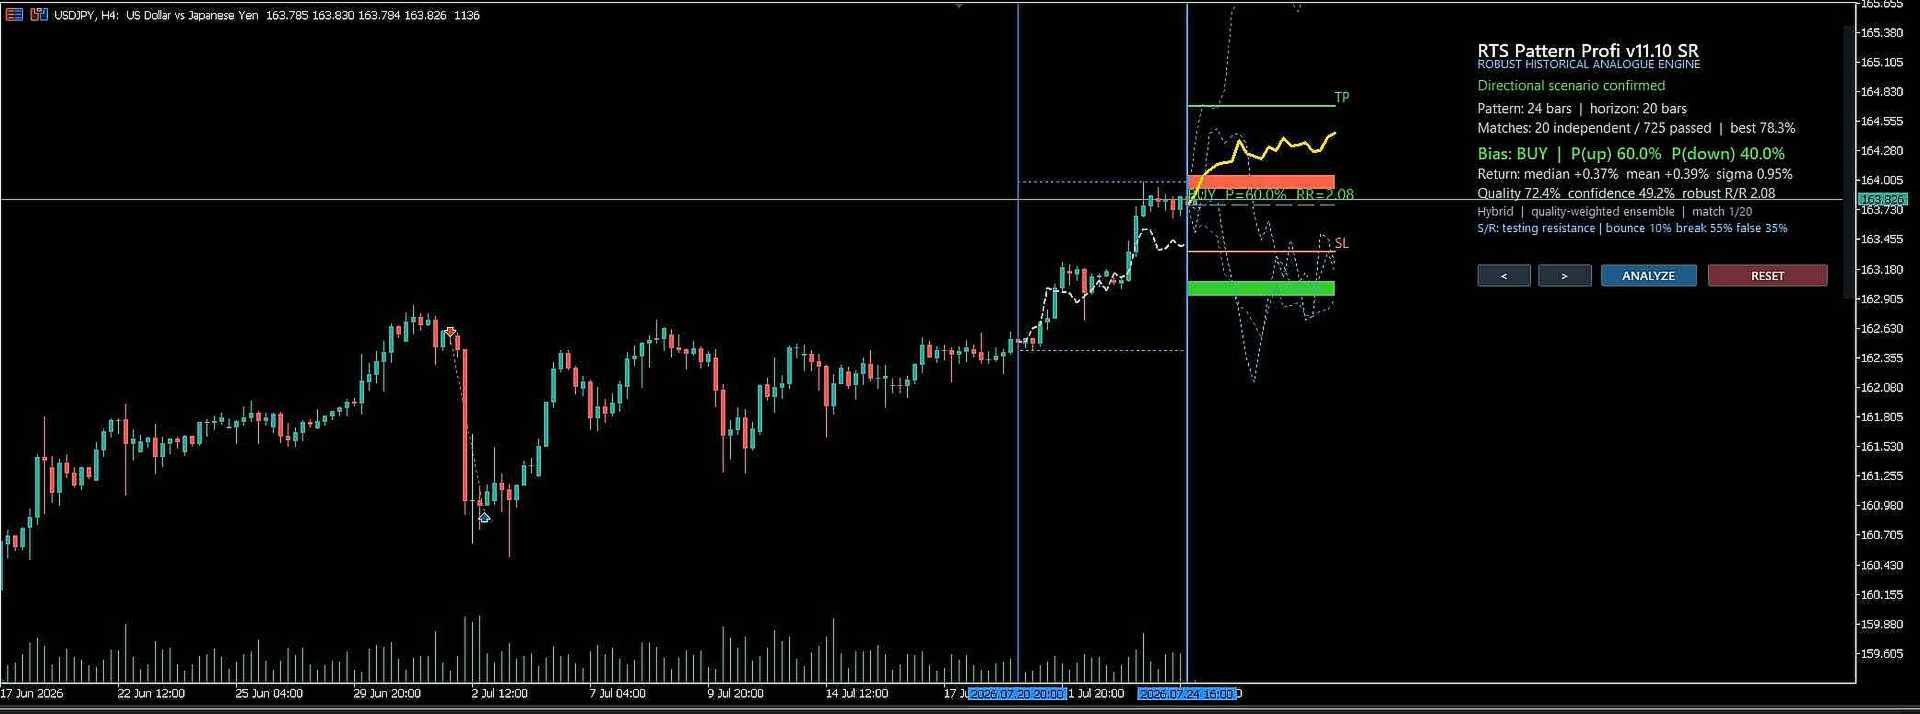
RTS Pattern Profi — Historical Market Memory Transformed into Probability
RTS Pattern Profi is an advanced analytical indicator for MetaTrader 5, developed according to the Remind Trading System philosophy.
It searches historical market data for structurally similar price situations and evaluates:
- Price-pattern similarity
- Volatility and candle structure
- Support and resistance context
- Bounce, breakout and false-breakout scenarios
- Directional probability, expected reward and risk
The indicator transforms historical outcomes into a transparent probabilistic forecast with projected price paths, quantile ranges and statistically evaluated BUY, SELL or NEUTRAL scenarios.
RTS Pattern Profi does not generate simplistic trading promises. It provides measurable historical context for disciplined and independent decision-making.