Graphic Order Tool

Graphic Order Tool

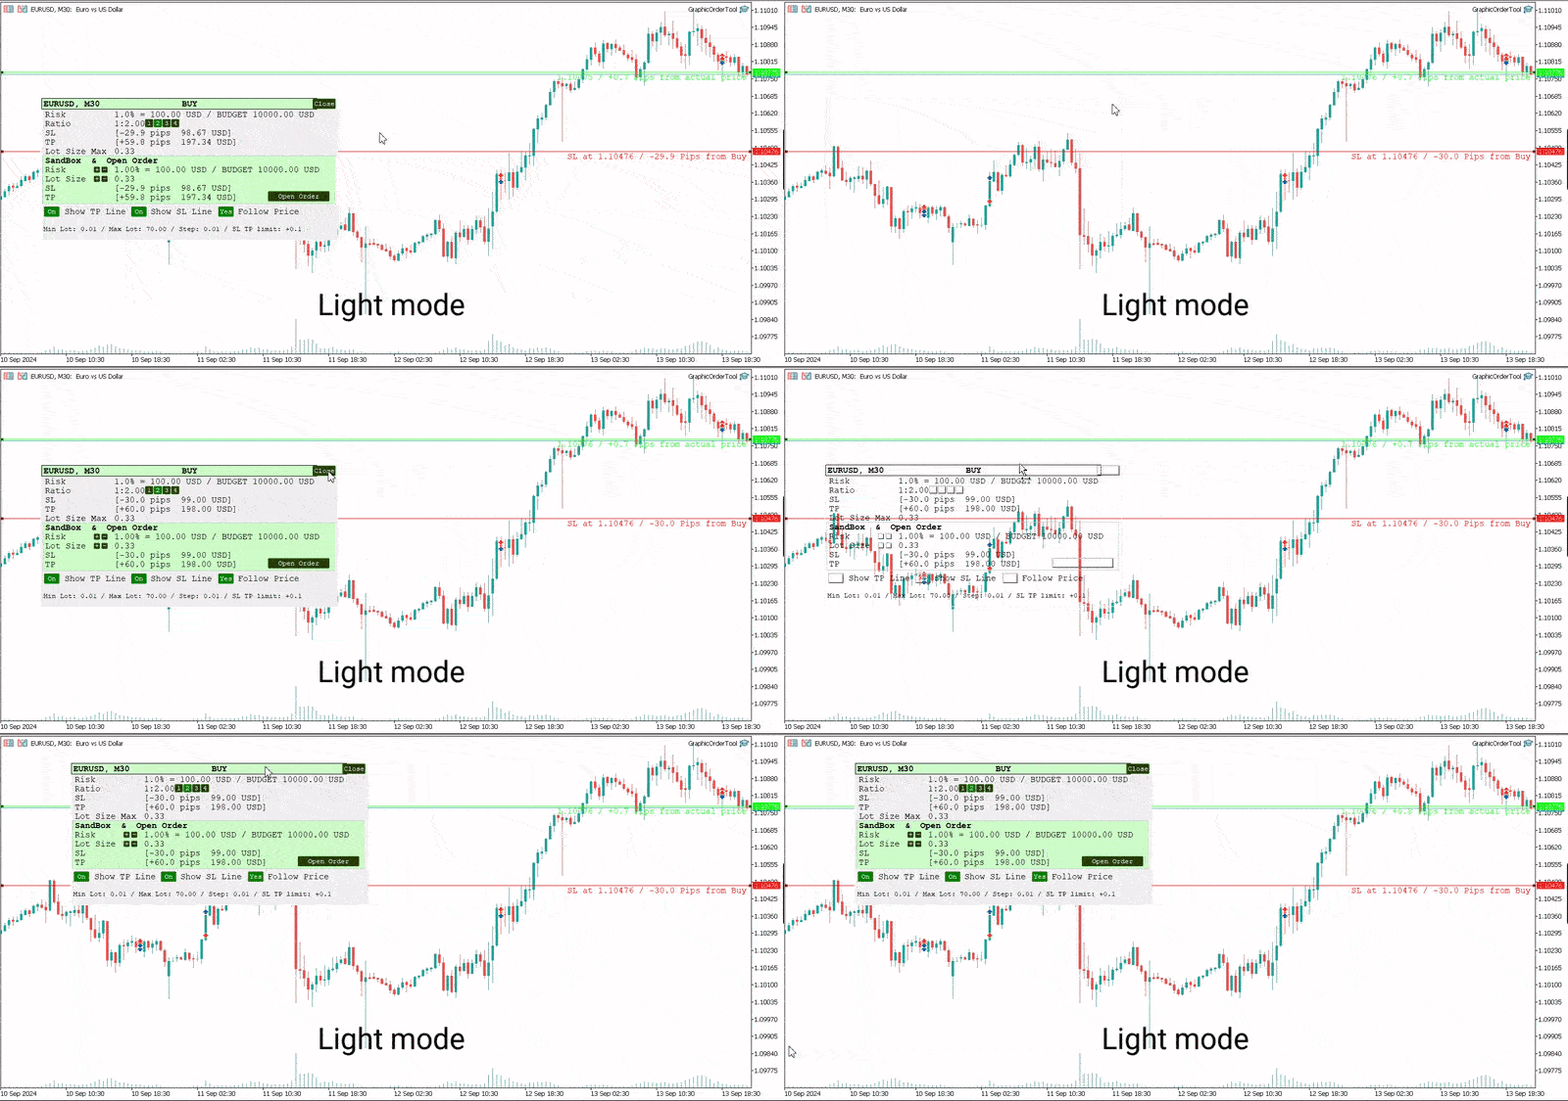
Graphic panel to help trader to make orders.

Drag TP line, SL line and/or ENTRY line with immediate calculation of the profit and loss in pips and USD.

Risk management: Set % of your balance you can risk in the order to make it safe for your money.

Automatically detect the type of possible order (BUY, SELL, BUY_STOP, SELL_LIMIT, BUY_LIMIT, SELL_STOP) depending on mode (BUY/SELL) and position of lines ENTRY, TP, SL.

Panel is semi-transparent, not to cover the main chart.

Description
  • Order Data Calculations
Graphic panel calculates all the data necessary to place an order:
- determines order type: BUY, SELL, BUY_STOP, SELL_STOP, BUY_LIMIT, or SELL_LIMIT,
- calculates volume of order in lots, depending on determined level of risk,
- allows to drag entry level ENTRY and calculates current line price and deviation from current security price in pips,
- set Stop Loss level SL (by default and by dragging) - determines price, deviation from ENTRY, amount of loss in USD and pips,
- set Take Profit level TP (by ratio to SL and by dragging)- price, deviation from ENTRY, amount of earning in USD and pips.
  • Risk Level
Choose the amount of money you are willing to risk in the order by setting the Risk Management information:
- initial budget:
  - BALANCE (the balance of your trading account at the time of settlement), or
  - EQUITY  (the equity of your trading account ), or
  - fixed budget as a basis of trading (BUDGET),
- % (percentage) of initial budget to apply to the order (example: 1%).

The value RISK = (BUDGET * Percentage) is used as the basis for calculating two mutually dependent values:
- the Stop Loss SL value (in USD), which should be less or equal to the RISK, and
- the volume of the order (in lots),  which will be determined in assumption that the whole RISK is applied.
  • Stop Loss Level
If SL level is approximately close to ENTRY level, volume can be larger, and as soon as SL line moves away from the ENTRY, volume decreases and can reach a minimal value, usually = 0.01 lot. (The minimal lot value is determined for each security).

The initial value of SL in pips is a parameter to set when the tool is activated.    
Anyway, this value can easily be changed by dragging the SL line in any direction: closer to ENTRY or further from ENTRY.
Usually the trader sets the SL line looking at Support and Resistance levels.
  • Take Profit Level
Take Profit level is determined by the Ratio parameter. The initial value is set to Ratio = 2.0, which means that the trader expects to earn 2 times more than to (possibly) lose. There are buttons 1 - 2 - 3 - 4 to set one of the fixed ratio levels (1.0, 2.0, 3.0 or 4.0).

Example: If ratio is equal to 3 - TP level is set to earn 3 times more than to lose.

Anyway, the trader can manually drag TP line, increasing or decreasing the expected profit of the order. After each TP line movement the current Ratio value is recalculated and displayed on the Ratio line.
  • Trade Modes
Two modes of tool usage are supported: BUY and SELL.
Actual price of the security is set to "Ask" in BUY mode and to "Bid" in SELL mode.  

BUY mode includes three options: BUY, BUY_STOP, and BUY_LIMIT.

Basic mode is : BUY. But if manually drag ENTER line UP or DOWN - the order turns into postponed order
- BUY_STOP : to ask a broker to open a long position at a price higher than the current price
- BUY_LIMIT : respectively to open a long position at a price lower than the current price.

The same for SELL mode:
- SELL_STOP : to open a short position at a price lower than the current price.
- SELL_LIMIT : to open a short position at a price higher than the current price.

Each time you drag the ENTER line, the Follow Price button turns red, indicating that the ENTER line is moved beyond the current price line. To return to the basic mode (just BUY, or SELL), press Follow Price button, it will turn green.
  • Sandbox and Open Order Action
Sandbox is used to play with order volume.

Use buttons "+" and "-" to increase/decrease values of Risk and Lot Size:
- increasing Risk you want to earn more: lot Size is increased too.
- increasing/decreasing Lot Size you set order volume to the value you want. Risk is recalculated after every change of Lot Size.

After all the lines and risk settings are set you will see that the following data on the Graphic Tool are settled:
- trade mode;
- entry level (don't forget, after dragging ENTRY line you set the order type);
- Stop Loss  level;
- Take Profit level;
- Lot Size,

you can press *Open Order* button to open order you just configured.
  • UI
- Title
  - security name (symbol), time-frame;
  - order type;
- Order information
  - risk calculation base;
  - ratio for Take Profit calculation;
  - Stop Loss info;
  - Take Profit info;
  - order volume calculation
- Sandbox
  - risk percentage variation
  - order volume variation
  - Stop Loss info
  - Take Profit info
  - Open Order button
- Buttons
  - Show TP Line
  - Show SL Line
  - Follow Price
- Lot size information
  • UX
- Keyboard buttons
  - "B" - keyboard button "B" activates BUY mode and displays the Graphic Tool
  - "S" - keyboard button "S" activates SELL mode and displays the Graphic Tool
  - "C" - keyboard button "C" removes the Tool from the screen (except the SL, TP and ENTRY lines)
- Mouse
  - drag the Tool to move it (grab by the header)
  - button "Close" on the right top corner of the Tool
- Tool buttons
  - "Show TP Line" :
  - "Show SL Line" ON/OFF
  - "Follow Price" ON/OFF
  • Instructions
  1. Download *GraphicOrderTool* to MT5 terminal (**Experts** folder).
  2. Activate *GraphicOrderTool* on some security graph.
    1. Fill parameters - set BALANCE/EQUITY or BUDGET.
    2. If BUDGET is chosen - populate value of budget.
    3. Choose Risk percentage.
    4. Choose initial TP level in pips.
    5. Press OK.
  3. Place mouse on the graph canvas (to allow *GraphicOrderTool* to handle graph events)
  4. Press "B" or "S" on the keyboard - *GraphicOrderTool* is appeared on the canvas
  5. Drag SL line to the preferred price level
  6. Choose risk ratio level or drag TP line
  7. Inspect calculated values of SL and TP in the USD currency
  8. Use Sandbox to play with values of risk and lot size


Drag ENTER line if you prefer to use deferred orders


You can manually drag the TP line, SL line and ENTRY line with immediate calculation od the profit and loss in USD.

Risk management: You can set % of your balance you can involve into the order to make it safe for your money.

Application automatically detects the type of possible order (BUY, SELL, BUY_STOP, SELL_LIMIT, BUY_LIMIT, SELL_STOP) depending on position of lines ENTRY, TP, SL.
  • Development
Basic idea and initial solution is taken from William Roeder MT4 Order Tool. Graphics is fully reworked into MT5 style using graphic objects and C++ classes.


推荐产品
Trade Idea Tracker
Nathanael Ed Toussaint
Trade Idea Tracker Trade Idea Tracker is an indicator designed for traders who execute multiple entries within a single trading idea . Instead of evaluating trades individually, it allows you to track performance at the idea level , helping you understand whether your overall market bias and execution are profitable. Key Functionality Track multiple entries associated with a single trade idea Monitor realized profit and loss for the entire idea View combined results instead of isolated trades Or
Replay para MT5
Renato Sanchez Moura
Replay Study — Train the Market as If It Were Live Replay Study is a tool designed for traders who want to accelerate their growth through realistic practice. With it, the trader can go back in time, choose a specific date and time, and follow the market candle by candle, simulating decisions as if they were trading live. Instead of simply looking at a static chart after the move has already happened, Replay Study allows you to study price behavior in motion, test entries, train market reading,
All in One Multi Indicator
Teerathad Booranawisedkul
Overview Comprehensive technical analysis indicator combining 20+ essential trading tools in a single chart display. Moving Averages EMA (Exponential Moving Average): 9, 21, 50, 200 periods SMA (Simple Moving Average): configurable period Customizable colors and line widths Price position indicators (above/below) Oscillators & Momentum RSI (Relative Strength Index): adjustable overbought/oversold levels MACD (Moving Average Convergence Divergence): customizable fast/slow/signal periods Stochasti
Double Fractal Entry Bot trades automatically using fractal breakouts or rebounds. It detects precise entry points, places SL and TP based on market structure, and includes logic to manage risk and avoid false signals. Simple, smart, and powerful. This product is also available for MetaTrader 4 =>  https://www.mql5.com/en/market/product/143609 Double Fractal Entry Bot is an intelligent trading robot based on the proven logic of the Double Fractal Entry indicator. It analyzes price using upper a
MT5 to Telegram 桥接器 – 完整交易通知系统 分步安装指南 创建 Telegram 机器人 打开 Telegram,搜索   @BotFather 。 发送   /newbot ,按提示命名机器人。 复制 机器人令牌 (例如   1234567890:ABCdef... )。 获取聊天 ID 将机器人加入您的 Telegram 群组(或私聊)。 在群组中发送任意消息。 浏览器访问: https://api.telegram.org/bot&lt ;您的令牌>/getUpdates 找到   "chat":{"id":-123456789}   – 复制该数字(群组 ID 带负号)。 安装 EA 到 MT5 将   .mq5   文件复制到   \MQL5\Experts\   目录。 在 MetaEditor 中按   F7   编译(应无错误)。 允许 WebRequest MT5 菜单: 工具 → 选项 → 智能交易系统 。 勾选   “允许对下列 URL 进行 WebRequest” 。 添加   https://api.telegram.org ,点击   确
DM IND Exclusive
Sergio Vidal Prado
Indicador Para Opções Binarias. Indicator for Binary Options Usa dois gales. Instalar em mt5 Esse indicador é para ser usado no tempo de vela de 5 minutos e em M5. Este também funciona em M1, porém é mais eficiente em M5. Só descompactar e copiar os arquivos na pasta de dados do seu MT5. Arquivos indicator na pasta MQL5 - Indicator. Baixe também a Media Movel totalmente gratis: https://www.mql5.com/pt/market/product/50400 Esse Indicador é para a próxima vela. Apareceu a seta, só aguardar a próx
Pivots Lines
Abakou Nazaire Ayelenou
5 (1)
FREE
ClickDrag可以轻松地在图表上画线和移动对象。 点击,然后拖动,开始绘制趋势线。 水平移动鼠标可以画出价格线。 垂直移动鼠标可画出日期线。 现有的线和对象可以通过点击和拖动来移动。 显示开始点到结束点之间的价格和时间差。 开始后点击&拖动。 左右摇动来改变颜色。 向上和向下摇动可以删除。 - 什么是Click & Drag ? 1. 按下鼠标左键(按)。 2. 松开鼠标左键(释放) 3. 按下鼠标左键(按住) 4.保持按住并移动鼠标(拖动) 这个动作允许你画趋势线,移动对象,改变颜色和擦除。 箭头、价格对象、斐波那契、吉安线、周期线和形状也可以移动。 如果你不小心画了一条线,请移动到图表外,然后释放按钮。这条线就会消失。 比中间点击更容易。比中间点击的可见性更好。 但它不能用于不可选择的对象。 外汇的PIPS和差价合约的货币。
FREE
Utilities
Douglas Lucio De Araujo
Indicator with 3 features - Clock : Clock independent of the chart, counting continues even when the market is closed. - Template : After setting up a configuration in any graphic, be it color patterns, indicators, zoom ... The configuration will be copied to all active graphics. - TimeFrame : Set the TimeFrame on a chart, and with just one click all the active charts will be changed to the same TimeFrame.

"Battles between bulls and bears continue to influence price development long after the combat has ended, leaving behind a messy field that observant technicians can use to manage risk and find opportunities. Apply "trend mirror" analysis to examine these volatile areas, looking for past action to impact the current trend when price turns and crosses those boundaries." RSI Mirrors and Reflections is a robust technique using multiple RSI periods, mirrors and reflections based on RSI values to ind
Special offer : ALL TOOLS , just $35 each! New tools   will be   $30   for the   first week   or the   first 3 purchases !  Trading Tools Channel on MQL5 : Join my MQL5 channel to update the latest news from me Zero Lag MA Trend Levels MT5与扫描仪指标结合了零滞后移动平均线 (ZLMA) 和标准指数移动平均线 (EMA),为交易者提供了市场动量和关键价格水平的全面视图。此外,扫描仪和警报功能使交易者能够轻松跟踪多个货币对和时间框架的信号,从而增强发现交易机会的能力。 See more MT4 version at:     Zero Lag MA Trend Levels MT4 with Scanner See more products at:   https://www.mql5.com/en/users/ndhsfy/seller 主要特点
Bar Sequential
Maximiliano Frisione Figueroa
This indicator can help you clearly identify trend changes in both bullish and bearish markets. The indicator compares the closing price of the last candle with the closing price of the candle "X" periods ago (input parameter). In an uptrend, an initial number '1' is plotted if a candle closes higher than the closing of a candle "X" periods ago. In a downtrend, an initial number '1' is plotted if a candle closes below the closing of a candle "X" periods ago. Subsequent numbers are plotted when e
FREE
Fibonacci Auto Levels Pro MT5 – 回撤、扩展和枢轴点 (Pivot Points) Fibonacci Auto Levels Pro MT5 是一款先进的技术分析工具,可自动检测市场摆动点,并在图表上绘制完整的斐波那契回撤、扩展和枢轴点结构。 该指标将几个独立的系统组合成一个统一的分析工具: 枢轴点 (Fibonacci 模式) 枢轴点用于根据前一期的价格范围确定潜在的支撑和阻力区域。 该指标使用 斐波那契枢轴点 ,这些点是应用斐波那契比率计算得出的,并应用于前期的最高价 (High)、最低价 (Low) 和收盘价 (Close)。 枢轴点的时间周期可以手动设置,也可以根据以下逻辑自动设置: 日内交易 ≤ 5 分钟 → 4 小时 5–45 分钟 → 1 日 45 分钟–4 小时 → 1 周 日线 → 1 月 周线 → 3 月 月线 → 12 月 用户也可以手动选择任何更高的时间周期。 斐波那契回撤水平 (自动) 斐波那契回撤可帮助交易者在回调期间确定潜在的支撑/阻力区域。 该指标自动扫描图表,检测摆动低点/高点,并绘制所有主要回撤水平: 23.6%、38
Harmonic Patterns Osw MT5
William Oswaldo Mayorga Urduy
用户手册:谐波形态 OSW MT5 1. 简介和用途 谐波形态 OSW 是一款高级算法分析工具,旨在基于斐波那契水平自动检测几何价格结构。该指标使用与 ZigZag 算法相连的搜索引擎来过滤市场噪音,并定位价格容易反转的高概率区域。其目标是识别诸如 Gartley、蝙蝠、蝴蝶、螃蟹和鲨鱼形态等模式,使交易者能够以专业精度预测市场反转。 2. 参数指南(输入菜单) 模式选择(显示谐波) 显示未定义形态:显示那些虽然不符合经典类别,但仍保持相关斐波那契几何形状的技术结构,以便进行手动分析。 显示 Gartley / 蝙蝠 / 蝴蝶 / 螃蟹 / 鲨鱼形态:可根据您的策略单独启用或禁用对每种特定形态的搜索。 警报系统(警报) K线信号:定义通知时间。 Candle_0 在达到目标价位时实时发出警报;Candle_1 在蜡烛图确认后发出警报(更为保守)。 发送警报(电脑/邮件/手机):启用声音通知、电子邮件或推送通知至移动设备上的 MT5 应用。 视觉配置和几何形状 看涨/看跌颜色:自定义买入(看涨)和卖出(看跌)结构的颜色。 允许角度:这是容差因子。例如,如果某个价
Smart Pivot Points
Alexandr Saprykin
MetaTrader 5 智能枢轴点指标 — 清晰的交易水平线 智能枢轴点指标是一款适用于 MetaTrader 5 的专业指标,可自动计算并在图表上显示一整套关键交易水平线。它将纷繁的价格走势转化为清晰的结构化图表,突出显示支撑位、阻力位、价格平衡点和潜在目标区域。该工具专为重视清晰度的交易者而设计,适用于任何市场:外汇、加密货币(比特币、以太坊)、股指、股票和大宗商品(XAUUSD)。 该指标是您可靠的分析助手,可节省计算时间并为您的分析增添客观性。它不会提供市场信号或替您做决定,而是为您做出明智的交易决策提供高质量的信息基础。 主要功能和优势 即用型价格坐标系统:无需再手动绘制水平线。五条清晰的线条会立即显示在图表上:中心水平线(平衡点)、支撑位、阻力位、买入目标位和卖出目标位。 完全自定义显示内容:您可以决定显示哪些信息。轻松启用或禁用级别组和价格标签,根据您的策略定制图表,并保持工作区整洁。 完全灵活的计算方式:选择任意时间周期进行计算——从用于超短线交易的分钟级(M5、M15)到用于波段交易的日线(D1)和周线(W1)。通过指定要使用的历史数据周期数来调整分析
The   DailyWeeklyMarkers   indicator helps traders visualize trading weeks by clearly marking the start of each day and week on the chart. It draws vertical separator lines for each day (including weekends if enabled) and highlights the beginning of new trading weeks with double lines for better clarity. This makes it easier to analyze price action within daily and weekly contexts. Who Is This Indicator For? Swing Traders   – Helps identify weekly opening gaps and key levels. Day Traders   – Vis
FREE
Fractals MTF
Kong Yew Chan
Multi-Timeframe Fractal Indicator Description for MQL5 Introducing the Multi-Timeframe Fractal Indicator! Key Features: Multi-Timeframe Analysis: Analyze Fractals on a timeframe independent of your chart's current timeframe. Gain insights from higher timeframes for informed trading decisions. Customizable Parameters: Timeframe: Choose the timeframe on which Fractals will be calculated (e.g., Daily, H4, etc.). Number of Bars: Specify the number of bars considered around a potential Fractal for c
Optimal F Service Application Type: Service Application Functions: Calculation of the optimal fraction and trade volume to achieve maximum growth of the equity curve, based on the results of previous trades. About this app Capital management is the most crucial and often underestimated component of any trading system. Proper capital management can enhance—and sometimes significantly improve—the performance of your trading algorithm. This application automatically calculates the optimal fractio
MQL5 博客: https://www.mql5.com/en/blogs/post/770443 MT4 版本: https://www.mql5.com/en/market/product/157434 MT5 版本: https://www.mql5.com/en/market/product/178388 RANGE LADDER [tambangEA] 是一款专业的可视化分析指标,专为希望更清晰地了解图表可见范围内市场活动的交易者而设计。 该指标创建了一个高级的区间阶梯仪表盘,展示了成交量在各个价格区间的分布情况。它将市场活动分为四个实用类别: 买家入场 卖家出场 卖家入场 买家出场 这种结构有助于交易者了解价格区间是由新的买盘活动、空头回补、新的卖压还是买家出场活动支撑的。 该指标采用简洁的暗黑奢华风格仪表盘,配备 TradingView 风格的中间阶梯、侧边轮廓、智能区域标签以及可拖动/最小化的控制面板。它适用于使用支撑位和阻力位、市场结构、趋势延续、突破、回调和反转分析的主观交易者。 重要数据说明 此 MetaTrader 版本使用成交量增量代
Detailed Description: The   Pivot Point Classic Indicator   is designed for traders who rely on classic pivot points and midpoints levels for their trading strategies. By automatically calculating and plotting these levels, the indicator provides a clear, visual representation of critical price areas where the market may reverse or break out. Key Features: Automatic Pivot Point Calculations : Automatically calculates pivot points, three support (S1, S2, S3) and resistance (R1, R2, R3) levels bas
FREE
Trend Dynamics
Oleksandr Powchan
Trend Dynamics Expert Advisor is a level trader designed to be as precise as possible. Because of the extreme accuracy of the entries and the algorithms ability to filter out bad trades, the system does not take new trades every day. The system was not optimized and has fixed indicator settings as its universally adaptable. Be aware, that its recomended to run multiple pairs on the same account for more profit. Our Goal is to help you be way more profitable and way more stress free, so you can
Break of Structure
Rajesh Kumar Nait
市场结构是在更高的时间范围内突破时可能有助于清除交易者趋势的结构。 1. 该指标将之字折线仅绘制到最后 2 个结构(之字折线的前高点和低点),并且仅当结构发生突破时才会形成之字折线的新柱 2.它给终端和推送通知结构中断 3.通过[和]键增加和减少ZigZag的Extdepth来调整摆动 4.更改线AB BC和CD的颜色 5.添加到许多图表并获得多个符号的警报 如果您正在寻找结构断裂 Multi ExtDepth Breakout Multi Symbol Scanner 您可以使用此产品: Multi Symbol Multi ExtDepth ZigZag Breakout Scanner 市场结构是在更高的时间范围内突破时可能有助于清除交易者趋势的结构。 1. 该指标将之字折线仅绘制到最后 2 个结构(之字折线的前高点和低点),并且仅当结构发生突破时才会形成之字折线的新柱 2.它给终端和推送通知结构中断 3.通过[和]键增加和减少ZigZag的Extdepth来调整摆动 4.更改线AB BC和CD的颜色 5.添加到许多图表并获得多个符号的警报 如果您正在寻
Dynamic Trend Moving Average for MT5 Dynamic Trend Moving Average is an intelligent moving average indicator designed to help traders instantly identify the current market trend through a simple and intuitive color-coding system. Unlike traditional moving averages, this indicator automatically changes color according to market conditions: Green – Bullish trend detected Red – Bearish trend detected Yellow – Neutral market or transition phase This visual approach allows traders to quickly
Ice Pivot points
Benbyaanda Silvere Henri Sedric Kabore
Pivot points have been a trading strategy for a long time, originally used by floor traders. Using this method, you can understand where the market is going in a day through a few simple calculations. The pivot point in the pivot point method is the turning point of the market direction during the day. A series of points can be obtained by simply calculating the high, low and closing price of the previous day. These points may form key support and resistance lines. The pivot point, support and
FREE
Pivot Scenario Dashboard is a compact trading indicator designed to display daily pivot-based market structure in a clean and professional dashboard. It automatically calculates the main pivot level, support and resistance zones, and scenario-based market bias for the current symbol. The indicator helps traders quickly identify: main pivot level bullish and bearish trigger areas support and resistance levels target projection levels current market scenario in a compact dashboard Main Features: D
AutoLevels
Maxim Kuznetsov
Automatic calculation and marking of resistance and price reversal levels. The script will perform statistical calculations and plot a regular grid on which the quote moves on the graph. These levels are very stable. Use them in trading planning and for placing pending orders. Just select a timeframe and AutoLevels will indicate the important places of the chart in the form of horizontal lines. Solid lines indicate more "dense" areas - areas of price reversal, where the quote happens more oft
Adaptive Math Zones Indicator is a professional MT5 indicator designed to identify high-probability price reaction areas using mathematical price projections and Fibonacci-based channel structures. The indicator automatically builds a reference price channel, highlights neutral zones, and projects future price levels (50%, 100%, and 200%), helping traders visually understand market structure and potential reaction points. This tool is especially effective during ranging and corrective market con
博客: https://www.mql5.com/en/blogs/post/769823 MT4: https://www.mql5.com/en/market/product/176181 MT5: https://www.mql5.com/en/market/product/176182 VOLUME BUBBLE [tambangEA] 是一款高级可视化成交量压力指标,旨在帮助交易者直接在图表上识别异常市场活动。 该指标可检测异常的成交量变化,并将其显示为围绕价格走势的清晰气泡标记。每个气泡代表一次成交量压力事件,使交易者能够快速查看可能出现强劲参与、不平衡、动量压力或潜在吸收的位置。 此工具专为希望快速直观地了解市场参与情况,而无需逐根K线手动分析原始成交量数据的交易者而设计。 主要概念 大多数价格图表仅显示价格走势。VOLUME BUBBLE [tambangEA] 则在此基础上增加了一个维度:市场参与。 该指标有助于解答以下重要问题: 异常成交量出现在何处? 压力是看涨还是看跌? 价格走势是否得到强劲的参与? 市场是否出现可能的吸收? 当前的活
HenGann
Ehsan Kariminasab
Hengann Sq, using artificial intelligence, mathematical algorithms, Fibonacci, 9 Gann and Fibonacci square strategy, which enables us to have win rate of 200% profit per month. Initial investment for minimum capital of $100 to $1000, you be able to adjust the volume, date, hour, day and profit limit. adjustable profit limit in both buy and sell positions. Able to place orders in all time frames from 5 minutes to a week. further adjustment enables you to open the position according your desir
Draw Pivot Point
Rainer Schnoege
The utility draws pivot levels for the selected timefram in classic method. Pivot = (high + close + low) / 3 R1 = ( 2 * Pivot) - low S1 = ( 2 * Pivot) - high R2 = Pivot + ( high - low ) R3 = high + ( 2 * (Pivot - low)) S2 = Pivot - (high - low) S3 = low - ( 2 * (high - Pivot)) you can change the timeframe, colors and fontsize. also you can change the text for the levels. Have fun and give feedback...
FREE
该产品的买家也购买
Trade Assistant MT5
Evgeniy Kravchenko
4.43 (214)
它有助于计算每笔交易的风险,容易安装新的订单,具有部分关闭功能的订单管理, 7 种类型的追踪止损和其他有用的功能。   附加材料和说明 安装说明   -   应用程序说明   -   模拟账户应用程序的试用版 线条功能  - 在图表上显示开仓线、止损线、止盈线。 有了这个功能,就可以很容易地设置一个新的订单,并在开仓前看到它的附加特性。   风险管理  - 风险计算功能在考虑到设定的风险和止损单的大小的情况下,计算新订单的成交量。它允许你设置任何大小的止损,同时观察设定的风险。 批量计算按钮 - 启用 / 禁用风险计算。 在 " 风险 " 一栏中设置必要的风险值,从 0 到 100 的百分比或存款的货币。 在 " 设置 " 选项卡上选择风险计算的变量: $ 货币, % 余额, % 资产, % 自由保证金, % 自定义, %AB 前一天, %AB 前一周, %AB 前一个月。   R/TP 和 R/SL - 设置止盈和止损的关系。 这允许你设置相对于损失的利润大小。 例如, 1 : 1 - 这决定了 TP = SL 的大小。 2 : 1 - 这意味着 TP 是 SL 的两倍。 RR -
欢迎来到 Trade Manager EA——这是一个终极风险管理工具,旨在使交易变得更直观、精准和高效。它不仅仅是一个下单工具,而是一个用于无缝交易计划、仓位管理和风险控制的全面解决方案。不论您是新手交易员、资深交易员,还是需要快速执行的剥头皮交易员,Trade Manager EA 都可以满足您的需求,适用于外汇、指数、大宗商品、加密货币等各种市场。 借助 Trade Manager EA,复杂的计算已成过去。只需分析市场,在图表上用水平线标记入场、止损和止盈,设置您的风险水平,Trade Manager 就会立即计算出理想的头寸规模,并实时显示以点、账户货币计价的止损和止盈。每笔交易都得以轻松管理。 主要功能: 头寸规模计算器 :根据定义的风险瞬间确定交易规模。 简单的交易计划 :在图表上用可拖动的水平线直接计划交易,设置入场、止损和止盈。 实时显示 SL 和 TP :以账户货币、点或分显示止损和止盈,便于分析。 高级保护工具 盈亏平衡选项 : 基本盈亏平衡 :当您的交易达到设定水平时自动保护利润。 多级盈亏平衡 :设置多达 4 个级别以逐步保护利润。 尾随止损选项 : 基本尾随
Local Trade Copier EA MT5
Juvenille Emperor Limited
4.96 (142)
通过 Local Trade Copier EA MT5 获得非常快速的交易复制体验。它的简单1分钟设置,使您可以在同一台Windows计算机或Windows VPS上在多个MetaTrader终端之间复制交易,具有闪电般快速的复制速度,低于0.5秒。 无论您是初学者还是专业交易者, Local Trade Copier EA MT5 都提供了广泛的选项,可根据您的特定需求进行自定义。对于任何希望增加利润潜力的人来说,这都是终极解决方案。 今天就尝试一下,看看为什么它是市场上最快、最简单的贸易复印机! 提示: 您可以在您的模拟账户中下载并试用 Local Trade Copier EA MT5 模拟版: 这里 将下载的免费演示文件粘贴到您的 MT5 >> 文件 >> 打开数据文件夹 >> MQL5 >> 专家文件夹并重新启动您的终端。  免费演示版本每次可在 4 小时内发挥全部功能,仅限演示帐户。 要重置试用期,请转至 MT5 >> 工具 >> 全局变量 >> Control + A >> 删除。 请仅在非关键模拟账户上执行此操作,不要在挑战道具公司账户中执行此操作。 如果您无法
TradePanel MT5
Alfiya Fazylova
4.88 (162)
交易面板是一款多功能交易助手。该应用包含超过50种手动交易功能,并允许您自动执行大多数交易任务。 在购买之前,您可以在演示账户上测试演示版本。下载用于演示账户的试用版应用程序: https://www.mql5.com/zh/blogs/post/762579 。 完整说明 这里 。 贸易. 只需单击一下即可执行交易操作: 打開掛單和頭寸,並自動計算風險。 一鍵打開多個訂單和頭寸。 打開訂單網格。 按組別關閉掛單和頭寸。 反轉頭寸方向(關閉買入>打開賣出,關閉賣出>打開買入)。 鎖定頭寸(通過開啟缺少的頭寸,使買入和賣出頭寸的數量相等)。 一鍵部分關閉所有頭寸。 將所有頭寸的止盈和止損設置在同一價格水平。 將所有頭寸的止損設置在盈虧平衡水平。 開倉時,可使用以下功能: 在多個訂單或倉位之間分配計算出的數量(在單擊一次時開啟多個訂單和倉位)。 在開啟訂單前在圖表上可視化交易水平。 僅在當前點差不超過設定值時才開啟倉位。 止盈和止損之間的自動比例。 虛擬止損和止盈。 自動將止損和止盈的大小增加為當前點差的大小。 基於ATR指標讀數計算止盈和止損。 設置掛單的到期日期。 為掛單設置追蹤(掛單
测试版发布 Telegram to MT5 Signal Trader 即将进入正式的 Alpha 版本。一些功能仍在开发中,您可能会遇到一些小错误。如果您遇到问题,请反馈,您的意见将帮助我们改进软件。 Telegram to MT5 Signal Trader 是一款强大的工具,能够将 Telegram 频道或群组的交易信号自动复制到您的 MetaTrader 5 账户。 支持公开和私人频道,可将多个信号提供者连接至一个或多个 MT5 账户。软件优化、高效、稳定,精准控制每笔复制交易。 界面简洁,仪表盘美观,图表交互性佳,导航直观。您可以管理多个信号账户,自定义每个提供者的设置,并实时监控所有操作。 系统需求 由于 MQL 限制,EA 需要配合 PC 端应用与 Telegram 通信。 安装程序可通过官方 安装指南 获取。 核心功能 多提供者支持: 从多渠道复制信号至多个 MT5 帐户 高级信号识别: 关键词、模式和标签全面自定义 逐提供者控制: 可启用/禁用特定信号类型、平仓策略等 灵活风险管理: 固定手数、固定金额、余额/权益百分比、部分平仓设置 可定制 SL/TP: 覆盖信号
Telegram to MT5 Multi-Channel Copier 可自动将您 Telegram 频道中的交易信号直接复制到 MetaTrader 5。无需机器人,无需浏览器扩展,无需手动复制。您在 Telegram 上收到信号,EA 会在几秒钟内在您的终端上开仓。 本产品包含两个组件:一个监听您 Telegram 频道的 Windows 应用程序,以及在您的 MT5 终端上执行信号的 EA。同时也提供 MT4 版本。 设置指南和应用程序下载: https://www.mql5.com/en/blogs/post/768988 工作原理 Windows 应用程序使用您自己的 API 凭据连接到 Telegram,而不是机器人。这意味着它可以读取您订阅的任何频道、群组或话题,包括私人和 VIP 频道。检测到信号后,它会进行解析并发送给 EA。EA 根据您的经纪商解析交易品种名称,基于您的风险设置计算手数,然后开仓。 整个过程都是自动的。您无需守在电脑前。 打开应用程序并登录 Telegram(仅第一次)。 选择要监听的频道或话题。 按下 Start。EA 会处理其余的一切。 支持的
Power Candles 策略扫描器——自优化多符号设置查找器 Power Candles策略扫描器 采用与Power Candles指标相同的自优化引擎,可同时扫描您“市场观察”中的所有交易品种。一个面板即可显示当前哪些品种在统计上具备交易价值、每种策略的最佳应用方向、最优止损/止盈组合,并在新信号触发时立即向您发送提醒。 本工具是 Stein Investments 生态系统的一部分 - 18+ 款工具,加上 Max,您的一对一 AI 交易导师。  随时在线,深入了解每一款指标,在您需要梳理思路的那一刻就在那里。  立即认识他: https://stein.investments 您的全面市场监控。每个交易品种超过3,000次自动优化。2种警报类型。一键切换图表并采取行动。 为何您需要此工具 大多数多标的扫描器仅展示价格 波动 。每只股票的波动率、百分比变化、RSI。您仍需自行摸索正确的策略、合适的止损位以及理想的入场阈值。Power Candles策略扫描器针对每只股票自动解答这些问题,仅在数学验证过的交易设置中触发实际入场信号时才会向您发出提示。这就是全部卖点。 自动
Exp COPYLOT CLIENT for MT5
Vladislav Andruschenko
3.94 (34)
适用于 MetaTrader 5 的专业交易复制器 快速、专业、稳定可靠的 交易复制器 ,适用于 MetaTrader 。 COPYLOT 可在 MT4 和 MT5 终端之间复制 Forex 交易,并支持 Hedge 和 Netting 账户。 COPYLOT 的 MT5 版本支持: - MT5 Hedge → MT5 Hedge - MT5 Hedge → MT5 Netting - MT5 Netting → MT5 Hedge - MT5 Netting → MT5 Netting - MT4 → MT5 Hedge - MT4 → MT5 Netting MT4 版本 完整说明 + DEMO + PDF 如何购买 如何安装 如何获取日志文件 如何测试和优化 Expforex 的所有产品 您也可以将交易复制到 MT4 终端(MT4 → MT4,MT5 → MT4): COPYLOT CLIENT for MT4 COPYLOT 是一款专业的交易和持仓复制器,可同时与 2、3 甚至 10 个终端协同工作。 支持从 模拟账户和投资者账户 复制,也支持同时在多个终端上运行。 您可以使
Anchor Trade Manager
Kalinskie Gilliam
5 (5)
Anchor: The EA Manager Run your full EA portfolio without conflicts, without stacked risk, and without watching every chart yourself. Anchor coordinates up to 64 Expert Advisors on a single account, including daily loss protection built for prop firm rules. Attach Anchor to any chart. Type your EA names and magic numbers in one line. Click OK. Anchor begins coordinating immediately. Built for portfolios. Built for prop firms. Built for discipline. The Problem Running multiple EAs on the same acc
Trade copier MT5
Alfiya Fazylova
4.59 (49)
Trade Copier 是一种专业实用程序,旨在复制和同步交易账户之间的交易。 复制发生从供应商的帐户/终端到收件人的帐户/终端,安装在同一台计算机或 vps 上。 促销活动 - 如果您已经购买了“Trade copier MT5”,您可以免费获取“Trade copier MT4”(用于 MT4 > MT5 和 MT4 < MT5 的复制)。欲了解更多详细条款,请通过私人消息与我们联系! 在购买之前,您可以在演示帐户上测试演示版本。 演示 这里 。 完整说明 这里 。 主要功能和优点: 支持复制MT5>MT5、MT4>MT5、MT5>MT4,包括МТ5 netting账户。 供应商和收件人模式在同一产品中实现。 简单直观的界面,允许您直接从图表中实时控制复制。 连接中断或终端重新启动时不会丢失设置和位置。 允许您选择要复制的符号,也可以替换接收者的符号,例如 EURUSD> USDJPY。 支持回拷贝。 能够仅复制某些订单。 允许您设置开仓交易价格的最大差异和最大时间延迟。 正确复制部分订单关闭的执行。 计算复制手数的几种方法。 同步止盈和止损。有几种方法可以计算它们的位置。 支持
Farmed Hedge Yield Farming | All Markets (Manual - Hybrid - Semi/Automated EA) MULTI-ASSET SUPPORT Trade any asset available on your broker - Forex: Major, Minor, Exotic pairs - Crypto: BTC, ETH, XRP, SOL, BNB - Stocks: Apple, Tesla, Amazon, Google, etc. - Commodities: Gold, Silver, Oil, Gas - Indices: US30, NAS100, SPX500, DAX40 - Any CFD your broker offers VERIFIED TRADING RESULTS - Farmed Hedge Yield Axi Copy:  https://www.mql5.com/en/signals/2356376 - Farmed Hedge Yield Exn Copy:   https:/
EasyInsight AIO MT5
Alain Verleyen
4.92 (12)
EASY Insight AIO – 全能智能交易一站式解决方案 概述 想象一下,您可以在几秒钟内扫描整个市场——外汇、黄金、加密货币、指数,甚至股票——无需手动筛选图表、繁琐安装或配置指标。 EASY Insight AIO 是您专为 AI 交易打造的即装即用数据导出工具。它将整个市场快照一次性输出为简洁的 CSV 文件,直接支持 ChatGPT、Claude、Gemini、Perplexity 等各类 AI 平台的即时分析。 无需窗口切换,无需图表叠加,也没有任何杂乱。只需纯净、结构化的数据自动导出,让您专注于基于数据的高效决策,无需再盯盘耗时。 为什么选择 EASY Insight AIO? 真正的一体化 • 无需设置,无需安装指标,无图表叠加。只需安装、运行并导出——就是这么简单。 多资产全覆盖 • 扫描分析外汇、金属、加密货币、指数、股票——您的券商所能提供的一切市场。 AI 专属数据导出 • 高度结构化、针对 AI 优化的 CSV 文件,直接适配主流智能工具和平台。 完整导出内容: • 三个可选周期的货币强度分析 • 净多头头寸变化体现市场情绪 • 成交量变化、
Quant AI Agents
Ho Tuan Thang
5 (1)
Quant AI Agents are independent trading Expert Advisors. Instead of trading using a fixed strategy like other conventional EAs, Quant AI Agents   is a   multi-agent AI trading framework   that turns natural-language strategy prompts into live.  WANT THE SAME RESULTS AS MY LIVE SIGNAL?   Use the exact same brokers I do:   IC MARKETS , IC TRADING   .  Unlike the centralized stock market, Forex has no single, unified price feed.  Every broker sources liquidity from different providers, creating un
Premium Trade Manager - 内置交易导师的图表面板 Premium Trade Manager 将一位交易导师嵌入您的图表,并在其下搭载完整的执行引擎。像往常一样建立交易,然后让您的 AI 交易导师 Max 读取这笔具体的交易,结合您的实时账户给出直接判断,再由您决定是否下单:止损是否符合纪律化交易的要求、风险规模是否合理、高影响新闻事件是否即将发布、您是否接近资金盘限额。其下是完整的执行引擎,负责点击之后的一切:一键按风险下单、您在图表上拖动规划且交易进行中仍可随时调整的计划、最多四个分批止盈级别、七种移动止损方式、实时资金盘合规检查、新闻屏蔽保护,以及对自身成本进行评级的点差功能。决策由您做出。Max 给出第二次审视。面板负责此后的一切。 购买前先亲手体验。 直接在浏览器中点击实时面板,这是在购买前感受其工作方式的最快途径。 stein.investments/products/premium-trade-manager Max 是您的一对一 AI 交易导师,他直接内置于面板之中。  他了解您的账户、您的设置和您的规则,用您自己的语言回答,并在每笔交易下单前进
Seconds Chart MT5
Boris Sedov
4.61 (18)
秒级图表 (Seconds Chart) - 一款专为 MetaTrader 5 设计的独特工具,用于创建秒级时间框架的图表。 通过 秒级图表 ,您可以构建以秒为单位的时间框架图表,获得标准分钟或小时图表无法提供的极致灵活性和分析精度。例如,时间框架 S15 表示每根蜡烛图持续15秒。您可以使用任何支持自定义交易品种的指标和EA交易系统。操作它们就像在标准图表上交易一样方便。 与标准工具不同, 秒级图表 让您能够在超短时间框架下进行高精度交易,无延迟干扰。 免费演示版: Seconds Chart v2.29 Demo.ex5 下载免费演示版,亲自体验: 功能齐全 - 所有功能均可使用 24小时测试 - 足够评估准确性和便利性 仅限模拟账户 - 大多数经纪商均可轻松开立 仅限GBPCAD图表 - 大多数终端均可使用 这些限制仅适用于演示版。完整版适用于任何账户类型(真实、演示、竞赛)和任何图表(XAUUSD、EURUSD 等),无任何限制。 如何安装演示版 通过上方链接下载演示文件 打开MetaTrader -> 文件 -> 打开数据文件夹 -> MQL5 -> Experts 将下
The product will copy all telegram signal to MT5 ( which you are member) , also it can work as remote copier.  Easy to set up, copy order instant, can work with almost signal formats, image signal,  s upport to translate other language to English Work with all type of channel or group, even channel have "Restrict Saving Content", work with  multi channel, multi MT5 Work as remote copier: with signal have ticket number, it will copy exactly via ticket number. Support to backtest signal. How to s
Trade Dashboard MT5
Fatemeh Ameri
4.95 (131)
疲于复杂的订单下达和手动计算?Trade Dashboard 是您的解决方案。凭借其用户友好的界面,订单下达变得轻而易举,只需点击一下,您就可以开设交易、设置止损和止盈水平、管理交易手数,并计算风险回报比,让您只需专注于您的策略。告别手动计算,使用 Trade Dashboard 简化您的交易体验。 立即下载演示版本 。 您可以在这里找到仪表盘功能和特性的详细信息 。 加入 Telegram 频道 。 购买后请给我发消息以获取支持。如果您需要添加更多功能,可以在产品的评论区留下您的想法,我愿意听取任何建议,希望您能在使用我的产品时获得最佳体验 。 这是 MT4 版本。 风险管理:使用 Trade Dashboard,可以将您的风险设置为账户余额或权益的百分比,或将风险设置为总金额。在图表上直观地定义您的止损,让工具准确计算每个货币对的适当手数。该工具还可以根据您期望的风险回报比自动设置止盈水平。它甚至可以在手数计算中涵盖佣金和点差费用。此外,您的止损和止盈可以转变为虚拟水平,隐藏于经纪商。通过 Trade Dashboard 的高级风险管理功能,掌控风险,保护您的资本。 交易线
工作演示版下载 Copy Cat More (跟单猫) MT5 交易跟单器 (Trade Copier) 是一款本地交易跟单器,也是一套完整的风险管理与执行框架,专为当今的交易挑战而设计。从自营公司 (prop firm) 挑战到个人投资组合管理,它凭借稳健的执行、资金保护、灵活的配置和先进的交易处理的结合,适应各种情况。 该跟单器同时支持主控端 (Master,发送方) 与受控端 (Slave,接收方) 两种模式,可实时同步市价单与挂单、交易修改、部分平仓以及对锁平仓 (Close By) 操作。它兼容模拟与真实账户、交易或投资者登录,并通过持久化交易记忆 (Persistent Trade Memory) 系统确保恢复——即使 EA、终端或 VPS 重启也不例外。可借助唯一 ID 同时管理多个主控端与受控端,跨经纪商差异则通过前缀/后缀调整或自定义品种映射自动处理。 试用版:  先试用看看 : 你可以下载并体验  Copy Cat More (跟单猫) 交易跟单器 MT5 试用版,通过 此链接 。 下载后,请将演示文件放入你的终端文件夹: MT5 » 文件 » 打开数据文件夹
Trade Manager DaneTrades
Levi Dane Benjamin
4.28 (29)
交易管理器可帮助您快速进入和退出交易,同时自动计算风险。 包括帮助您防止过度交易、报复性交易和情绪化交易的功能。 交易可以自动管理,账户绩效指标可以在图表中可视化。 这些功能使该面板成为所有手动交易者的理想选择,并有助于增强 MetaTrader 5 平台。多语言支持。 MT4版本  |  用户指南+演示 交易经理在策略测试器中不起作用。 如需演示,请参阅用户指南 风险管理 根据%或$自动调整风险 可选择使用固定手数或根据交易量和点自动计算手数 使用 RR、点数或价格设置盈亏平衡止损 追踪止损设置 最大每日损失百分比,在达到目标时自动平仓所有交易。 保护账户免遭过多提款并阻止您过度交易 最大每日损失(以美元为单位)在达到目标时自动关闭所有交易。 保护账户免遭过多提款并阻止您过度交易 一键实现所有交易的盈亏平衡 自动计算从手机/电话发送的交易的风险 OCO 在设置中可用 交易和头寸管理 通过设置每月、每周、每天、每小时或每分钟的最大交易次数,停止过度交易和报复性交易。 高级挂单管理。 调整何时关闭挂单的规则 追踪挂单 支持市价订单和挂单 每日最大利润目标(以美元为单位)以确保头寸并停止
EA Performance Tracker
Russell Leeon Tan
5 (2)
EA Performance Tracker (AESTracker) A clean, modern dashboard that shows exactly how your trades and EAs are performing — right on your chart. It reads your full account history automatically and breaks down the numbers by magic number / strategy. Display only — it does not place any trades. What it shows - Account header: live Balance, Equity, and Open (floating) P/L - Profit summary: gross profit, net profit, and the exact commission & swap deducted - Key stats: win rate, profit factor, exp
HINN Lazy Trader
ALGOFLOW OÜ
5 (1)
LIMITED SUMMER SALE -40% ! ONLY $470 insead of $790!  Maximum real discount! The core idea: using the user interface, you configure the parameters the chart must meet before entering a position (or positions), choose which entry models to use, and set the rules for when trading and planning should end. Lazy Trader  handles the rest: it  takes over all the routine chart watching and execution! full description  :: 3 key videos [1] ->  [2]   ->  [3] What can it do? - Understands Larry Williams
================================================================================ POC BREAKOUT - V20.72. Full Professional Grade Toolkit ================================================================================ POC Breakout is a full MetaTrader 5 trading dashboard for discretionary traders who want breakout signals, Point of Control (POC) context, volume profiles, order flow, market structure, news, alerts, and advanced trade planning in one professional workspace. Attached directly to you
MetaTrader 5 专业交易面板 —— 图表与键盘一键交易的高效控制中心 一款面向主动交易者的专业 Trading Panel,可让您比标准 MetaTrader 操作方式更快、更直观地完成开仓、平仓、修改、管理与控制。 这不是一个普通的小工具,而是一个为高频手动操作、仓位管理、挂单控制与利润管理而设计的完整交易工作台。 通过这套面板,您可以直接在图表上一键执行交易,通过键盘快速触发核心操作,并借助自动参数计算、图形提示、信息标签以及可视化管理功能,大幅减少重复性操作,让整个交易流程更加流畅、高效且专业。 使用我们的交易面板,您可以直接从图表上一键下单,执行交易操作的速度可比标准 MetaTrader 控件快约 30 倍。 全新高级版本现已推出: 使用 VirtualTradePad PRO SE 升级您的交易流程 — 适用于 MetaTrader 5 和 MetaTrader 4 的新一代专业交易面板。 MT4 版本 | 完整说明 + DEMO + PDF | 如何购买 | 如何安装 | 如何获取日志文件 | 如何测试与优化 | Expforex 的所有产品 为什么交易者会
DrawDown Limiter
Haidar Lionel Haj Ali
5 (20)
Drawdown Limiter EA You are in the right place if you were searching for Drawdown control, Drawdown limiter, Balance protection, Equity Protection or Daily Drawdown Limit related to Prop Firm, FTMO, or Funded account trading, or if you want to protect your trading account. Have you suffered from controlling your drawdown when trading funded accounts? This EA is meant for you. Prop firms usually set a rule called “Trader Daily Drawdown”, and if it is not respected, you are disqualified.  I am an
Welcome to ENTRY IN THE ZONE WITH SMC MULTI TIMEFRAME Entry In The Zone with  SMC Multi Timeframe  is a professional trading indicator built on Smart Money Concepts (SMC), combining market structure analysis with a No Repaint BUY / SELL signal system in a single indicator. It helps traders understand market structure more clearly, identify key price zones, and focus on higher-quality trading opportunities. By combining Multi-Timeframe Analysis, Points of Interest (POIs), and real-time signals, t
Timeless Charts
Samuel Manoel De Souza
5 (7)
Timeless Charts is an all-in-one trading utility for professional traders. It combines custom chart types such as Seconds Charts and Renko with advanced order flow analysis using Footprints , Clusters , Volume Profiles , VWAP studies, and anchored analysis tools for deeper market insight. Trading and position management are handled directly from the chart through an integrated trade management panel , while Market Replay and Virtual Accounts provide environments for practicing trading skills and
The News Filter MT5
Leolouiski Gan
4.78 (23)
这个产品在新闻时间过滤所有的专家顾问和手动图表,因此您不必担心突然的价格波动会破坏您的手动交易设置或其他专家顾问输入的交易。此产品还带有完整的订单管理系统,可在任何新闻发布前处理您的持仓和挂单。一旦您购买了   The News Filter ,您将不再需要依赖以后的专家顾问内置的新闻过滤器,因为这个产品可以从此过滤它们所有。 新闻选择 新闻来源于Forex Factory的经济日历。 选择可以基于任何一种货币,如USD,EUR,GBP,JPY,AUD,CAD,CHF,NZD和CNY等。 选择也可以基于关键识别,例如Non-Farm (NFP),FOMC,CPI等。 能够选择新闻影响级别的筛选,从低、中、到高影响。 自动模式只选择与图表相关的新闻。 新闻来源每小时自动刷新,以确保最新的新闻数据。 为每个新闻影响级别提供单独的输入,以确定您要过滤掉的新闻发布前后的分钟数。 订单管理选项 在新闻发布前关闭未平仓头寸的选项,并在新闻发布后恢复它们。 在新闻发布前删除挂单的选项,并在新闻发布后恢复它们。 在新闻发布前移除止损和止盈水平的选项,并在新闻发布后恢复它们。 在新闻发布前移动止损和
YuClusters
Yury Kulikov
4.93 (43)
Attention: You can view the program operation in the free version  YuClusters DEMO .  YuClusters is a professional market analysis system. The trader has unique opportunities to analyze the flow of orders, trade volumes, price movements using various charts, profiles, indicators, and graphical objects. YuClusters operates on data based on Time&Sales or ticks information, depending on what is available in the quotes of a financial instrument. YuClusters allows you to build graphs by combining da
Chart Copilot
George Angelo Boutselis
Chart Copilot 是一款交易助手,旨在帮助交易者更快地下单、管理持仓并直接从图表设置各种类型的提醒。所有这些功能都可以通过图形面板以及对话式聊天机器人访问。 其他资料和说明: 试用版  - 设置说明 聊天机器人 Chart Copilot 配备专用服务器,运行着大型语言模型——这意味着您无需创建自己的 API 密钥,安装后即可立即与聊天机器人交互。 Chart Copilot 与您熟悉的普通聊天机器人不同,它可以直接执行与您的交易相关的操作。您可以尝试询问以下几个问题: 在任何可能影响当前图表波动性的新闻事件发生前 30 分钟提醒我 查看我的历史交易并告诉我如何改进 在我的图表上找到支撑位和阻力位,并在价格突破这些水平时提醒我 在昨天价格区间的最高点设置买入止损订单,止损设在最低点。承担账户 1% 的风险 将所有持仓调整至盈亏平衡点 然而,灵活性没有上限。我鼓励用户提出更具挑战性的需求。其他一些功能包括将您的历史交易导出为 CSV 文件(您也可以仅请求买入交易,或特定交易品种等)。或者咨询技术分析——聊天机器人可以访问所有可用的 MT5 指标。 图形面板 如果您更喜欢传统的交
Uber Trade Manager
Meelis Hynninen
4.88 (16)
UTM Manager 是一款直观且易于使用的工具,可提供快速高效的交易执行。其中一项突出的功能是“忽略价差”模式,该模式使您能够以蜡烛的价格进行交易,完全忽略价差(例如,允许在 LTF 上交易更高价差的货币对,避免因价差而退出交易)。 UTM Manager 的另一个关键方面是其独特的本地交易复印机,允许在每个经纪商中灵活地运行不同的交易策略和设置,例如不同的 TP、BE 和风险规则。 交易执行: 快速高效的交易执行:通过点击图表上的入场价格和止损价格或使用一键固定止损尺寸功能轻松进入交易。 自动手数计算:根据预定义的风险设置计算手数,当通过拖动修改仓位时会重新计算手数。 能够同时处理一个或多个职位。 止盈和盈亏平衡: 灵活的止盈设置:通过特定的风险回报 (RR) 比率设置灵活的部分止盈水平。 可配置的自动盈亏平衡功能:当达到一定的利润水平时,将止损移至盈亏平衡点。 用户友好的界面: 用户友好的图形界面 (GUI),可轻松保存和加载设置。 内置帮助工具提示来解释其他功能。 职位定制: 仓位定制和调整:经理将所有仓位绘制在图表上,通过拖动线条即可轻松定制和调整。 图表上的按钮: 图表
筛选:
无评论
回复评论