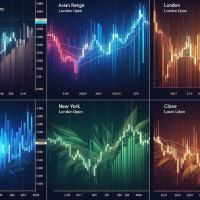
B4S ICT Historical OHLC Lines

Brief Description:

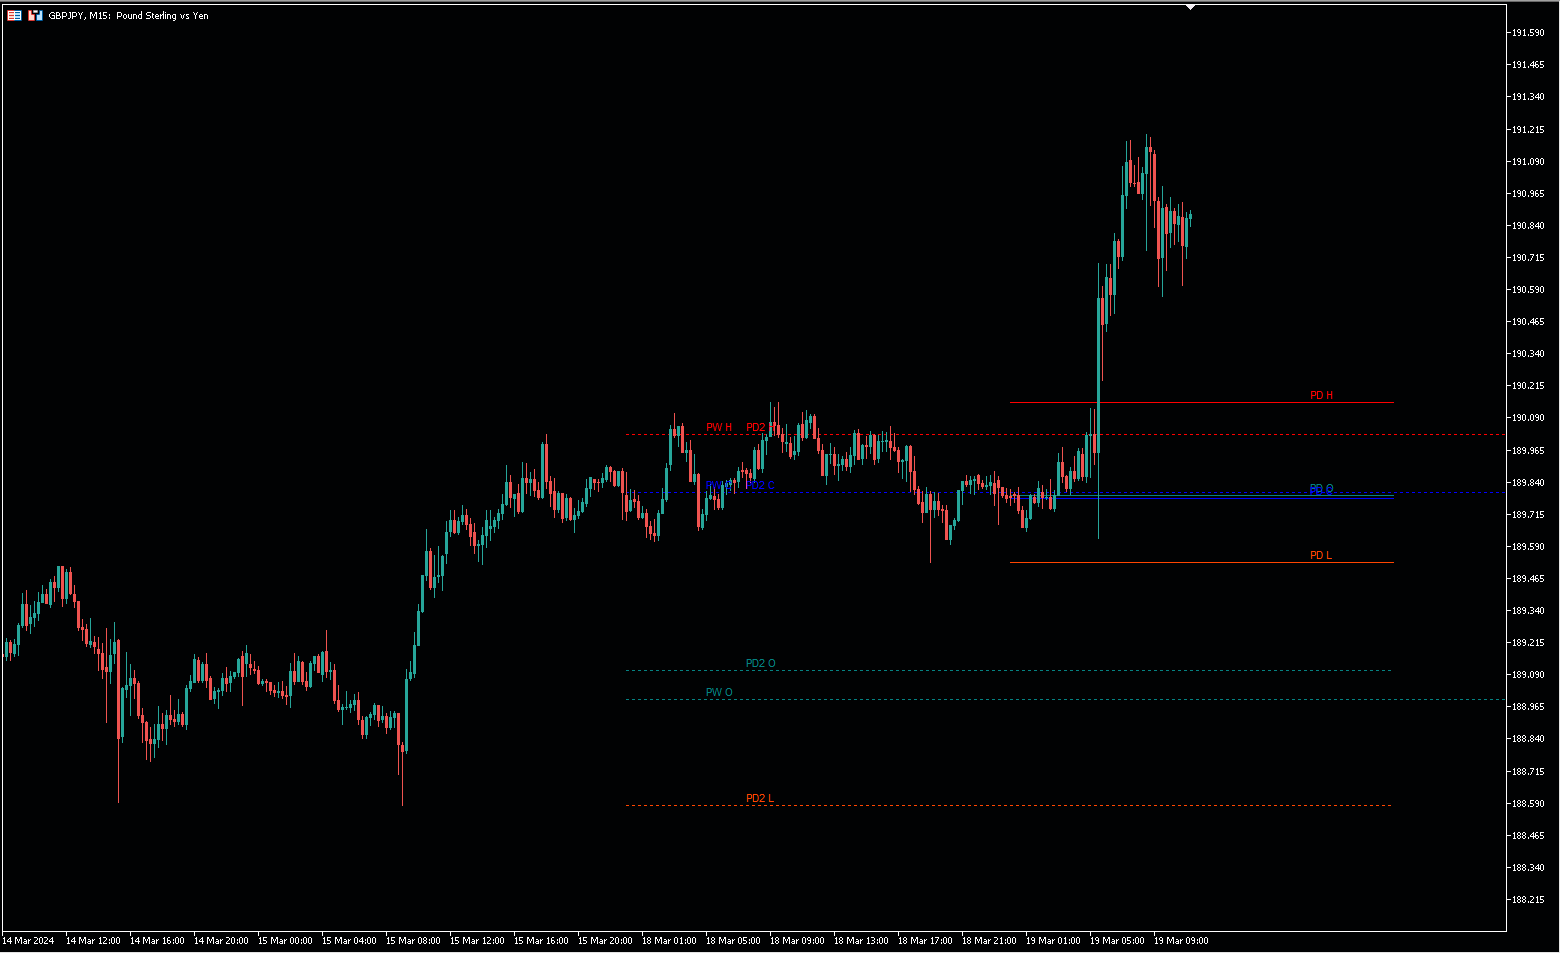
A tool to display historical Open, High, Low, and Close (OHLC) price points for various time periods. Gain insights into market behavior with data from yesterday, the day before, the previous week, and the previous month. Recognize liquidity zones effectively.

Features:

1. Comprehensive Timeframe Insights:

  • Visualize crucial OHLC points for different timeframes.
  • Historical data for yesterday, day before yesterday, previous week, and previous month.

2. Built on ICT's Teachings:

  • Aligned with Inner Circle Trader (ICT) teachings, emphasizing historical price points in predicting future movements.

3. User-friendly Customization:

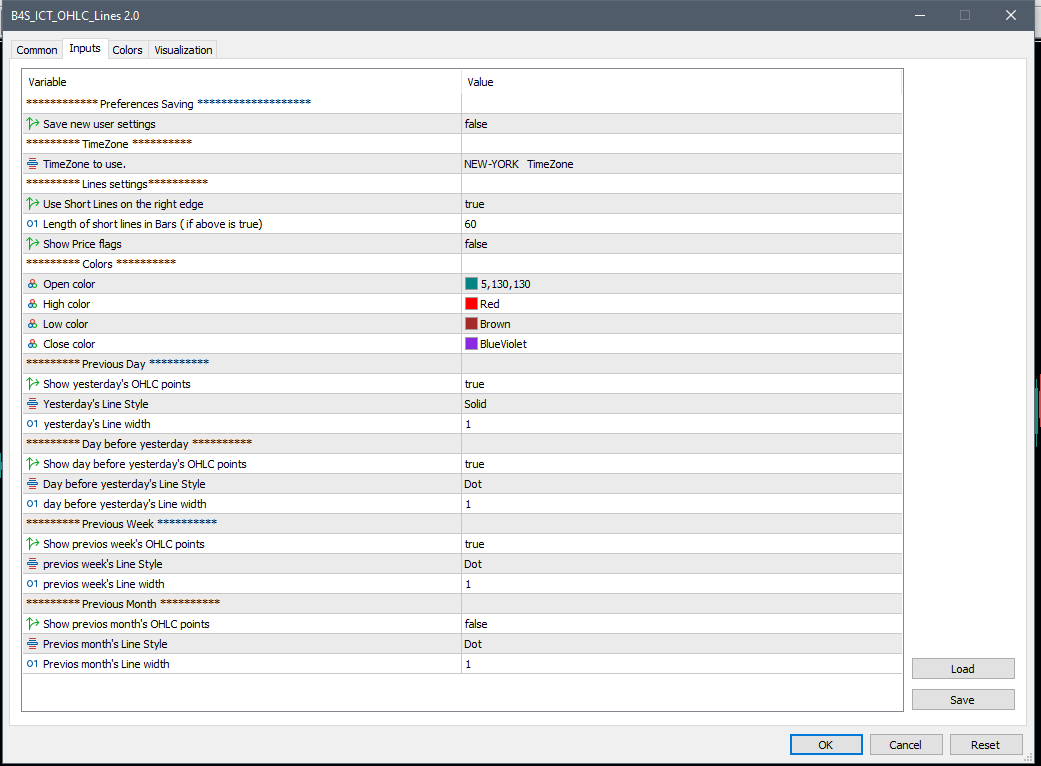
  • Customize visibility for each timeframe.
  • Choose from various line styles, widths, and colors.

4. Persistent User Settings:

  • Set configurations once; they persist through restarts.
  • Modify settings with a simple Boolean toggle.

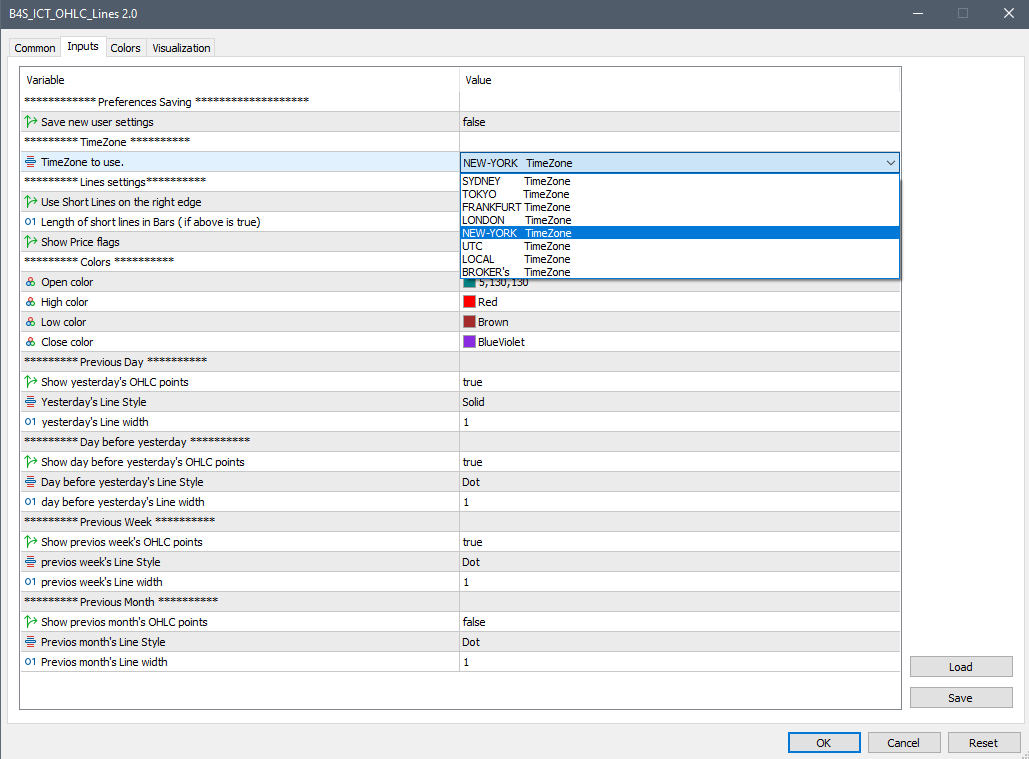
5. Enhanced Time Zone Flexibility:

  • Select the time zone for OHLC calculations, rather than defaulting to the local time zone.

6. Neat and Clutter-Free Display:

  • Option to draw shorter lines to the right edge of the chart, reducing clutter and making the chart neater.

Using Historical OHLC Levels to understand Market Liquidity:

  • Liquidity at Key Levels: Historical OHLC levels are key levels where market participants have shown interest.
  • Price Attraction to Historical Zones: Price gravitates towards these historical levels due to liquidity presence.
  • Stop-Loss and Take-Profit Zones: Traders set orders around historical OHLC levels, leading to increased activity.
  • Institutional Trading Strategies: Institutional traders use historical levels as decision-making reference points.
  • Confirmation of Breakouts and Reversals: Significant movements often occur near historical OHLC levels.
  • Enhanced Predictive Analysis: Incorporating liquidity zones into technical analysis enhances predictive power.
  • Risk Management Considerations: Identifying liquidity zones helps in effective risk management.
  • Adaptability to Current Market Conditions: Understanding historical zones helps adapt strategies to current conditions.

Related Topics:

  1. B4S
  2. B4S Indicator
  3. #ICT (Inner Circle Trader)
  4. #Market Liquidity Zones
  5. #Historical Price Analysis
  6. #Key OHLC Levels
  7. #Price Reactions to Historical Zones
  8. #Predictive Analysis with OHLC Data
  9. #Institutional Trading Techniques
  10. #OHLC Breakout Confirmation
  11. #Risk Management around OHLC Zones
  12. #Adaptive Trading Strategies
  13. #MetaTrader 5 Indicator Insights
  14. #Technical Analysis Tools
  15. #Price Behavior Patterns
  16. #Market Sentiment and OHLC Levels
  17. #Price Gravity and Liquidity Zones
  18. #OHLC Support and Resistance Levels
  19. #Market Depth Analysis with OHLC Data
  20. #Price Action Strategies with Historical Levels
  21. #Trading Psychology around OHLC Zones
  22. #Price Volatility and OHLC Patterns
  23. #OHLC Trend Identification Techniques
  24. #Timeframe Analysis for Price Prediction
  25. #Price Manipulation and OHLC Levels
  26. #OHLC Scalping Techniques
  27. #Swing Trading with Historical OHLC Points
  28. #Price Consolidation Patterns and OHLC Zones
  29. #OHLC Breakout
推荐产品
Two Pole Oscilator
Mohammad Taher Halimi Tabrizi
Category: Oscillator Indicator Platform: MetaTrader 5 Type: Entry Indicator Timeframes: All Trader Styles: Scalping, Day Trading, Swing Trading, Binary Options Markets: All Description The Two-Pole Oscillator is an analytical tool based on deviation calculations and a two-pole smoothing filter. It is designed to highlight momentum conditions and potential trading signals while filtering out short-term noise. Main features: Two-Pole Filtering – Reduces chart noise for smoother oscillator curves.
一目了然,即刻掌握图表关键! 本指标可自动绘制价格近期反弹或突破的关键水平,为您提供客观的支撑和阻力区域,无需手动绘制。只需将其附加到图表,即可查看各时间周期的前期高低点。 各条线代表的含义: Previous Month High ‣ 上月最高价:前一个月周期内的最高成交价。 Previous Month Low ‣ 上月最低价:前一个月周期内的最低成交价。 Previous Week High ‣ 上周最高价:前一个周周期内的最高成交价。 Previous Week Low ‣ 上周最低价:前一个周周期内的最低成交价。 Previous Day High ‣ 前一日最高价:上一交易日内的最高成交价。 Previous Day Low ‣ 前一日最低价:上一交易日内的最低成交价。 为什么必备: 一打开图表,即可捕捉 反弹 和 突破 信号。 在历史验证水平处设置 止盈 和 止损 。 SMC 与 ICT 策略的核心工具 ,优化依据高级市场结构的进出场。 兼容任意交易方法:剥头皮、波段、Wyckoff、价格行为等。 操作简便:可开关各级别,灵活自定义颜色与线宽。
"Battles between bulls and bears continue to influence price development long after the combat has ended, leaving behind a messy field that observant technicians can use to manage risk and find opportunities. Apply "trend mirror" analysis to examine these volatile areas, looking for past action to impact the current trend when price turns and crosses those boundaries." RSI Mirrors and Reflections is a robust technique using multiple RSI periods, mirrors and reflections based on RSI values to ind
KT Displaced Moving Averages MT5
KEENBASE SOFTWARE SOLUTIONS
KT DMA is a modified and advanced version of the classic Displaced Moving Averages with buy/sell crossover alerts and a Multi-Timeframe scanner that shows DMA's direction across each real-time time frame. A Displaced Moving Average is a simple moving average that moves ahead or backward in a time frame (either short-term or long-term). It also allows you to predict price movement more accurately. Features Depicts the trend direction using the alignment of three moving averages. Buy/Sell signals
Best trending
Minh Tuan Le
ARIPoint is a powerful trading tool designed to generate high-probability entry signals with dynamic TP/SL/DP levels based on price volatility. The integrated performance tracking function displays win/loss statistics, number of PP1/PP2 hits, and success rate, all updated in real time. Key Features: Buy/sell signals with adaptive volatility range Real-time TP/SL/DP levels based on ATR Integrated MA filter with ATR/StdDev volatility option. Performance statistics table (Success, Profit/Loss,
Product Name: FXmans Pro SMC Structure Description: Navigate the markets with institutional precision. FXmans Pro SMC Structure is an advanced, algorithmically optimized indicator designed to decode Smart Money Concepts (SMC) directly on your chart. Built on a highly secure and lightweight engine, this tool avoids the lag of standard pivot points by utilizing Bill Williams' Fractal logic for laser-accurate market structure mapping. Whether you are a day trader or a swing trader, this indicator f
Ultimate World Clock
Mehdi Ghorbani Saeidian
Every Trader trades in a market zone. If you are not living in the time zone you are trading, you need a clock to show you what time it is in your favorite time zone, and it should be small at the same time to not interrupt your trading process.  In this small indicator, you have access to 3 major clocks around the world, and you can easily look at them. We have some other products that I am sure will help you with your trading career. Please have a look at the link: LINK our all-in-one trading
Bos Choch Structure Detector
Segun Wonderfu Aladejana
BOS CHOCH STRUCTURE DETECTOR BOS CHOCH STRUCTURE DETECTOR 是一款适用于 MetaTrader 5 的市场结构指标,用于在图表上识别并直观显示 Break of Structure(BOS,结构突破)和 Change of Character(CHoCH,特征改变)事件。 该指标通过可调节的 Swing Lookback 周期识别摆动高点和摆动低点,并监测后续K线的收盘价是否突破这些结构水平。 当检测到结构突破时,指标会从被突破的摆动水平位置向突破K线绘制水平结构线,并在图表上显示 BOS 或 CHoCH 标签。 主要功能 • 检测看涨 BOS • 检测看跌 BOS • 检测看涨 CHoCH • 检测看跌 CHoCH • 可调节的摆动结构检测 • 看涨和看跌 BOS 使用独立颜色 • 看涨和看跌 CHoCH 使用独立颜色 • 可调节结构线宽度 • 可调节结构线样式 • 可调节标签字体大小 • 自动显示 BOS/CHoCH 标签 • 简洁的图表视觉显示 • 专为 MetaTrader 5 设计 工作原理 指标首先根据所选择的 Swi
这种多时间框架和多品种背离仪表板指示器会在在多个时间框架上而不是在单个背离上识别出一个或两个不同的背离时发送警报。它可以用于从 M1 到 MN 的所有时间范围。仪表板中最多可以同时显示 9 个时间范围。可以启用移动平均线、RSI 或布林带趋势过滤器以仅过滤掉最强的设置。结合您自己的规则和技术,该指标将允许您创建(或增强)您自己的强大系统。 特征 可以检测以下振荡器/指标的背离:MACD、随机指标、OsMA、RSI、CCI、Awesome、OBV、ADX、ATR、MFI、动量和加速器。 最多可以选择 9 个要使用的时间范围。 在仪表板内持续执行发散等级排序。 通过在矩形内单击,将打开一个带有相关交易品种和时间范围的新图表。 指标可以将信号写入全局变量,智能交易系统可以使用这些变量进行自动交易。比如 这个产品 。 将指标放在一张图表上就足够了,您将收到来自您选择的任何交易品种的警报。 常规/经典(趋势逆转)和隐藏(趋势延续)背离都将被考虑在内。因此,可能会出现常规背离,同时在另一个时间范围内出现隐藏背离。请参阅下面的屏幕截图 #3。该示例显示了与 2 个指标的背离,但也可能来自同一个指标。
Titan Fibonacci Levels
Bruno Rodrigues Paes Dourado Da Silva
Titan Fibonacci Levels The Titan Fibonacci Levels indicator creates a highly accurate market level structure, allowing you to identify potential zones of reversal, continuation and movement targets. Indicator concept The calculation is based on three main elements: Opening of the period (Opening Pivot); It serves as the central point of market equilibrium; Amplitude of the previous period (Range); Calculated by the difference between High and Low of the previous period. Range Fibonacci Proje
Market Noise 市場噪音是確定價格圖表上的市場階段的指標,並且還可以在累積或派發階段發生時區分清晰平滑的趨勢運動和嘈雜的平坦運動。 每個階段都適合自己的交易類型:趨勢適合趨勢追蹤系統,平坦適合激進型交易。 當市場噪音開始時,您可以決定退出交易。 同樣,反之亦然,一旦噪音結束,您就需要關閉激進的交易系統。 有人可以使用兩種類型的交易策略進行交易,從一種策略切換到另一種策略。 因此,該指標在交易決策領域中扮演了好助手的角色。 任何價格變動都可以分為兩個部分 - 選定時間段內的總體價格變動以及該時間段內以價格波動形式出現的噪音。 同時,不同時期的不同市場可以表現出噪音和趨勢成分之間廣泛的相互關係(圖1)。 價格變動的噪音水平越高,辨別潛在趨勢的方向和強度就越困難。 因此,在這種情況下有必要使用較慢的趨勢識別方法。 另一方面,在低噪音水平的市場中,主要趨勢很容易確定,並且更快的確定趨勢的方法是合理的,確保價格方向變化的交易訊號的滯後最小。 為了確定市場狀態,使用高級效率比 (ER),該比率基於特定時期內總價格變動與噪音市場變動總和的指數比較。效率比 (ER) 可以變化從0到1。當
MQL5 博客: https://www.mql5.com/en/blogs/post/772475 MT4 版本: https://www.mql5.com/en/market/product/170048 MT5 版本: https://www.mql5.com/en/market/product/170049 谐波形态指标 [tambangEA] 是一款专业的 MetaTrader 5 谐波形态指标,旨在利用已确认的枢轴点和斐波那契比率验证来识别潜在的市场反转结构。 该指标可自动检测谐波形态并将其直接显示在图表上,计算可能的入场点、止损点、止盈点和风险回报比,并通过现代化的交互式仪表盘呈现所有重要信息。 它适用于外汇、黄金、指数、加密货币以及MetaTrader 5平台上的其他交易品种。 支持的谐波形态 该指标可以检测: 加特利形态 蝙蝠形态 蝴蝶形态 螃蟹形态 鲨鱼形态 ABCD形态 形态验证基于斐波那契比率范围,而非单一固定比率,从而在保持可配置容差的同时,实现更真实的谐波形态识别。 主要功能 自动谐波形态检测 该指标基于已确认的摆动点自动识别看
Market Structure Break and Order Block
Mohammad Taher Halimi Tabrizi
Market Structure Break & Order Block (MSB-OB) The Market Structure Break & Order Block (MSB-OB) indicator is built to analyze price structure, highlight market structure breaks, and mark order block zones. It also provides buffers for Buy/Sell signals and MSB detection, making it suitable for both manual analysis and automated strategies. A tester panel is included to evaluate performance under different conditions in the Strategy Tester. Main Concept Market Structure Break (MSB): Occurs after
Infinity Liquidity - Premium MT5 Liquidity Sweep & Smart Money Indicator Infinity Liquidity is a premium MetaTrader 5 liquidity indicator designed for traders who want a cleaner, smarter, and more professional way to read market structure, liquidity sweeps, smart money zones, buy and sell opportunities, volatility conditions, and high-probability trading areas directly on the MT5 chart. This indicator is built for traders who trade forex, gold, XAUUSD, indices, crypto, commodities, and other liq
Harmonic Pro
Kambiz Shahriarynasab
Only 5 copies of the EA at $30! Next price --> $45 Find charts and signals based on harmonic patterns, which work great in 1-hour timeframes and up. Buy and sell signs based on different harmonic patterns as follows: 0: ABC_D 1: ABCD_E 2: 3Drive 3: 5_0 4: Gartley 5: Bat 6: Crab 7: Butterfly 8: Cypher 9: NenStar 10: Shark 11: AntiBat 12: AntiGartley 13: AntiCrab 14: AntiButterfly 15: AntiCypher 16: AntiNenStar 17: AntiShark How to use: When there is an opportunity to buy or sell, you have 5:
Trend Arrow Filters
Aleksandr Bernes
Trend Arrow Filters Filtered closed-bar trend arrows for MetaTrader 5. Paid upgrade of free Trend Arrow NR. Price: $30 (unlimited) Free companion: https://www.mql5.com/en/market/product/188166 1. What it does Same core idea as free Trend Arrow NR (EMA cross arrows on closed bars), plus practical filters so you see fewer, higher-context signals. 2. How signals work (non-repaint) • Arrows only on closed bars • Forming bar never paints a signal • Historical arrows do not move on new ticks • Optiona
NeuronStructure reads market structure the way a desk does and labels every event on the exact closed bar that confirmed it, so what you see now is what you would have seen then. It is an indicator for chart analysis only: it draws on the chart, it does not place, modify or close trades, it does not send orders, and it does not manage positions or accounts. It is the market-structure companion to NeuronLiquidity, built to sit alongside it: structure tells you the framework and bias, liquidity te
博客: https://www.mql5.com/en/blogs/post/769823 MT4: https://www.mql5.com/en/market/product/176181 MT5: https://www.mql5.com/en/market/product/176182 VOLUME BUBBLE [tambangEA] 是一款高级可视化成交量压力指标,旨在帮助交易者直接在图表上识别异常市场活动。 该指标可检测异常的成交量变化,并将其显示为围绕价格走势的清晰气泡标记。每个气泡代表一次成交量压力事件,使交易者能够快速查看可能出现强劲参与、不平衡、动量压力或潜在吸收的位置。 此工具专为希望快速直观地了解市场参与情况,而无需逐根K线手动分析原始成交量数据的交易者而设计。 主要概念 大多数价格图表仅显示价格走势。VOLUME BUBBLE [tambangEA] 则在此基础上增加了一个维度:市场参与。 该指标有助于解答以下重要问题: 异常成交量出现在何处? 压力是看涨还是看跌? 价格走势是否得到强劲的参与? 市场是否出现可能的吸收? 当前的活
Historical Pivot Zones - Fibonacci Indicator MT5 Automatically draws Fibonacci retracement and projection zones based on historical price pivots. This MT5 indicator intelligently selects pivot points from different timeframes (weekly, monthly, or 6-month ranges) and creates visual Fibonacci zones around key levels. Features include: Smart Mode Selection - Auto-adjusts based on your chart timeframe Clean Visual Zones - Highlighted areas instead of just lines Essential Fib Levels - 9 retrace
Anchored VWAP Trading Indicator Struggling to identify true market value and key support/resistance levels? The Anchored VWAP Trading Indicator helps you track price based on real traded volume, giving you a clear edge in your trading decisions. This tool allows you to anchor VWAP from any point on the chart, making it ideal for analyzing trends, reversals, and institutional activity. Key Features Anchored VWAP from any candle Accurate volume-weighted price calculation Works on all symbol
SuperDoble Suavizador
Cesar Juan Flores Navarro
SUPER DOBLE SUAVISADOR es un indicador técnico para MetaTrader 5 diseñado para suavizar el movimiento del precio y mostrar de forma más clara los cambios de tendencia. Su objetivo principal es reducir el ruido del mercado y ayudar al trader a identificar mejor los movimientos alcistas y bajistas. El indicador trabaja como una línea tipo zigzag suavizada, donde los tramos de subida se muestran en color Agua  y los tramos de bajada en color Magenta , facilitando una lectura visual rápida del compo
Levels Mult OHLC
Cinthia Regina De Moraes
Considerando que os preços de OHLC de períodos anteriores são regiões importantes de negociação, criei um indicador que traça linhas de Open, High, Low e Close do dia, semana ou mês anterior no gráfico atual. Além de marcar essas regiões, linhas extras foram inseridas como opção que marcam os MEIOS (50%) dessas regiões e uma linha que marca a ABERTURA do dia. O usuário pode configurar a exibição das linhas que achar mais expressivas. Configurações: PERIOD RANGE Timeframe = Período de referência
SupportResistence
Eduardo Borges Mariani
SupportResistance是一个动态支 撑和阻力指标,基于先前蜡烛的高点和低点。 计算参数是可配置的。 您可以使用前一支蜡烛的最大值和最小值作为参考,也可以使用一组前一支蜡烛的最大值和最小值。 指标使用红线表示阻力,绿线表示支撑。 当支撑或阻力破损时,其线将被点缀,仅在再次变得相关时才恢复。 支撑或阻力突破后,一旦到达相反的线,便会在最后一个有效值处找到新的支撑或阻力。 在历史最高或最低的情况下,将没有有效的支撑线或阻力线。 SupportResistance是一个动态支 撑和阻力指标,基于先前蜡烛的高点和低点。 计算参数是可配置的。 您可以使用前一支蜡烛的最大值和最小值作为参考,也可以使用一组前一支蜡烛的最大值和最小值。 指标使用红线表示阻力,绿线表示支撑。 当支撑或阻力破损时,其线将被点缀,仅在再次变得相关时才恢复。 支撑或阻力突破后,一旦到达相反的线,便会在最后一个有效值处找到新的支撑或阻力。 在历史最高或最低的情况下,将没有有效的支撑线或阻力线。
Utilities
Douglas Lucio De Araujo
Indicator with 3 features - Clock : Clock independent of the chart, counting continues even when the market is closed. - Template : After setting up a configuration in any graphic, be it color patterns, indicators, zoom ... The configuration will be copied to all active graphics. - TimeFrame : Set the TimeFrame on a chart, and with just one click all the active charts will be changed to the same TimeFrame.
MQL5 博客: https://www.mql5.com/en/blogs/post/768823 MT4 版本: https://www.mql5.com/en/market/product/171247 MT5 版本: https://www.mql5.com/en/market/product/171248 斐波那契投影 [tambangEA] 是一款专业的仪表盘式交易分析工具,旨在帮助交易者直接在图表上识别市场结构、斐波那契投影目标、成交量反应区和方向延续区域。 该工具可自动检测最新的波动结构,构建基于斐波那契的投影水平,突出显示控制点区域,并显示斐波那契带的增量信息。它专为希望以清晰、结构化和可视化的方式解读市场走势,而无需手动绘制每个斐波那契投影的交易者而设计。 此工具的创建原因 许多交易者会手动使用斐波那契水平线,但手动预测可能速度较慢、结果不稳定且主观性较强。 此工具通过自动显示以下内容来简化流程: 最新的波动结构 斐波那契回撤和预测水平线 0.618 区域的 C 点预测 T1、T2 和 T3 目标区域 POC 和成交量分布区域 基于斐波那
Candle Good Setup
Kibalo Alain Kabissa
You ask yourself the question every time you open your charts: how to win in trading? Will using a lot of indicators work? well know that I also asked myself the same questions when I first started trading. After testing many indicators, I realized that winning trading is simple and accurate trading. after several months of thinking and optimizing I was able to find my solution: Candle Good Setup Candle Good setup is a trend and entry timing indicator analyzing the market in multi-frame to give
这个多时间框架和多品种指标扫描 Pin bar、晨星/晚星、吞没、镊子、三线罢工、内线和三角旗。 该指标也可用于单一图表模式。请在产品的     博客 。     结合您自己的规则和技术,该指标将允许您创建(或增强)您自己的强大系统。 特征 可以同时监控您的市场报价窗口中可见的所有交易品种。将该指标仅应用于一张图表,并立即监控整个市场。 监控从 M1 到 MN 的每个时间范围,并在识别出模式时向您发送实时警报(弹出、推送或邮件)。 可以使用 RSI 和布林带作为 pin bar、晨星/晚星 、吞没和镊子形态的 过滤器,以便正确识别潜在的逆转。 可以使用移动平均线作为主要趋势过滤器,使用 ADX 作为波动率过滤器。 该指示器包括一个交互式面板。当单击一个项目时,将打开一个带有相关代码和时间范围的新图表。 该指标可以将信号写入一个文件,EA 可以使用该文件进行自动交易。比如 这个产品 。 Pennant 和三角形扫描可识别高概率的突破模式。它通过识别强大的、对称的三角旗和三角形来做到这一点。这种模式在更高的时间范围内不会经常出现。但是当它发生时,这是一个非常高概率的设置。请参见     截
Veltrion Smart Fibonacci   is a clean automatic Fibonacci structure overlay for MetaTrader 5. It automatically detects recent swing highs and swing lows, then draws key Fibonacci retracement levels directly on the chart. The indicator is designed to help traders visualize market structure, retracement zones, and the golden zone without manually drawing Fibonacci tools. Key Features Automatic swing high and swing low detection Clean Fibonacci retracement overlay Horizontal Fibonacci levels for a
MQL5 博客: https://www.mql5.com/en/blogs/post/772035 MT4 版本: https://www.mql5.com/en/market/product/183506 MT5 版本: https://www.mql5.com/en/market/product/183507 LIQUIDITY MAGNET [tambangEA] 是一款专业的供需可视化指标,旨在帮助交易者识别高质量的流动性区域,监控区域强度,并解读对立市场区域之间潜在的方向性“磁力”。 该指标将重要的日内供需区域直接映射到图表上,根据反应质量对每个区域进行评分,并显示一个简洁的仪表盘,其中包含区域状态、价格范围、评分、新鲜度、失效状态和当前磁力方向。 此工具旨在辅助手动决策,不会自动开仓、平仓或管理交易。 关键概念 市场通常会在机构流动性、止损单、挂单和先前反应区域集中的区域附近做出反应。 流动性磁力指标 [tambangEA] 通过识别强劲的供需区域,并显示从一个强劲区域到另一个强劲区域的可能拉动路径,帮助交易者可视化这些区域。 “磁力”功能并非保证预测
All in One Multi Indicator
Teerathad Booranawisedkul
Overview Comprehensive technical analysis indicator combining 20+ essential trading tools in a single chart display. Moving Averages EMA (Exponential Moving Average): 9, 21, 50, 200 periods SMA (Simple Moving Average): configurable period Customizable colors and line widths Price position indicators (above/below) Oscillators & Momentum RSI (Relative Strength Index): adjustable overbought/oversold levels MACD (Moving Average Convergence Divergence): customizable fast/slow/signal periods Stochasti
该产品的买家也购买
Trend Sniper X
Sarvarbek Abduvoxobov
4.9 (40)
Trend Sniper X 是一款适用于 MetaTrader 5 的多周期趋势跟踪指标,可帮助交易者清晰精准地识别趋势方向和潜在的反转点。 适用于 MT4: https://www.mql5.com/en/market/product/193245 价格信息: 当前价格为促销价,随着后续更新和新功能的推出,价格可能会有所变动。 赠品优惠: 购买后联系作者,即可免费获取该指标的 Auto-Trade Assistant EA(自动交易助手 EA)。 Code2Profit 频道 通过多时间框架分析掌控市场! 如何使用 Trend Sniper X 最大化您的胜率:核心规则与交易时段技巧 技术规格 平台 MetaTrader 5 指标类型 多时间周期趋势指标 运行时间周期 任何图表时间周期,可独立选择更高的时间周期 (M1–MN1) 主要交易品种 外汇、黄金 (XAUUSD) 及其他差价合约 (CFD) 推荐账户 任何账户类型 可视化 彩色趋势蜡烛 (买入/卖出/微弱/变化) + 买入/卖出箭头 附加模块 交易时段方框 (悉尼、东京、伦敦、纽约) 主要功能 多时间周期趋势分析: 直接在
Smart Trend Trading System — MetaTrader 5 购买后,请在 MQL5 上给我发消息,即可免费获得 Smart Universal Expert Advisor,以及在线课程、PDF 手册和私人群组访问权限。 STTS 将趋势方向、入场和出场信号、反转区域及重要价格水平集中呈现在图表上。您可以根据系统手动交易,也可以连接单独的兼容 EA,按照您选择的设置自动执行交易。 一套系统,四种交易思路 STTS 将交易方法分为四大类: • 剥头皮交易 — 跟踪短期信号和市场波动。 • 趋势交易 — 评估方向,寻找趋势中的交易机会。 • 反转交易 — 识别潜在的转折区域和方向变化。 • 成交量交易 — 利用成交量相关信息评估市场活跃程度。 入场和出场箭头、趋势信息、支撑与阻力位及反转区域,帮助您直接在图表上分析交易形态。 先从一种方法开始。了解其信号和设置后,再探索其他方法。 从信号到自动化 Smart Universal Expert Advisor 可连接 STTS,让您自动执行受支持的交易信号。 启用自动交易前,请配置指标连接、仓位大小和交易管理设置
Zoryk Gold
Reda El Koutbane
5 (15)
折扣将在 24 小时后结束——下一价格为 69 美元 ZORYK — MetaTrader 5 专用高级 XAUUSD 黄金信号系统 你一定熟悉这种感觉。 你花了很多时间分析黄金,等待合适的入场机会。终于开仓后,价格却立刻朝相反方向移动。你过早平仓、移动止损,或者只犹豫了几秒钟。随后,市场却在没有你的情况下到达了你原本预期的目标。 问题并不总是方向判断错误。 真正的问题是缺乏确定性。 你不知道准确的入场位置在哪里。 你不知道什么时候交易逻辑已经失效。 你不知道应该先锁定较近的利润,还是继续等待更大的行情。 你也不知道当前信号是否足够强,还是自己只是在强行寻找交易机会。 黄金市场变化非常快。一个没有明确计划的好想法,可能在几秒钟内变成错误的交易决定。 ZORYK 正是为了解决这个问题而开发。 什么是 ZORYK ZORYK 是一套完整的 XAUUSD 黄金信号与交易计划系统,专门为 MetaTrader 5  和 M5 时间周期 开发。 它不是一个只显示 BUY 或 SELL 箭头,然后让你独自决定其余所有内容的简单指标。 每个确认后的信号都可以在图表上显示完整的可视化交易计划,包
SuperScalp Pro
Van Minh Nguyen
4.66 (35)
SuperScalp Pro - Professional Multi-Layer Confluence Scalping System SuperScalp Pro 是一款高级剥头皮交易指标,在经典 Supertrend 的基础上加入了多个智能确认过滤器。它可以帮助您识别概率更高的 Buy/Sell 交易机会,同时显著减少虚假信号。 清晰的 Buy 和 Sell 箭头会直接显示在图表上,基于 ATR 的 Stop Loss 和 Take Profit 水平会实时自动计算。 购买后,请联系我获取设置指导和推荐配置。 使用 SuperScalp Pro Auto Trader 轻松实现信号自动化: [Auto Trader] 下载推荐设置文件: [Set File] 完整文档请参阅产品博客: [User Guide] 加入官方频道获取最新更新: [Official Channel] SuperScalp Pro 如何工作? 只有当多个确认层同时一致时,指标才会生成交易信号(趋势 + 动能 + 成交量 + 波动率)。 您可以手动交易,也可以连接 SuperScalp Pro Auto Tr
全新王者降临 - 指标 + 订单管理提示(TP1 + TP2 + TP3)+ 可选 Telegram 信号发送器 INCLUDED(免费) (完整交易与信号系统) 我们最强的黄金 EA: Gold Slayer 该指标包含先进的交易策略、可自定义订单管理系统,以及结合 Envelope 扩展的均值回归系统,并通过 RSI 等多重智能确认过滤器进行验证,以捕捉高概率反转入场机会,提供 BUY 与 SELL 信号。 你不仅能够学习如何交易,还能学会如何高效管理多个仓位,并利用之前盈利的持仓来覆盖亏损交易。 专为 M5 周期打造并优化,在 BTCUSD 和 XAUUSD 上表现尤为出色,因为这些市场的流动性能够让信号更加干净、可靠。 该指标会自动生成清晰的多头(Long)与空头(Short)信号,同时基于 ATR 自动计算入场位、止损位和止盈位,让风险管理从一开始就融入系统之中。 多 TP 系统设有三个渐进式目标位,你可以在 TP1 锁定部分利润、在 TP2 继续持仓,并在更大的行情中将仓位持有至 TP3,而这正是平均风险回报比真正开始大放异彩的地方。 默认参数开箱即用,已经针对稳定表现进行
SMC Intraday Formula
VividMind Digital Solutions
5 (26)
让我们先坦诚一点。 没有任何一个指标可以单独让你实现盈利。如果有人告诉你可以,那他是在向你兜售一个梦想。任何显示完美买卖箭头的指标都可以被做得看起来毫无瑕疵——只需要放大历史中的某一段并截取成功交易的截图。我们不会这样做。 SMC Intraday Formula 是一个工具。 它为你读取市场结构,标记出概率最高的价格区域,并用简单直白的语言准确告诉你当前智能资金的行为轨迹。你仍然需要做决定。你仍然需要执行交易。但现在,你是带着精确性执行,而不是靠希望。 我们已经在黄金(XAUUSD)以及主要外汇货币对的日内剥头皮交易中使用该指标将近三年。这是我们在 M1、M5、M15 和 M30 上的日常主力工具。它之所以有效,是因为它不试图预测未来——它展示的是当前正在形成的高概率交易机会,并解释 为什么 。 它与其他所有指标有什么不同? 大多数交易指标只做一件事。移动平均线交叉。振荡指标触及某个水平。出现一个箭头。你进场交易。你亏损。你责怪指标。重复。 SMC Intraday Formula 将多个机构级概念整合为一个统一的市场解读: - 斐波那契共振引擎 不只是普通的斐波那契水平——该指标
GoldenX Entry MT5
VividMind Digital Solutions
5 (16)
GoldenX Entry 是一款用于 MT5 的指标,包含自适应 Smart Entry Trend 算法、信号评分系统、市场状态识别器以及波动率过滤器。每个信号都包含计算得出的入场位、三个止盈位(TP1、TP2、TP3)以及止损位。它基于多个分析层构建,旨在适应不同市场条件,将多层分析系统与内置优化器及统计跟踪系统相结合。该指标基于风险收益比(RR)指标和历史交易行为提供量化分析。 开始使用非常简单——在所选时间周期上运行优化器,然后在图表上开始使用该指标。 核心功能 GoldenX Entry 将信号引擎与内置交易管理及历史统计跟踪整合在同一图表中: - 内置优化器: 优化器可在图表上单击运行。它通过两阶段搜索流程测试200种参数组合——先进行探索,再进行优化——并在完成后自动应用选定配置。结果会按时间周期缓存,因此当返回已优化的周期时,会立即恢复相同设置。 - 黄金品种自动周期识别: 将指标加载到任何 XAUUSD 图表(M1 到月线)。系统会自动识别当前周期并加载对应预设。共包含9个时间周期配置文件,专为黄金在标准周期上优化设计。切换周期时,参数会自动调整。 - 资金参考面
Gann Made Easy MT5
Oleg Rodin
5 (10)
Gann Made Easy   是一个专业且易于使用的外汇交易系统,它基于使用先生理论的最佳交易原则。 W.D.江恩。该指标提供准确的买入和卖出信号,包括止损和获利水平。您甚至可以使用推送通知在旅途中进行交易。 购买后请联系我,即可免费获得交易指导和超棒的额外指标! 您可能已经多次听说过江恩交易方法。通常 Gann 的理论不仅对于新手交易者而且对于那些已经有一定交易经验的人来说都是非常复杂的东西。这是因为江恩的交易方法在理论上并不那么容易应用。我花了几年时间来完善这些知识,并将最好的原则应用到我的外汇指标中。 该指标非常易于应用。您所需要的只是将其附加到您的图表并遵循简单的交易建议。该指标不断进行市场分析工作并寻找交易机会。当它检测到一个好的入口点时,它会为您提供一个箭头信号。该指标还显示止损和获利水平。 换句话说,当您像先生一样进行交易时,该指标会为您提供最佳江恩建议。江恩亲自告诉你此时此刻该做什么。但最好的部分是您不需要了解任何有关江恩交易原则的知识,因为该指标会为您完成整个市场分析工作。
Neuro Poseidon MT5
Daria Rezueva
4.75 (52)
Neuro Poseidon is a new indicator by Daria Rezueva. It combines precise trading signals with adaptive TP/SL levels - creating best possible trades as a result! Message me and get  Neuro Poseidon Assistant  as a gift to automize your trading process! What makes it stand out? 1. Proven profitability on all assets and timeframes 2. Only confirmed BUY and SELL signals present on the chart 3. Adaptive TP & SL levels generated by the software for each trade 4. Easy to understand - suitable for al
Entry Points Pro for MT5
Yury Orlov
4.52 (151)
传奇回归:Entry Points Pro 10。 这款传奇指标曾 3 年稳居 MQL5 Market 前三,如今全面重启。 数百条热情好评(两个版本合计 589 条),每天有数千名交易者用它交易,演示版下载 31,000+   MT4+MT5  次。 五年来我读过你们的每一条评价——在第 10 版里,我没有给出许诺,而是把答案直接做进了产品。指标作者自 1999 年入市, 珍视诚信、自己的声誉和自己的客户 。 Entry Points Pro 给出的入场信号严格不重绘。 而且这一次不再只是作者的一面之词,而是可验证的事实:确认信号只在 K 线收盘后标出,自动化测试记录到 零重绘 (在 EURUSD、XAUUSD 和 BTCUSD 上共 2,486,568 次不变量检查——0 次违规)。测试方法完全公开——您可以在策略测试器中自行复现。 购买后请务必第一时间给我发私信。 我会发给您 扩展版说明书《交易者圣经》 ——使用本指标交易的完整指南——并告诉您如何免费获得 赠品:市场扫描器 ,它能同时分析多个品种和多个时间周期,并在一个界面上显示 Entry Points Pro 此刻在哪里表现
ARIPoint
Temirlan Kdyrkhan
1 (4)
ARIPoint is a powerful trading companion designed to generate high-probability entry signals with dynamic TP/SL/DP levels based on volatility. Built-in performance tracking shows win/loss stats, PP1/PP2 hits, and success rates all updated live. Key Features: Buy/Sell signals with adaptive volatility bands Real-time TP/SL/DP levels based on ATR Built-in MA Filter with optional ATR/StdDev volatility Performance stats panel (Success, Profit/Loss, PP1/PP2) Alerts via popup, sound, push, or email Cu
Auto Optimized SpeedAngle 是一款机构级的动量向量化系统,通过持续的前瞻优化(Walk-Forward Optimization, WFO)彻底消除了曲线拟合(curve-fitting)。该指标没有采用在市场 状态转换时容易失效的静态输入参数,而是利用出样外验证(Out-of-Sample, OOS) dynamically 动态重新校准设置,从而确保显示的 信号代表真正的统计优势,而非历史巧合。 核心机构级架构 前瞻优化引擎(Walk-Forward Optimization Engine): 核心算法持续扫描数千种回溯周期(lookback)与阈值组合,严格将数据划分为样本内(in-sample)和样本外(out-of-sample)。只有当参数配置在未知数据环境中证明具备数学优越性时,系统才会对其进行 adoption。 量化目标函数(Quantitative Objective Functions): 优化引擎不一味追求绝对毛利,而是聚焦于机构级的稳定性指标。用户可针对系统质量数(SQN)、期望值(每笔交易的平均 R 倍数)或净 R 值进行优化,从而优
Welcome to ENTRY IN THE ZONE AND SMC MULTI TIMEFRAME  SPECIAL BENEFIT / FOR OUR MQL5 CUSTOMERS FREE ACCESS TO THE NEW TOOL  — COMING SOON — Learn more on our official website  : https://www.fableedge.net Entry In The Zone and SMC Multi Timeframe is a real-time market analysis tool based on Smart Money Concepts (SMC) , designed to analyze market structure, price direction, and key trading zones. It supports both Single-Timeframe and Multi-Timeframe Analysis , providing a clearer view of overall m
Unix Scalper
Issam Kassas
4 (4)
Unix Scalper — MetaTrader 5 购买后,请在 MQL5 上给我发消息,即可免费获得 Smart Universal Expert Advisor,以及在线课程、PDF 手册和私人群组访问权限。 发现交易形态,看清交易计划,选择执行方式。 UNIX Scalper 将市场分析、BUY/SELL/WAIT 决策以及 Entry、Stop Loss、TP1 和 TP2 水平集中在一个清晰的面板中。 看清信号与交易计划 • 明确的决策:BUY、SELL 或 WAIT。 • 明确的价格水平:Entry、Stop Loss、TP1 和 TP2。 • 多时间周期概览:比较面板中各时间周期的信号。 • 辅助分析:趋势、动量、成交量、波动率、支撑与阻力,以及市场质量。 • 灵活的布局:Minimized、Compact、Standard 或 Full。 查看信号,检查价格水平,再判断该交易形态是否符合您的交易规则。 从黄金和比特币开始 建议首先使用的交易品种:XAUUSD 和 BTCUSD。 探索短期剥头皮交易和较高时间周期分析。选择历史K线范围,通过表现曲线查看所选设置
FiboSniper Pro
Van Minh Nguyen
5 (3)
FiboSniper Pro – Multi-Filter Fibonacci System with Auto SL/TP and Control Panel FiboSniper Pro 是一款技术指标,将动态 Fibonacci Envelopes 与多个确认过滤器相结合,以生成经过筛选的 Buy 和 Sell 信号。Fibonacci 水平基于 Moving Average 和 ATR 计算,然后通过 ADX、EMA、RSI、ATR、Volume、Time 和 Candle 结构进行过滤。该指标直接在图表上显示基于 ATR 自动计算的 Stop Loss 和 Take Profit 水平,并提供交互式控制面板,以便快速调整参数。 购买后,请联系我以获取推荐的设置文件和详细使用说明。 使用 Auto Trader X 自动执行 FiboSniper Pro 信号: [Auto Trader X] 用户指南和设置文件: [Click here] 加入官方频道获取最新更新: [Click here] 专为偏好结构化入场和清晰风险管理的交易者设计,适用于 Gold (XAUUSD)、B
M1 Sniper MT5
Oleg Rodin
5 (7)
M1 SNIPER   是一款易于使用的交易指标系统。它是一个专为 M1 时间框架设计的箭头指标。该指标可以作为独立的系统在 M1 时间框架下进行剥头皮交易,也可以作为您现有交易系统的一部分使用。虽然该交易系统专为 M1 时间框架交易而设计,但它也可以用于其他时间框架。我最初设计此方法是为了交易 XAUUSD 和 BTCUSD。但我发现这种方法在其他市场交易中也同样有用。 指标信号既可以顺势交易,也可以逆势交易。我教授一种特殊的交易技巧,帮助您利用指标信号进行双向交易。该方法基于使用特殊的动态支撑位和阻力位区域。 购买后,您可以立即下载 M1 SNIPER 箭头指标。此外,我还为所有 M1 SNIPER 工具用户免费提供下方屏幕截图所示的 Apollo Dynamic SR 指标!这两个指标的组合可以帮助您更轻松、更准确地利用 M1 时间框架进行交易。 购买后请联系我,免费获取交易提示和奖励指标! 祝您交易成功!
让您的交易优势尽在视野之中! M5 Sniper 是 MeanFX 推出的一款全新指标。它将 精准的交易信号 与 自适应 TP/SL 水平 相结合——从而创造出最佳的统计交易机会! 每售出 5 份,价格上涨一次,下一价格为 69$ 购买后请给我发消息,以获取技巧/指南和奖励 EA 它有哪些突出优势? 经过验证的统计表现 ,适用于 Gold XAUUSD( 几乎适用于每一种资产 ,专注于掌握一个时间周期,而不是试图面面俱到却无法获得稳定的结果) 每天每个交易品种 1 至 8 笔交易 ,具有较高的胜率百分比,并让所有统计优势站在我们这一边 图表上 仅显示已确认的 BUY 和 SELL 信号 自适应 TP 和 SL 水平 ,由指标针对每笔交易生成 平均胜率 75%+ 平均 Signal Ratio 最低 1.1+ 警报 和通知也会发送至 手机 **适合 Prop Firm(资金管理公司)**的交易方式 易于理解——适合 所有经验水平 的交易者 创作者提供的个人支持 100% 不重绘、不重新绘制、不滞后 奖励自动化 Expert Advisor(EA) 背后的策略: M5 Sniper 基于
Divergence Bomber
Ihor Otkydach
4.89 (94)
购买该指标的每位用户将额外免费获得以下内容: 原创工具“Bomber Utility”,该工具会自动跟踪每一笔交易,设置止损和止盈点,并根据策略规则自动平仓; 适用于不同交易品种的指标设置文件(Set 文件); 三种不同风险模式下的 Bomber Utility 设置文件:“最低风险”、“平衡风险” 和 “观望策略”; 一套详细的 视频操作手册,帮助您快速完成安装、配置并开始使用本交易系统。 注意: 要获取以上所有赠品,请通过 MQL5 的私人消息系统联系卖家。 我为您介绍原创的自定义指标 “Divergence Bomber”(背离轰炸机),它是一套基于 MACD 背离交易策略 的“全功能”交易系统。 该技术指标的主要任务是识别 价格与 MACD 指标之间的背离,并发出交易信号(包括推送通知),指示未来价格可能的运动方向。平均而言,这些信号的准确率超过 98%。有关该指标如何工作的详细说明,请观看本页面上的视频演示。 该系统使用 止损订单 和 动态回撤平仓机制 来管理交易。 Divergence Bomber 指标的主要特点: 支持交易的品种: AUDCAD、AUDCHF、AUDS
FX Trend MT5 NG
Daniel Stein
5 (6)
FX Trend NG:新一代多市场趋势智能分析工具 概述 FX Trend NG 是一款专业的多时间周期趋势分析与市场监控工具,帮助您在几秒钟内全面了解市场结构。 无需在多个图表之间来回切换,您可以立即看到哪些品种处于趋势中、哪里动能正在减弱,以及哪些时间周期之间存在强烈共振。 限时发布优惠 – 仅需 $30(6个月) 或 $80 终身授权 即可拥有 FX Trend NG 。 已经是 Stein Investments 客户? -> 发送消息 以获取专属客户群访问权限。 需要帮助或安装指导? -> 请访问 Stein Investments 官方页面 。 1. FX Trend NG 的核心优势 三状态趋势逻辑 —— 不只是 Buy 或 Sell • 大多数指标仅显示两种状态:Buy 或 Sell。 • FX Trend NG 增加第三种状态: Fade 。 • Fade 表示趋势强度正在减弱,在完全反转之前提前发出信号。 这种结构化逻辑让您看到趋势变化过程,而不仅仅是简单方向信号。 多时间周期分析(M1 至 MN1) • 从短线交易到中长线交易全面覆盖。 • 快速识别趋势
Tokyo mt5 Indicator
Vasiliy Strukov
5 (7)
Tokyo Indicator(东京指标)直观地展示了趋势方向、潜在交易信号及市场状况。 其采用颜色编码的阶梯式趋势线,以蓝色标识看涨阶段,以洋红色标识看跌阶段。配套的方向箭头会在趋势发生变化时,标示出潜在的买入与卖出机会。 内置的综合仪表盘将当前信号、市场倾向、动能、波动率及信号质量整合于同一视图中,方便交易者在观察价格走势的同时评估指标数据,无需在不同面板间切换。 凭借清晰的图表显示和简洁的市场概览,Tokyo Indicator 支持以系统化的方式进行趋势分析与交易确认。 适用于任何时间周期及各类交易品种,尤其适合黄金交易。 购买后请立即联系我,以获取专属赠品!您可以免费获得我们的“强力支撑与趋势扫描”(Strong Support and Trend Scanner)指标,请私信我! 设置说明与使用手册请见此处。 请注意:我不会在 Telegram 上出售我的 EA 或特殊参数设置(set files);我的 EA 仅在 Mql5 平台上提供,而参数设置文件仅在我的博客(此处链接)上发布。请务必警惕诈骗,切勿从他人处购买任何参数设置! 设置 ShowHUD —— 在图表上显示
RelicusRoad Pro MT5
Relicus LLC
4.96 (24)
RelicusRoad Pro: 量化市场操作系统 终身访问限时 70% 折扣 - 加入 2,000+ 交易员社区 为什么大多数交易者即使拥有“完美”指标也会失败? 因为他们在真空中交易 单一概念 。没有背景的信号是赌博。要持续获胜,您需要 共振 (CONFLUENCE) 。 RelicusRoad Pro 不是一个简单的箭头指标。它是一个完整的 量化市场生态系统 。它描绘价格运行的“公允价值之路”,区分市场噪音和真实的结构性突破。 停止猜测。开始用机构级“路”逻辑进行交易。 核心引擎:“Road” (路) 算法 系统的核心是 Road Algo ,一个实时适应市场条件的动态波动率通道。它投射出 安全线 (平衡) 和价格可能反转的 扩展水平 。 Simple Road: 典型市场的标准结构映射。 Smooth Road: 针对震荡盘整的降噪计算。 Breakout Road: 专为识别波动率扩张和爆发性走势而调整。 1. 算法动量与确认 我们的“剥头皮箭头”不只是简单的交叉。它们利用 高阶多项式逻辑 过滤噪音,确保信号与主周期一致。我们检测动量、价格行为和 Road 结构汇聚的精确入场
Market Structure Order Block Dashboard MT5 是一款专为希望直接在图表上解读市场结构和主要价格反应区域的交易者设计的MT5指标。它结合了BOS、ChoCH、订单块(Order Blocks)、公允价值缺口(FVG)、流动性、Kill Zones、成交量分布图以及一个紧凑的面板,便于快速分析。 本指标面向使用市场结构、ICT和Smart Money概念作为决策框架的交易者。它可以帮助以更结构化的方式识别趋势延续、可能的反转、价格失衡、流动性目标和关注区域。 面向买家的资源 购买后可通过MQL5私信申请获取完整的PDF使用指南和参数配置建议。通过MQL5私信提供直接技术支持。 1.20版本带来两项重要新增: Pending BOS / Pending ChoCH 检测 和 可拖动面板 (按住面板标题栏即可将其拖动到图表任意位置,不影响图表本身)。当K线收于前一摆动点之外时,Pending Breaks 立即显示待确认的结构突破,无需等待经典的摆动确认。 重要 本产品仅为指标。它不会自动开仓、平仓或管理仓位。它不是EA(智能交易系统)。 主要功能 市场
Scalper Vault   是一个专业的剥头皮系统,为您提供成功剥头皮所需的一切。该指标是一个完整的交易系统,可供外汇和二元期权交易者使用。推荐的时间范围是 M5。 该系统为您提供趋势方向的准确箭头信号。它还为您提供顶部和底部信号以及江恩市场水平。无论您拥有何种交易经验,该系统都易于使用。您只需要遵循简单的规则并每天重复该过程。 建议将此系统用于主要货币对。感谢您的关注! 请注意,该指标在策略测试器中可能无法正常工作。因此,我建议仅在模拟或真实账户的真实交易条件下使用该系统。 指示器提供所有类型的警报,包括推送通知。 购买指标后请与我联系。我将免费与您分享我的个人交易建议和出色的奖励指标! 祝您交易愉快,盈利!
您好,交易员! 大多数散户交易者依赖于滞后的网页脚本。真正具有交易优势需要机构化的架构。 Astro AI 指标并非标准的图表叠加层。它是一个编译后的神经网络,包含两个代理,直接运行在您的终端上。 以下是该系统背后的具体技术: 1. 代理 1:分析师(图神经网络 - GNN) 市场并非孤立的价格柱;它们是相互关联的数据网络。 功能:代理 1 使用图神经网络来映射这些复杂的非线性关系。 优势:标准指标仅考虑单一的历史移动平均线,而我们的 GNN 可以实时处理深层的市场结构关系,在散户交易量发挥作用之前揭示隐藏的相关性。 2. 代理 2:执行器(近端策略优化 - PPO) 模式识别只是成功的一半。基于当前市场波动做出正确的决策,才是预测模型与滞后模型之间的区别所在。 功能:代理 2 使用 PPO(一种先进的强化学习算法)来确定最佳入场点。 优势:它持续调整交易策略,而非使用静态的“超买”或“超卖”线。它会分析当前市场状况并计算最可能的成交点。 执行桥接:通过 ONNX 集成到交易终端 如果执行速度慢,模式识别就毫无用处。我们已通过 ONNX(开放神经网络交换平台)
Adaptive Price Action Engine 买指标,免费送EA 自适应多时间框架趋势与K线形态智能分析系统 市场环境始终在变化,不同的市场阶段中,并非所有 Price Action 形态都具有相同的参考价值。 Adaptive Price Action Engine 旨在适应不断变化的市场条件,将 趋势结构、多时间框架分析、K线形态与统计优化 整合到一个统一的分析框架中。 两种自适应模式 Dual Alpha Trend Mode(双 Alpha Trend 模式) 自动搜索适合的 Alpha Trend 参数,并结合低周期与高周期市场结构,使指标能够根据近期市场行为动态调整趋势识别。 Candlestick + Alpha Mode(K线 + Alpha 模式) 将 Alpha Trend 市场状态与 22种多空K线形态 相结合。系统不会简单地对所有形态一视同仁,而是对不同的形态组合进行统计评估,并识别在特定市场环境下表现出更强历史统计特征的配置。 主要功能 趋势参数自动优化 多时间框架市场状态分析 22种多头与空头 Price Action K线形态 对数千种可能
Smart Price Action Concepts — MetaTrader 5 购买后,请在 MQL5 上给我发消息,即可免费获得 Smart Universal Expert Advisor,以及在线课程、PDF 手册和私人群组访问权限。 看清结构,识别区域,制定交易计划。 在一张清晰有序的图表中整合Smart Money Concepts(SMC)、ICT风格分析与价格行为分析。识别市场结构、订单块、流动性参考价位和失衡区域,再通过Smart Panel选择要显示的内容。 更有条理地分析市场 • 市场结构:内部与波段结构、HH/HL/LL/LH、BOS与CHoCH、高周期分析及多周期仪表板。 • 关键区域:内部与波段订单块、供需区域、Fair Value Gaps(公允价值缺口),以及溢价、均衡和折价区域。 • 流动性参考:等高点与等低点、强弱波段高低点,以及前一日、前一周和前一月的高低点。 • 斐波那契工具:根据当前或前一个波段自动识别。 • 交易时段:伦敦、纽约、东京、悉尼和法兰克福时段,伦敦与纽约kill zones、蜡烛倒计时,以及受支持事件的提醒。 使用Sm
Atomic Analyst MT5
Issam Kassas
4.47 (60)
Atomic Analyst — MetaTrader 5 购买后,请在 MQL5 上给我发消息,即可免费获得 Smart Universal Expert Advisor,以及在线课程、PDF 手册和私人群组访问权限。 Atomic Analyst 将价格行为、趋势方向、入场和出场信号、止损位及多个止盈位集中呈现在图表上。 看清信号,理解交易形态 Atomic Analyst 将分析结果整理为清晰的可视化信息: • 买入和卖出箭头,用于识别潜在的入场机会。 • 止损位和多个止盈位,帮助规划交易。 • 趋势、强度和动量读数,用于评估市场方向。 • 多时间周期分析,用于比较更广泛的市场背景。 • 彩色K线和提醒,帮助您跟踪变化的市场条件。 结合辅助分析查看信号,再判断该交易形态是否符合您的交易规则。 从短期形态到更大级别的行情 您可以将 Atomic Analyst 用于剥头皮交易、日内交易,或跟踪持续时间更长的市场走势。 建议从 H1 时间周期开始。建议交易品种包括 EURUSD、AUDUSD 和 XAUUSD。 从信号到自动化 Smart Universal Expert A
Crystal Heikin Ashi Signals
Muhammad Jawad Shabir
5 (4)
Crystal Heikin Ashi Signals—Professional Trend & Signal Detection Indicator Advanced Heikin Ashi Visualization with Intelligent Signal System for Manual & Automated Trading Final Price: $149 ---------> Price goes up $10 after every 10 sales . Limited slots available — act fast . Overview User Guide PDF Crystal Heikin Ashi Signals is a professional-grade MetaTrader 5 indicator that combines pure Heikin Ashi candle visualization with an advanced momentum-shift detection system. Designed for both m
Power Candles MT5
Daniel Stein
4.58 (12)
Power Candles V3 - 自我优化的强度指标 Power Candles V3 把货币与品种的强度直接转化为图表上可执行的交易方案。指标不再仅根据强度给K线着色,而是在后台持续运行实时自动优化,为您正面对的品种给出最佳 Stop Loss、Take Profit 与信号阈值。一键采用,Entry、Stop Loss、Take Profit 线就以精确价格绘制在图表上,提醒消息中直接包含方向。 本工具是 Stein Investments 生态系统的一部分 - 18+ 款工具,加上 Max,您的一对一 AI 交易导师。  随时在线,深入了解每一款指标,在您需要梳理思路的那一刻就在那里。  立即认识他: https://stein.investments 每根收盘K线运行 3,000+ 次交易模拟。9 种强度状态。2 种策略并行测试。一键采用最优配置。 为什么需要这个 大多数强度指标只给您一个数值,然后留下三个问题:相信哪个阈值、用哪个 Stop Loss、走哪个交易方向。Power Candles V3 在每根收盘K线上自动回答这些问题。结果就是一个完整的交易方案 -
Quant Direction MT5
Georgios Kalomoiropoulos
Quant Direction 是一款三维市场分析工具。它通过同时计算多个维度上的精确百分比偏差,提供完全客观的、基于算法的市场分析视角。该算法采用先进的人工智能建模工具开发,并经过全面测试,旨在以独特的精准度解读市场。它可以分析您平台上的任何货币对或金融工具。 无论您是短线 交易者、日内 交易者还是波段交易者,Quant Direction 都是您的理想之选。 交易者的真正优势 Quant Direction 的真正优势在于彻底消除情绪、屏幕疲劳和过度思考。它无需手动点击十几个图表来寻找方向并反复质疑自己的偏好,引擎即可在几毫秒内即时处理 8 个时间周期(从 5 个月到月线)。它能准确告诉你任何时刻谁在掌控市场,确保你始终朝着概率最高的方向进行交易。 市场分析的三个维度 该算法将市场分为三个不同的交易维度,为您提供完整的宏观和微观视角: 超短线交易分析: 捕捉即时、快速的动量变化和较低时间框架的执行点。 日内分析: 识别真实的、潜在的每日方向性偏差。 波动分析: 专注于宏观趋势,确保您不会与大盘机构的走势背道而驰。 独家评分引擎 Quant Direction 的底层采用了一套
作者的更多信息
B4S Adaptive YAxis Scaling
Henry Waribu Macharia
Product Description: Adaptive Y-Axis Scaling is a powerful MT5 indicator designed to enhance your trading experience by providing precise control over the Y-axis (price) scaling of your charts. This innovative tool allows you to customize the price scaling by specifying the number of pips from the visible chart's highs and lows. The calculated price range from this input is then used to set the maximum and minimum prices for the open chart, ensuring an optimized and comprehensive view of market
FREE
B4S BidLine CandleTimer
Henry Waribu Macharia
Introducing the B4S BidLine CandleTimer An insightful indicator that combines real-time bid line visualization with a dynamic countdown timer. Gain a competitive edge in your trading as you stay informed about the time remaining until the next candle starts, all displayed seamlessly on your chart. Why B4S BidLine CandleTimer? Unleash the potential of your trading strategy with the B4S BidLine CandleTimer. Here's why this indicator stands out: Real-Time Bid Line: Witness market movements like nev
B4S ChartExplorer
Henry Waribu Macharia
Brief Description: An advanced navigation, news display, and control panel indicator designed to revolutionize your chart analysis experience. Seamlessly navigate through timeframes, dates, and times with an intuitive control panel, and stay informed with visually represented detailed news events. Now with enhanced features and improvements for an even better trading experience. Key Features: User-Friendly Control Panel: Easily navigate through timeframes, dates, and times. Enable or disable the
B4S Economic News Radar
Henry Waribu Macharia
Brief Description B4S Economic News Radar now offers enhanced features to keep traders informed and empowered. Experience comprehensive news coverage directly on your trading chart, including upcoming and past events, customizable reminders, and automatic time zone adjustments. Why News Events Matter: Market volatility triggered by economic indicators, central bank decisions, and geopolitical events can significantly impact trading outcomes. Stay ahead of these shifts with timely information and
B4S ICT Key Open Lines
Henry Waribu Macharia
Brief Description The indicator is a powerful tool based on Inner Circle Trader's trading theory. It strategically plots lines at key prices relative to time, highlighting crucial market moments such as Tokyo Open, New York Midnight, London Open, New York Open, New York 8:30 AM, and New York Session End. The indicator is built on the foundation of Inner Circle Trader's trading theory, emphasizing the significance of key open times as liquidity and reference zones. These zones act as magnets for
B4S ICT Killzones
Henry Waribu Macharia
Brief Description The B4S_ICT_Killzones indicator is designed to enhance your trading strategy by highlighting key market times based on the Inner Circle Trader's (ICT) proven trading model. This indicator intelligently plots colored boxes around critical "killzone" periods, providing valuable insights into market behavior influenced by different geographical and time zone locations and time variations. Features / Indicator Settings 1. Killzone Identification Asian Range: Target the Asian tradin
Brief Description: The B4S_Institutional_Round_Number_Prices indicator identifies and marks key price levels, known as round number prices or institutional price levels, renowned for their psychological significance. These levels often influence institutional activity, attracting attention and triggering significant market moves.   Features: Round Number Price Identification: The indicator excels at identifying round number prices, providing you with crucial insights into potential market moveme
B4S PriceLevel Watcher
Henry Waribu Macharia
Brief Description The B4S PriceLevel Watcher is a useful indicator designed to empower traders with precise price level notifications. It allows users to set customizable notifications based on specific price types, such as close, high, low, ask, bid, or either ask or bid of the current candle.   Problem being solved In the ever-evolving world of trading, staying attuned to price movements is paramount. Traders need to remain vigilant, ready to act swiftly as market conditions change. However, t
筛选:
无评论
回复评论