B4S ICT Historical OHLC Lines

Brief Description:

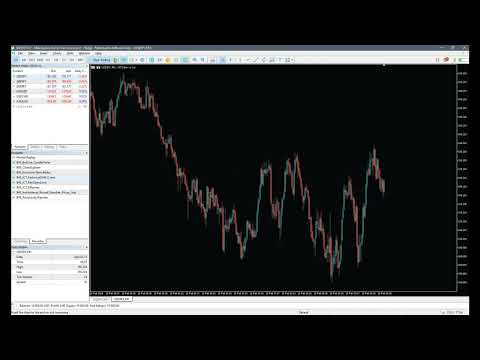
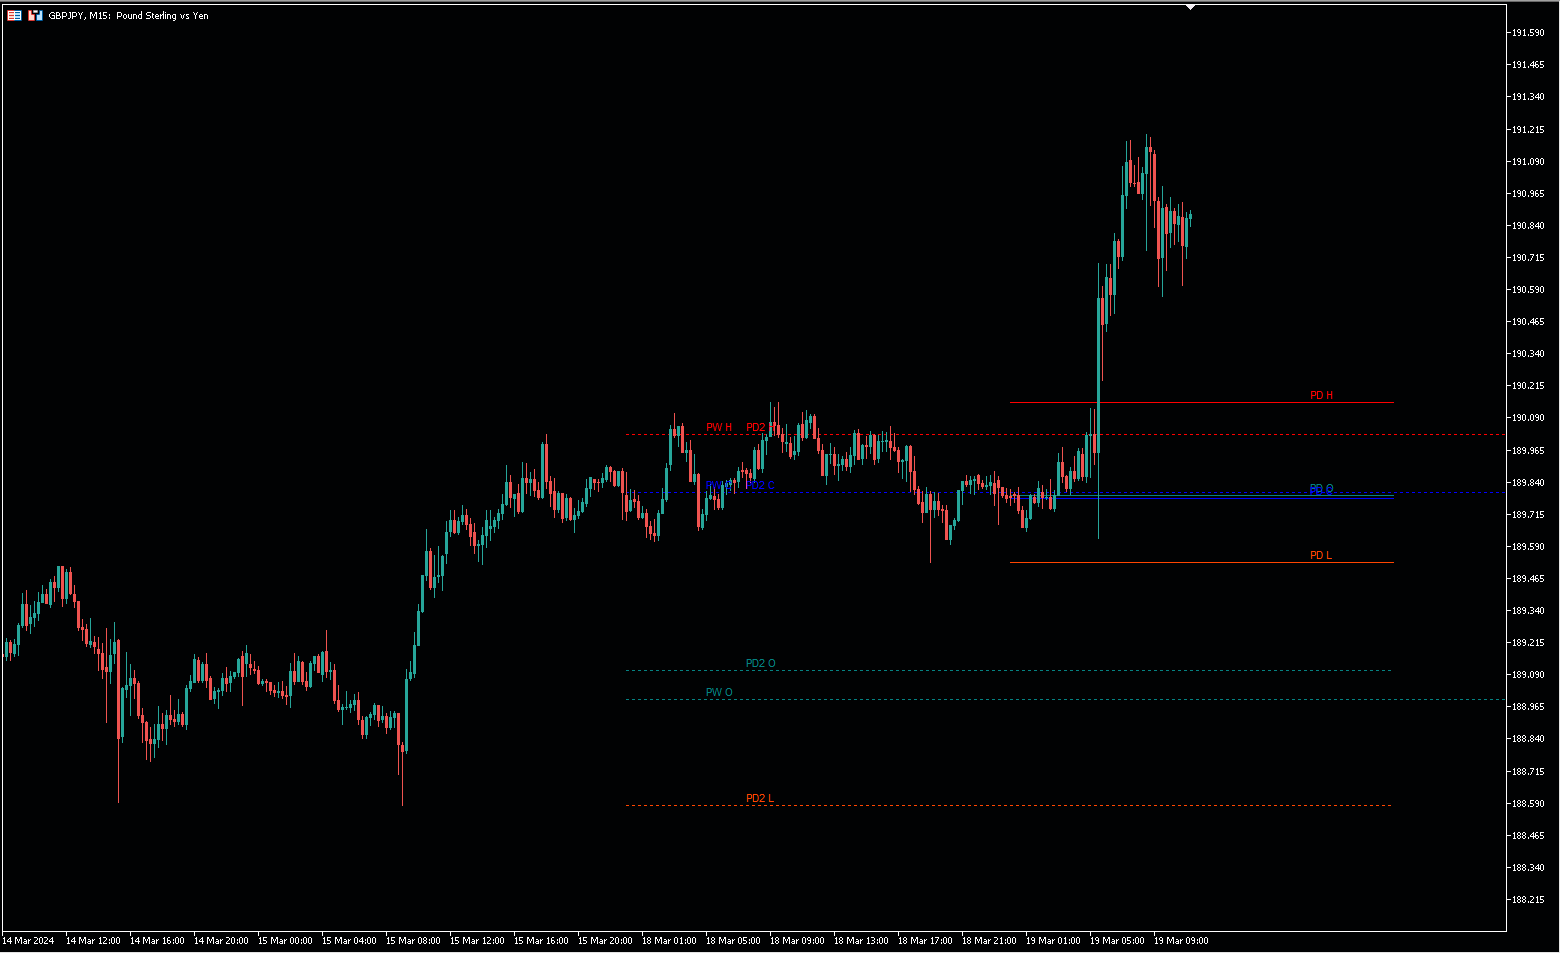
A tool to display historical Open, High, Low, and Close (OHLC) price points for various time periods. Gain insights into market behavior with data from yesterday, the day before, the previous week, and the previous month. Recognize liquidity zones effectively.

Features:

1. Comprehensive Timeframe Insights:

  • Visualize crucial OHLC points for different timeframes.
  • Historical data for yesterday, day before yesterday, previous week, and previous month.

2. Built on ICT's Teachings:

  • Aligned with Inner Circle Trader (ICT) teachings, emphasizing historical price points in predicting future movements.

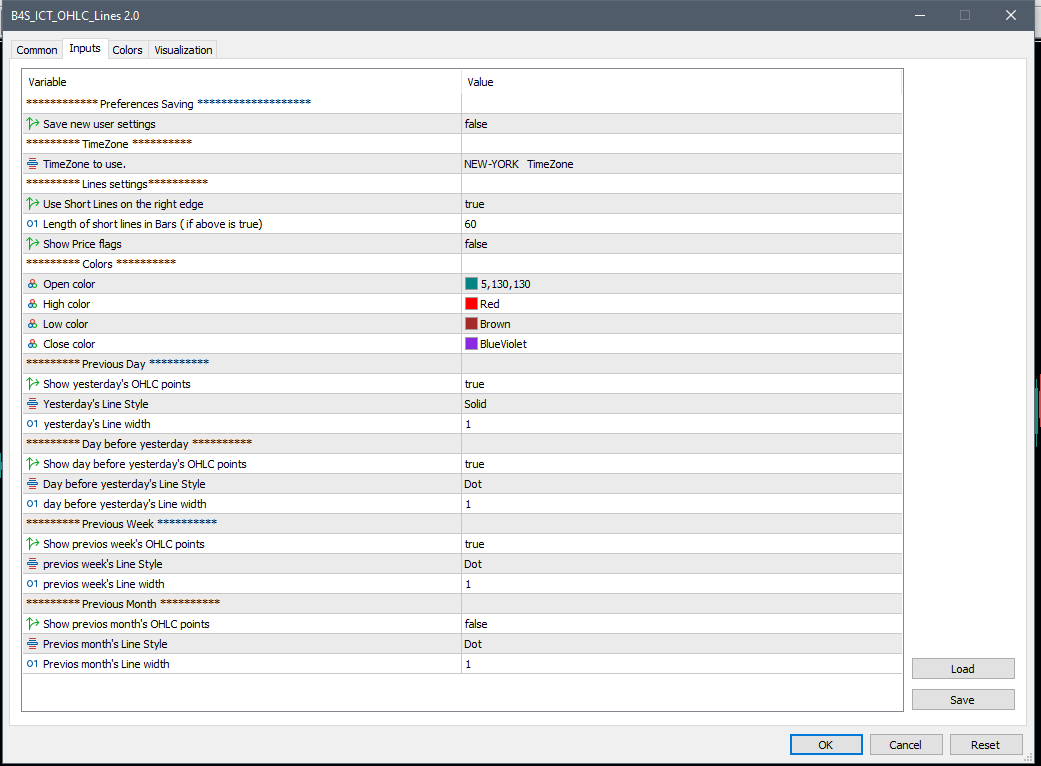
3. User-friendly Customization:

  • Customize visibility for each timeframe.
  • Choose from various line styles, widths, and colors.

4. Persistent User Settings:

  • Set configurations once; they persist through restarts.
  • Modify settings with a simple Boolean toggle.

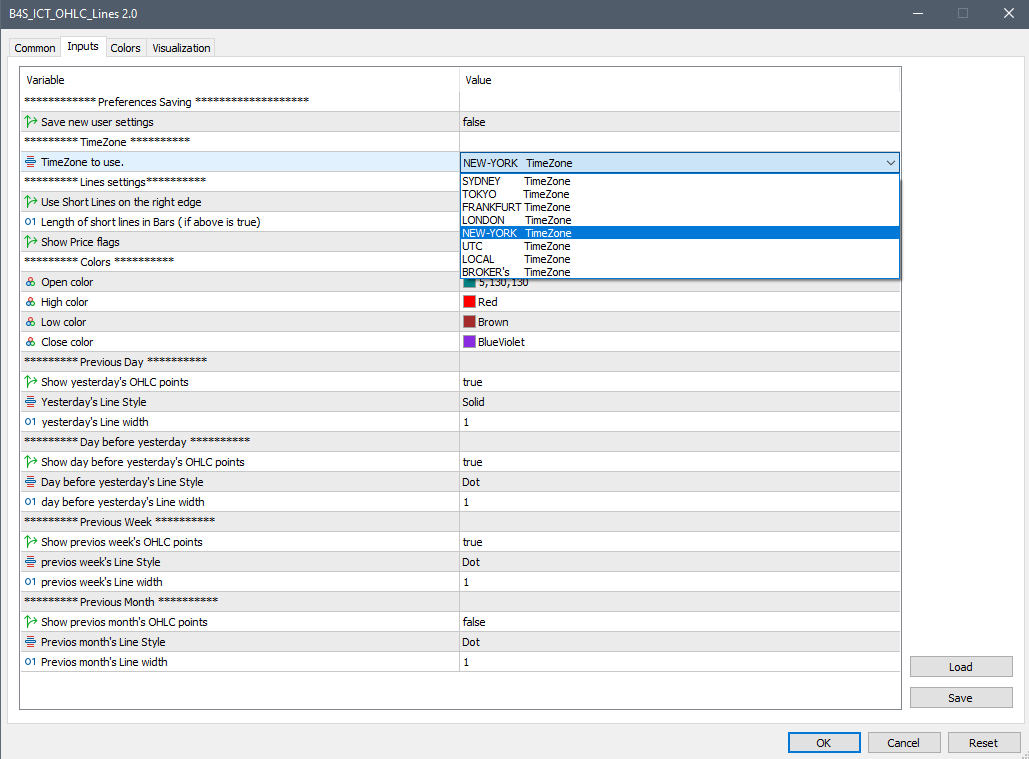
5. Enhanced Time Zone Flexibility:

  • Select the time zone for OHLC calculations, rather than defaulting to the local time zone.

6. Neat and Clutter-Free Display:

  • Option to draw shorter lines to the right edge of the chart, reducing clutter and making the chart neater.

Using Historical OHLC Levels to understand Market Liquidity:

  • Liquidity at Key Levels: Historical OHLC levels are key levels where market participants have shown interest.
  • Price Attraction to Historical Zones: Price gravitates towards these historical levels due to liquidity presence.
  • Stop-Loss and Take-Profit Zones: Traders set orders around historical OHLC levels, leading to increased activity.
  • Institutional Trading Strategies: Institutional traders use historical levels as decision-making reference points.
  • Confirmation of Breakouts and Reversals: Significant movements often occur near historical OHLC levels.
  • Enhanced Predictive Analysis: Incorporating liquidity zones into technical analysis enhances predictive power.
  • Risk Management Considerations: Identifying liquidity zones helps in effective risk management.
  • Adaptability to Current Market Conditions: Understanding historical zones helps adapt strategies to current conditions.

Related Topics:

  1. B4S
  2. B4S Indicator
  3. #ICT (Inner Circle Trader)
  4. #Market Liquidity Zones
  5. #Historical Price Analysis
  6. #Key OHLC Levels
  7. #Price Reactions to Historical Zones
  8. #Predictive Analysis with OHLC Data
  9. #Institutional Trading Techniques
  10. #OHLC Breakout Confirmation
  11. #Risk Management around OHLC Zones
  12. #Adaptive Trading Strategies
  13. #MetaTrader 5 Indicator Insights
  14. #Technical Analysis Tools
  15. #Price Behavior Patterns
  16. #Market Sentiment and OHLC Levels
  17. #Price Gravity and Liquidity Zones
  18. #OHLC Support and Resistance Levels
  19. #Market Depth Analysis with OHLC Data
  20. #Price Action Strategies with Historical Levels
  21. #Trading Psychology around OHLC Zones
  22. #Price Volatility and OHLC Patterns
  23. #OHLC Trend Identification Techniques
  24. #Timeframe Analysis for Price Prediction
  25. #Price Manipulation and OHLC Levels
  26. #OHLC Scalping Techniques
  27. #Swing Trading with Historical OHLC Points
  28. #Price Consolidation Patterns and OHLC Zones
  29. #OHLC Breakout
おすすめのプロダクト
Two Pole Oscilator
Mohammad Taher Halimi Tabrizi
Category: Oscillator Indicator Platform: MetaTrader 5 Type: Entry Indicator Timeframes: All Trader Styles: Scalping, Day Trading, Swing Trading, Binary Options Markets: All Description The Two-Pole Oscillator is an analytical tool based on deviation calculations and a two-pole smoothing filter. It is designed to highlight momentum conditions and potential trading signals while filtering out short-term noise. Main features: Two-Pole Filtering – Reduces chart noise for smoother oscillator curves.
一目で分析を強化! このインジケーターは、価格が最近反発または突破した重要なレベルを自動的に描画し、手動でラインを引くことなくサポートとレジスタンスのゾーンを表示します。チャートに適用するだけで、各期間の過去の高値・安値ラインが表示されます。 各ラインの意味 Previous Month High ‣ 前月高値:前の月の期間内で記録された最高価格。 Previous Month Low ‣ 前月安値:前の月の期間内で記録された最安価格。 Previous Week High ‣ 前週高値:前の週の期間内で記録された最高価格。 Previous Week Low ‣ 前週安値:前の週の期間内で記録された最安価格。 Previous Day High ‣ 前日高値:直前の取引日の最高価格。 Previous Day Low ‣ 前日安値:直前の取引日の最安価格。 なぜ使うのか? グラフを開いた瞬間に 反発 と 突破 を検出。 実績あるゾーンで 利確 と 損切り を設定。 SMC や ICT 戦略に必須、市場構造をベースにエントリーと決済を最適化。 スキャルピング 、 スイング
"Battles between bulls and bears continue to influence price development long after the combat has ended, leaving behind a messy field that observant technicians can use to manage risk and find opportunities. Apply "trend mirror" analysis to examine these volatile areas, looking for past action to impact the current trend when price turns and crosses those boundaries." RSI Mirrors and Reflections is a robust technique using multiple RSI periods, mirrors and reflections based on RSI values to ind
KT DMA is a modified and advanced version of the classic Displaced Moving Averages with buy/sell crossover alerts and a Multi-Timeframe scanner that shows DMA's direction across each real-time time frame. A Displaced Moving Average is a simple moving average that moves ahead or backward in a time frame (either short-term or long-term). It also allows you to predict price movement more accurately. Features Depicts the trend direction using the alignment of three moving averages. Buy/Sell signals
ARIPoint is a powerful trading tool designed to generate high-probability entry signals with dynamic TP/SL/DP levels based on price volatility. The integrated performance tracking function displays win/loss statistics, number of PP1/PP2 hits, and success rate, all updated in real time. Key Features: Buy/sell signals with adaptive volatility range Real-time TP/SL/DP levels based on ATR Integrated MA filter with ATR/StdDev volatility option. Performance statistics table (Success, Profit/Loss,
Every Trader trades in a market zone. If you are not living in the time zone you are trading, you need a clock to show you what time it is in your favorite time zone, and it should be small at the same time to not interrupt your trading process.  In this small indicator, you have access to 3 major clocks around the world, and you can easily look at them. We have some other products that I am sure will help you with your trading career. Please have a look at the link: LINK our all-in-one trading
I recommend you to read the   product's blog  (manual) from start to end so that it is clear from the beginning what the indicactor offers. This multi time frame and multi symbol divergence dashboard indicator sends an alert when one or two different divergences have been identified. It can be used with all time frames from M1 to MN. Maximum 9 time frames can be shown in the dashboard at the same time. It is possible to enable moving average, RSI or Bollinger bands trend filter to filter out on
Titan Fibonacci Levels
Bruno Rodrigues Paes Dourado Da Silva
Titan Fibonacci Levels The Titan Fibonacci Levels indicator creates a highly accurate market level structure, allowing you to identify potential zones of reversal, continuation and movement targets. Indicator concept The calculation is based on three main elements: Opening of the period (Opening Pivot); It serves as the central point of market equilibrium; Amplitude of the previous period (Range); Calculated by the difference between High and Low of the previous period. Range Fibonacci Proje
Market Noise マーケットノイズは、価格チャート上の市場の局面を決定する指標であり、また、蓄積または分配局面が発生したときに、明確で滑らかなトレンドの動きとノイズの多い平坦な動きを区別します。 各フェーズは、独自のタイプの取引に適しています。トレンド追跡システムにはトレンド、積極的なシステムにはフラットです。 市場のノイズが始まったら、取引を終了することを決定できます。 同様に、またその逆も同様で、騒音が止んだらすぐに、積極的な取引システムをオフにする必要があります。 一方からもう一方に切り替えて、両方のタイプの取引戦略を取引することができます。 したがって、この指標は取引決定の分野で優れたアシスタントの役割を果たします。 すべての価格変動は、選択した期間の一般的な価格変動と、この期間内の価格変動の形でのノイズという 2 つの要素に分けることができます。 同時に、異なる期間の異なる市場では、ノイズ成分とトレンド成分の間の幅広い相互関係を示すことができます (図 1)。 価格変動のノイズレベルが高くなるほど、基礎的なトレンドの方向性と強さを識別することが難しくなります。 した
KT Price Border MT5
KEENBASE SOFTWARE SOLUTIONS
KT Price Border は、3本のバンドで構成された価格チャネルを作成し、市場のスイングハイとスイングローの可能性がある領域を特定します。これらのレベルは、動的なサポートおよびレジスタンスとしても使用できます。 中央のバンドは、トレンドの方向を識別するためにも使用できます。そのため、このインジケーターはトレンドフォロー型の指標としても機能します。さらに、使いやすさとシンプルなトレードシグナルにより、初心者トレーダーにとって非常に有益です。 特徴 ほとんどの FX 通貨ペアで優れたパフォーマンスを発揮します。 短時間足と長時間足の両方で使用可能です。 スキャルピング、デイトレード、スイングトレードに適しています。 トレンドフォロー戦略と逆張り戦略の両方に対応しています。 価格がバンドを超えたときにアラートを送信できます。 価格バンドは、動的なサポートおよびレジスタンスレベルとして機能します。  価格境界の概念を理解する このインジケーターは、ボリンジャーバンドと同様に機能します。下部バンドは、市場の売られ過ぎ状態を示し、動的なサポートとして機能します。 上部バンドは、市場の
Market Structure Break & Order Block (MSB-OB) The Market Structure Break & Order Block (MSB-OB) indicator is built to analyze price structure, highlight market structure breaks, and mark order block zones. It also provides buffers for Buy/Sell signals and MSB detection, making it suitable for both manual analysis and automated strategies. A tester panel is included to evaluate performance under different conditions in the Strategy Tester. Main Concept Market Structure Break (MSB): Occurs after
Only 5 copies of the EA at $30! Next price --> $45 Find charts and signals based on harmonic patterns, which work great in 1-hour timeframes and up. Buy and sell signs based on different harmonic patterns as follows: 0: ABC_D 1: ABCD_E 2: 3Drive 3: 5_0 4: Gartley 5: Bat 6: Crab 7: Butterfly 8: Cypher 9: NenStar 10: Shark 11: AntiBat 12: AntiGartley 13: AntiCrab 14: AntiButterfly 15: AntiCypher 16: AntiNenStar 17: AntiShark How to use: When there is an opportunity to buy or sell, you have 5:
ブログ: https://www.mql5.com/en/blogs/post/769823 MT4: https://www.mql5.com/en/market/product/176181 MT5: https://www.mql5.com/en/market/product/176182 VOLUME BUBBLE [tambangEA] は、トレーダーがチャート上で異常な市場動向を直接把握できるよう設計された、高機能なビジュアルボリュームプレッシャーインジケーターです。 このインジケーターは、異常なデルタ/ボリュームの動きを検出し、価格変動の周囲に明確なバブルマーカーとして表示します。各バブルはボリュームプレッシャーイベントを表しており、トレーダーは強い参加、不均衡、モメンタムプレッシャー、または潜在的な吸収がどこで発生しているかを素早く確認できます。 このツールは、ローソク足ごとの生ボリュームデータを手動で分析することなく、市場の参加状況を視覚的に素早く把握したいトレーダー向けに設計されています。 主なコンセプト ほとんどの価格チャートは価格の動きのみを表示します
Historical Pivot Zones - Fibonacci Indicator MT5 Automatically draws Fibonacci retracement and projection zones based on historical price pivots. This MT5 indicator intelligently selects pivot points from different timeframes (weekly, monthly, or 6-month ranges) and creates visual Fibonacci zones around key levels. Features include: Smart Mode Selection - Auto-adjusts based on your chart timeframe Clean Visual Zones - Highlighted areas instead of just lines Essential Fib Levels - 9 retrace
Anchored VWAP Trading Indicator Struggling to identify true market value and key support/resistance levels? The Anchored VWAP Trading Indicator helps you track price based on real traded volume, giving you a clear edge in your trading decisions. This tool allows you to anchor VWAP from any point on the chart, making it ideal for analyzing trends, reversals, and institutional activity. Key Features Anchored VWAP from any candle Accurate volume-weighted price calculation Works on all symbol
Levels Mult OHLC
Cinthia Regina De Moraes
Considerando que os preços de OHLC de períodos anteriores são regiões importantes de negociação, criei um indicador que traça linhas de Open, High, Low e Close do dia, semana ou mês anterior no gráfico atual. Além de marcar essas regiões, linhas extras foram inseridas como opção que marcam os MEIOS (50%) dessas regiões e uma linha que marca a ABERTURA do dia. O usuário pode configurar a exibição das linhas que achar mais expressivas. Configurações: PERIOD RANGE Timeframe = Período de referência
SupportResistanceは、以前のろうそくの高値と安値に基づく動的なサポートとレジスタンスのインジケーターです。 計算パラメータは設定可能です。 前のキャンドルの最大値と最小値を参照として使用することも、前のキャンドルのグループの最大値と最小値を使用することもできます。 インジケーターは、抵抗を示すために赤い線を使用し、サポートを示すために緑の線を使用します。 サポートまたはレジスタンスが壊れた場合、その線は点線で示され、再び関連するようになったときにのみ復元されます。 サポートまたは抵抗が壊れた後、反対の線が到達すると、最後の有効な値で新しいサポートまたは新しい抵抗が見つかります。 過去の最大値または最小値の場合、有効なサポートまたはレジスタンスラインはありません。
Utilities
Douglas Lucio De Araujo
Indicator with 3 features - Clock : Clock independent of the chart, counting continues even when the market is closed. - Template : After setting up a configuration in any graphic, be it color patterns, indicators, zoom ... The configuration will be copied to all active graphics. - TimeFrame : Set the TimeFrame on a chart, and with just one click all the active charts will be changed to the same TimeFrame.
MQL5ブログ: https://www.mql5.com/en/blogs/post/768823 MT4版: https://www.mql5.com/en/market/product/171247 MT5版: https://www.mql5.com/en/market/product/171248 フィボナッチプロジェクション[tambangEA]は、トレーダーが市場構造、フィボナッチプロジェクションターゲット、ボリューム反応ゾーン、方向性継続エリアをチャート上で直接特定できるよう設計された、プロフェッショナルなダッシュボードベースのトレーディング分析ツールです。 このツールは、最新のスイング構造を自動的に検出し、フィボナッチベースのプロジェクションレベルを構築し、コントロールポイント(POC)エリアを強調表示し、フィボナッチバンド全体のデルタ情報を表示します。手動でフィボナッチプロジェクションを描画することなく、市場の動きを明確かつ構造的に視覚的に把握したいトレーダー向けに設計されています。 このツールが開発された理由 多くのトレーダーはフィボナッチレベルを手動で
You ask yourself the question every time you open your charts: how to win in trading? Will using a lot of indicators work? well know that I also asked myself the same questions when I first started trading. After testing many indicators, I realized that winning trading is simple and accurate trading. after several months of thinking and optimizing I was able to find my solution: Candle Good Setup Candle Good setup is a trend and entry timing indicator analyzing the market in multi-frame to give
このマルチタイムフレームとマルチシンボルインジケーターは、ピンバー、朝/夕方の星、巻き込み、ピンセット、スリーラインストライク、インサイドバー、ペナントとトライアングルをスキャンします。 インジケーターはシングルチャートモードでも使用できます。このオプションの詳細については、製品の     ブログ 。     独自のルールとテクニックを組み合わせることで、このインジケーターを使用して、独自の強力なシステムを作成(または強化)できます。 特徴 マーケットウォッチウィンドウに表示されているすべてのシンボルを同時に監視できます。インジケーターを1つのチャートに適用し、市場全体を即座に監視します。 M1からMNまでのすべての時間枠を監視し、パターンが識別されるとリアルタイムのアラート(ポップアップ、プッシュ、またはメール)を送信します。 RSIとボリンジャーバンドをピンバー、朝/夕方の星 、巻き込み、ピンセットの形成の フィルターとして使用して、潜在的な逆転を適切に特定できます。 主要なトレンドフィルターとして移動平均を使用し、ボラティリティフィルターとしてADXを使用できます。 インジケータ
รองรับโครงสร้างตลาดอัจฉริยะ AI PRO MT5 ไอดิเคเตอร์นี้รวม 3 ส่วนหลัก: โครงสร้างตลาด → HH / HL / LH / LL สัญญาณรูปแบบ → 2B / 123 / ตัดและทดสอบใหม่ AI Forecast (NN) → ทิศทาง + กรองสัญญาณ วิธีใช้งานจริง (เข้าใจง่าย) 1. ดูโครงสร้างตลาด (ตัวหลัก) HH + HL ต่อเนื่อง → เทรนขึ้น (หาจังหวะ ซื้อ) LH + LL ต่อเนื่อง → เทรนลง (หาจังหวะขาย) ใช้เป็น “ในหลัก” ก่อนที่จะดูสัญญาณ 2. ใช้รูปแบบการป้อนเข้า 2B ( กลับตัว) 2B บน → ขาย 2B ล่าง → ซื้อ ใช้ตอน “ตลาดเริ่มกลับ” แพทเทิร์น 123 เบรกจุด 2 → เข้าเ
Overview Comprehensive technical analysis indicator combining 20+ essential trading tools in a single chart display. Moving Averages EMA (Exponential Moving Average): 9, 21, 50, 200 periods SMA (Simple Moving Average): configurable period Customizable colors and line widths Price position indicators (above/below) Oscillators & Momentum RSI (Relative Strength Index): adjustable overbought/oversold levels MACD (Moving Average Convergence Divergence): customizable fast/slow/signal periods Stochasti
Range Filtered AlgoAlphaは、市場のボラティリティを分析することで潜在的な取引機会を特定するためのテクニカル分析ツールです。このMetaTrader向けAlgoAlphaオリジナルTradingViewインジケーターの改訂版は、複数の分析方法を組み合わせて視覚的な市場評価を提供します。 技術的特徴 価格平滑化にカルマンフィルター(Kalman Filtering)を採用 ボラティリティ測定にATRベースバンド(ATR-based Bands)を統合 トレンド分析にスーパートレンド(Supertrend)要素を組み込み カラーろうそく足(Candles)とマーカー(Markers)で視覚的シグナルを提供 設定可能なアラート機能(Configurable Alerts)を装備 機能性 当インジケーターは市場データを処理し以下を実現: ATR(平均真の範囲)を使用したボラティリティレンジ計算 市場ノイズ低減のためのフィルタリング技術(Filtering Techniques)適用 視覚的要素(Visual Elements)による潜在的なトレンド方向の表示 使用事例 ボ
Brilliant Reversals MultiCurrency Scanner MT5は、複数の通貨ペアにおける潜在的な反転ポイントを特定しようとするトレーダーのために設計された最先端のトレーディングインジケーターです。高度なアルゴリズムを活用することで、このツールは瞬時に洞察を提供し、トレーディング戦略を最適化しようとする初心者と経験豊富なトレーダーの両方にとって非常に貴重です。 このインジケーターは、市場の状況に基づいてリアルタイムの売買シグナルを提供することで、トレーダーの意思決定を強化し、取引パフォーマンスを向上させます。包括的なダッシュボードとアラート機能を備えており、主要な通貨ペアを簡単に監視し、市場の機会に迅速に対応できます。 MQL製品のインストールガイド | MT4/MT5で購入したMQL製品の更新 | 一般的なトラブルシューティングガイド | インジケーター設定 / ガイド 主な特徴 バッファ統合: インジケーターの値をアクセス可能なバッファとして公開し、Expert Advisorがシグナルベースのトレーディングを効果的に利用できるようにします。 視覚的矢印シ
CISD Levels Pro automatically draws CISD Buy and Sell levels directly on your chart. It highlights pending levels while they are forming, then marks confirmed levels after the confirmation candle closes. Optional confirmation arrows help you spot the signal quickly. This tool is designed for traders who want clean, simple CISD level visualization without extra indicators or clutter. Key Features Draws Bullish (BUY) CISD levels and Bearish (SELL) CISD levels Shows Pending levels (dashed) and
Session Kill zones with panel for quick changes. Asia Killzone London Killzone New York Killzone London Close Killzone In this indicator GMT+2 timings are used that are most common among many brokers. read the image attached in the screenshots to know more about sessions adjustments Session timings can be changed according to your broker timings and day light savings. Thank you :) Always open to feedback and criticism if it helps me provide you more value. - Rahul  My other indicators you may l
BEHOLDER – THE INDICATOR THAT REVEALS HIDDEN PATTERNS IN TIME THE REAL TRADER’S PROBLEM: TEMPORAL BLINDNESS Every week, thousands of traders face the same dilemma: A flood of economic events (NFP, CPI, Interest Rates, Retail Sales…) Very little time to analyze correlations Decisions made on “gut feeling,” without reliable historical context Trying to do this manually is insane: Scrolling back through dozens of weeks on the calendar Comparing event by event Trying to calculate patt
The indicator helps to enter a trade following the trend, at the same time, after some correction. It finds strong trending movements of a currency pair on a given number of bars, and also finds correction levels to this trend. If the trend is strong enough, and the correction becomes equal to the one specified in the parameters, then the indicator signals this. You can set different correction values, 38, 50 and 62 (Fibonacci levels) are better. In addition, you can set the minimum trend lengt
Adaptive Fibonacci Trend Zones is an MT5 indicator built for traders who want a clean structure-based Fibonacci workflow without constantly redrawing anchors by hand. The indicator automatically detects the dominant swing, builds the active Fibonacci map, projects trade-map zones and adapts its behavior across scalp, intraday and swing conditions. Instead of leaving outdated levels on the chart when structure changes, the indicator can disable the active trade map and wait for a new anchor. T
このプロダクトを購入した人は以下も購入しています
ARIPoint is a powerful trading companion designed to generate high-probability entry signals with dynamic TP/SL/DP levels based on volatility. Built-in performance tracking shows win/loss stats, PP1/PP2 hits, and success rates all updated live. Key Features: Buy/Sell signals with adaptive volatility bands Real-time TP/SL/DP levels based on ATR Built-in MA Filter with optional ATR/StdDev volatility Performance stats panel (Success, Profit/Loss, PP1/PP2) Alerts via popup, sound, push, or email Cu
SuperScalp Pro
Van Minh Nguyen
4.63 (24)
SuperScalp Pro – 高度なマルチフィルタースキャルピングインジケーターシステム SuperScalp Pro は、クラシックな Supertrend と複数のインテリジェント確認フィルターを組み合わせた高度なスキャルピングインジケーターです。M1 から H4 まで複数の時間足で効率的に動作し、XAUUSD、BTCUSD、主要 Forex 通貨ペア向けに最適化されています。 このインジケーターは明確な Buy / Sell シグナルを提供し、ATR に基づいてエントリー価格、Stop Loss、Take Profit を自動計算します。Fibonacci Take Profit 機能により、重要な価格帯で早期決済し、到達時に通知を送信します。 初期設定では Fibonacci Take Profit が有効化されており、より安定した取引体験を重視しています。チャートに適用するだけですぐ利用可能です。上級者向けに、すべてのパラメータは自由にカスタマイズできます。 EMA、RSI、ADX、Volume、VWAP、Bollinger Bands、MACD Divergence な
このインジケーターを購入された方には、以下の特典を 無料 で提供しています: 各トレードを自動で管理し、ストップロスとテイクプロフィットを設定し、戦略ルールに基づいてポジションを決済する補助ツール 「Bomber Utility」 様々な銘柄に合わせたインジケーターの設定ファイル(セットファイル) 「最小リスク」、「バランスリスク」、「待機戦略」 の3つのモードで使用できる Bomber Utility 用の設定ファイル このトレーディング戦略をすぐに導入・設定・開始できる ステップバイステップのビデオマニュアル ご注意: 上記の特典を受け取るには、MQL5のプライベートメッセージシステムを通じて販売者にご連絡ください。 オリジナルのカスタムインジケーター 「Divergence Bomber(ダイバージェンス・ボンバー)」 をご紹介します。これは、MACDのダイバージェンス(乖離)戦略に基づいた 「オールインワン」型のトレーディングシステム です。 このテクニカルインジケーターの主な目的は、価格とMACDインジケーターの間に発生するダイバージェンスを検出 し、将来の価格の動きを示す
Entry In The Zone and SMC Multi Timeframe is a real-time 2-in-1 market analysis tool that combines market structure analysis and a No Repaint BUY / SELL signal system into a single indicator, built on Smart Money Concepts (SMC) — a widely adopted framework used by professional traders to understand market structure. This indicator helps you see the market more clearly, make decisions based on structure rather than guesswork, and focus on high-probability zones where price is more likely to react
SignalTech MT5 is an unique fully rule based trading system for EURUSD, USDCHF, USDJPY, AUDUSD, NZDUSD, EURJPY, AUDJPY, NZDJPY, CADJPY.  All the winning trades with chart setups are published on the comments page. 2026-05 2802 Pips (Until 05-15 NY Closed) 2026-04 2243 Pips 2026-03 2165 Pips 2026-02 2937 Pips 2026-01 2624 Pips 2025-12 1174 Pips It can generate signals with Buy/Sell Arrows and Pop-Up/Sound Alerts. Each signal has clear Entry and Stop Loss levels, which should be automatically flag
Power Candles V3 - 自己最適化型強弱インジケーター Power Candles V3は 、通貨や銘柄の強さを、適用されたすべてのチャート上で実行可能なトレードプランに変換します。単にローソク足を色分けするだけでなく、バックグラウンドでリアルタイムの自動最適化を実行し、目の前の銘柄に対して最適なストップロス、テイクプロフィット、およびシグナルの閾値を提示します。ワンクリックで実取引に適用でき、エントリーポイント、ストップロス、テイクプロフィットのラインが正確な価格位置にチャート上に表示され、方向性を示すアラートがリアルタイムで発動します。 このツールは、Stein Investmentsのエコシステムの一部です。  18種類以上のツールをすべて閲覧し、AIを活用したセットアップの推奨事項を入手し、  https://stein.investments でコミュニティに参加しましょう クローズしたバーごとに3,000回以上のトレードシミュレーション。9つの強さの状態。2つの戦略を並行してテスト。勝率の高い設定をワンクリックで適用。 なぜこれが必要なのか ほとんどの強
Gann Made Easy   は、ミスター・ギャンの理論を使用した取引の最良の原則に基づいた、プロフェッショナルで使いやすい外国為替取引システムです。 W・D・ガン。このインジケーターは、ストップロスとテイクプロフィットレベルを含む正確な買いと売りのシグナルを提供します。 PUSH通知を利用して外出先でも取引可能です。 ご購入後、取引方法の説明と優れた追加インジケーターを無料で入手するには、私にご連絡ください! おそらく、ギャンの取引手法についてはすでに何度も聞いたことがあるでしょう。通常、ギャンの理論は初心者のトレーダーだけでなく、すでにある程度の取引経験がある人にとっても非常に複雑なものです。なぜなら、ギャンの取引手法は理論的にはそれほど簡単に適用できるものではないからです。私はその知識を磨き、最良の原則を私の外国為替インジケーターに組み込むために数年を費やしました。 このインジケーターは非常に簡単に適用できます。必要なのは、それをチャートに添付し、簡単な取引推奨事項に従うだけです。このインジケーターは常に市場分析の仕事を行い、取引の機会を探します。適切なエントリーポイントを検
このインジケーターを購入すると、プロ仕様のトレードマネージャーを無料で差し上げます。 まず第一に、このトレーディングシステムがノンリペイント、ノンリドロー、ノンラグのインジケーターであることを強調する価値がある。これにより、手動取引とロボット取引の両方に理想的なものになっています。 オンラインコース、マニュアル、プリセットのダウンロード。 「スマートトレンドトレーディングシステム MT5」は、新規および経験豊富なトレーダー向けにカスタマイズされた包括的なトレーディングソリューションです。10以上のプレミアムインジケーターを組み合わせ、7つ以上の堅実なトレーディング戦略を備えており、多様な市場状況に対応する多目的な選択肢となっています。 トレンドフォロー戦略:トレンドを効果的に乗り越えるための正確なエントリーとストップロス管理を提供します。 リバーサル戦略:潜在的なトレンドの反転を特定し、トレーダーがレンジ相場を活用できるようにします。 スキャルピング戦略:高速で正確なデイトレードおよび短期取引のために設計されています。 安定性:すべてのインジケーターはノンリペイント、ノンリドロー、ノ
まず正直に言いましょう。 どんなインジケーターも、それ単体であなたを利益化させることはできません。もしそう言う人がいるなら、それは夢を売っているだけです。完璧な売買シグナル(矢印)を表示するインジケーターは、いくらでも“完璧に見せる”ことができます。正しい過去の区間を拡大して、勝ちトレードだけを切り取ればいいだけです。私たちはそれをしません。 SMC Intraday Formula はツールです。 市場構造を読み取り、最も高い確率の価格ゾーンを特定し、今この瞬間のスマートマネーの痕跡をシンプルな言葉で正確に示します。最終判断はあなたが行います。トレードを実行するのもあなたです。しかし今は「希望」ではなく「精度」でエントリーできます。 私たちはこのインジケーターを、ゴールド(XAUUSD)および主要FX通貨ペアで約3年間、日々のスキャルピングに使用してきました。M1、M5、M15、M30の主要ツールです。これは未来を予測しようとするのではなく、今まさに形成されている高確率セットアップを示し、その理由を説明します。 他のすべてのインジケーターと何が違うのか? ほとんどのトレーディングイ
ご紹介     Quantum Breakout PRO は 、ブレイクアウト ゾーンの取引方法を変革する画期的な MQL5 インジケーターです。 13年以上の取引経験を持つ経験豊富なトレーダーのチームによって開発されました。     クォンタム ブレイクアウト プロ   は、革新的でダイナミックなブレイクアウト ゾーン戦略により、あなたのトレーディングの旅を新たな高みに押し上げるように設計されています。 クォンタム ブレイクアウト インジケーターは、5 つの利益ターゲット ゾーンを備えたブレイクアウト ゾーン上のシグナル矢印と、ブレイクアウト ボックスに基づいたストップロスの提案を提供します。 初心者トレーダーにもプロのトレーダーにも適しています。 量子EAチャネル:       ここをクリック 重要!購入後、インストールマニュアルを受け取るためにプライベートメッセージを送ってください。 推奨事項: 時間枠: M15 通貨ペア: GBPJPY、EURJPY、USDJPY、NZDUSD、XAUUSD アカウントの種類: ECN、Raw、またはスプレッドが非常に低い R
Azimuth Pro
Ottaviano De Cicco
5 (7)
Azimuth Pro V2:MT5向けシンセティック・フラクタル構造分析と確認済みエントリー 概要 Azimuth Pro は Merkava Labs によるマルチレベルスイング構造インジケーターです。4つのネストされたスイングレイヤー、スイングアンカーVWAP、ABCパターン検出、3タイムフレーム構造フィルタリング、そして確定バーでの確認済みエントリー — 1つのチャートで、ミクロスイングからマクロサイクルまでを網羅するワークフロー。 これはブラインドシグナル製品ではありません。ロケーション、コンテキスト、タイミングを重視するトレーダーのための構造ファーストワークフローです。 V2発売記念オファー — Azimuth Pro V2をUSD 399で(次の100本)。最終価格:USD 499。 1. V2での変更点 シンセティック・マルチタイムフレームエンジン 上位タイムフレーム分析をMeridian Proと同じ独自のシンセティックアーキテクチャで一から再構築。よりクリーンなHTFコンテキスト、安定したライブ動作、従来のMTF同期問題なし。シンセティックエンジンは 固定比率タ
Meridian Pro
Ottaviano De Cicco
5 (2)
Meridian Pro 2.00:MT5向けプロ仕様マルチタイムフレーム・トレンドマトリクス Meridian Pro 2.00 は、MetaTrader 5 向けのプロ仕様の適応型トレンドマトリクスです。オリジナルの Meridian トレンドエンジン、クリーンなチャート ribbon、確定足ベースのシグナル矢印、8時間足 dashboard、Fuel momentum、weighted consensus、synthetic HTF processing、そしてチャート上に直接表示される上位足コンテキストラインを統合します。 目的はシンプルです。現在のトレンド、マルチタイムフレーム構造、強度、momentum、EA-ready 状態を、複数チャートに無関係なインジケータを重ねるのではなく、1つの整理された workflow で読むことです。 Meridian Pro の違い 1つの適応型エンジン - 同じ volatility-aware Meridian ロジックを M1 から W1 まで適用します。 Synthetic HTF architecture - 上位足行は下位足デ
まず第一に、この取引ツールはノンリペイント、ノンリドロー、ノンラグの指標であり、プロの取引に理想的ですことを強調する価値があります。 オンラインコース、ユーザーマニュアル、デモ。 スマートプライスアクションコンセプトインジケーターは、新米から経験豊富なトレーダーまで、非常 に強力なツールです。Inner Circle Trader AnalysisやSmart Money Concepts Trading Strategiesなど、20以上の有用な指標を1つに組み合わせています。このインジケーターはスマートマネーコンセプトに焦点を当て、大手機関の取引方法を提供し、彼らの動きを予測するのに役立ちます。 特に、流動性分析に優れており、機関がどのように取引しているかを理解しやすくしています。市場のトレンドを予測し、価格の動きを慎重に分析するのに優れています。機関の戦略とトレードを合わせることで、市場の動向についてより正確な予測ができます。このインジケーターは多目的であり、市場構造を分析し、重要な注文ブロックを特定し、さまざまなパターンを認識するのに優れています。 このインジケーター
FX Trend NG:次世代マルチマーケット・トレンドインテリジェンス 概要 FX Trend NG は、複数の時間足に対応したプロフェッショナル向けトレンド分析およびマーケット監視ツールです。 市場全体の構造を数秒で把握することができます。 複数のチャートを切り替える必要はありません。どの銘柄がトレンド中なのか、どこでモメンタムが弱まっているのか、そしてどの時間足で強い整合性があるのかを瞬時に確認できます。 ローンチ特別オファー – FX Trend NG を $30(6ヶ月) または $80 永久ライセンス でご利用いただけます。 すでに Stein Investments のユーザーですか? -> メッセージを送信 して、プライベートグループへアクセスしてください。 セットアップや詳細情報が必要ですか? -> Stein Investments 公式ページ をご覧ください。 1. FX Trend NG が他と異なる理由 3ステート・トレンドロジック ― Buy と Sell だけではない • 多くのインジケーターは Buy または Sell の2状態のみを表示します。
トレンド スクリーナー インジケーターでトレンド取引の力を解き放ちます。ファジー ロジックと複数通貨システムを活用した究極のトレンド取引ソリューションです。 ファジー ロジックを活用した革新的なトレンド インジケーターである Trend Screener を使用して、トレンド取引を向上させます。 これは、13 を超えるプレミアム ツールと機能、および 3 つの取引戦略を組み合わせた強力なトレンド追跡インジケーターであり、Metatrader をトレンド アナライザーにする多用途の選択肢となります。 期間限定オファー : トレンド スクリーナー インジケーターは、わずか 65 ドルで生涯ご利用いただけます。 (元の価格 50$ ) (オファー延長) Trend Screener の 100% 非再描画精度の揺るぎない精度を体験して、取引の決定が過去の価格変動の影響を受けないようにしてください。 マルチタイムフレームおよびマルチ通貨機能の多用途性を解放し、比類のない自信を持って外国為替、商品、暗号通貨、インデックスの世界を取引できるようにします。 Trend Screener の包括的な戦
多くの矢印インジケーターは、シグナルだけを表示して、その後の判断をすべてトレーダーに任せてしまいます。KT Alpha Hunter Arrows は、完整なトレードプランをチャート上に提示します。 各シグナル矢印が表示されるたびに、エントリーライン、ストップロス、4つのテイクプロフィット水準、そして現在の銘柄と時間足が今トレードに値するかどうかを示すリアルタイムのエッジ判定が、すでに描画された状態で表示されます。付属の Trade Manager EA は、あなたが手動でエントリーした後の実行管理を担当し、相場が荒れて判断がぶれやすい場面でも規律あるトレードを保ちやすくします。リペイントなし。確定足シグナルのみ。Forex、ゴールド、指数、その他あなたが取引するあらゆる銘柄に対応します。 主な機能 リペイントしない買い矢印と売り矢印を、足の確定後にのみ表示。 各シグナルに、エントリーライン、構造的ストップロス、4つのテイクプロフィット水準を表示。 Edge Dashboard が、現在のチャートで買いセットアップと売りセットアップを別々に評価。 判定システム:No Edge、Mar
GEM Signal Pro GEM Signal Pro は、MetaTrader 5 向けのトレンドフォロー型インジケーターです。より明確なシグナル、より整理されたトレードセットアップ、そして実用的なリスク管理をチャート上で確認したいトレーダーのために設計されています。 単純な矢印だけを表示するのではなく、GEM Signal Pro はトレード全体の考え方を、より見やすく分かりやすい形で表示します。条件が確認されると、インジケーターはエントリー価格、ストップロス、利確目標をチャート上に表示し、トレードセットアップをより効率的に確認できるようにします。 動作の仕組み このインジケーターは、まず内部ロジックに基づいて有効なシードシグナルを検出します。 確認条件が満たされると、GEM Signal Pro はチャート上に完全なセットアップを表示します。これにより、トレーダーはトレード構造をより明確に把握し、手作業による分析を減らすことができます。 チャート上のトレードレベル 確認済みシグナルに対して、GEM Signal Pro は以下を表示できます。 エントリー価格 ストップロス テ
これはMT5のインジケーターで、再描画なしで取引に参入するための正確なシグナルを提供します。 外国為替、暗号通貨、金属、株式、インデックスなど、あらゆる金融資産に適用できます。かなり正確な見積もりを提供し、取引を開始して終了するのに最適な時期を教えてくれます。1つのシグナルを処理しただけでインジケーターの元が取れた例の 動画 (6:22)をご覧ください。Entry PointsPro インジケーターの助けを借りたほとんどのトレーダーの最初の1週間の結果が改善しています。 Telegramグループ に登録してください。Entry Points Proインジケーターのメリットは次の通りです。 再描画のないエントリーシグナル 再描画されるインジケーターでは一度表示されたシグナルが削除されて大きな金銭的損失につながることがありますが、これと異なり、表示されて確認されたシグナルは消えることがありません。 エラーなしの取引開始 インジケーターアルゴリズムによって取引を開始する(資産を売買する)理想的な瞬間を見つけることができます。それを使用するすべてのトレーダーの成功率が向上します。 あら
このダッシュボードは、選択されたシンボルの最新の利用可能なハーモニックパターンを表示するので、時間を節約し、より効率的に /   MT4バージョン 。 無料インジケーター:   Basic Harmonic Pattern インジケーター列 Symbol : 選択したシンボルが表示されます。 Trend :   強気または弱気 Pattern : パターンの種類(ガートレー、バタフライ、バット、カニ、サメ、サイファー、ABCD) Entry : エントリー価格 SL: ストップロス価格 TP1: 1回目の利食い価格 TP2: 2回目の利食い価格 TP3:   3回目の利食い価格 Current price :   現在値 Age (in bars):    最後に描画されたパターンの年齢 主な入力項目 Symbols:   "28 Major Currency Pairs "または "Selected Symbols "から選択。 Selected Symbols:   カンマで区切られた監視したいシンボル("EURUSD,GBPUSD,XAUUSD")。ブローカーがペアに接
BTMM State Engine Pro is a MetaTrader 5 indicator for traders who use the Beat The Market Maker approach: Asian session context, kill zone timing, level progression, peak formation detection, and a multi-pair scanner from a single chart. It combines cycle state logic with a built-in scanner dashboard so you do not need the same tool on many charts at once. What it does Draws the Asian session range; session times can follow broker server offset or be set in inputs. Tracks level progression (L
Market Structure Order Block Dashboard MT5 は、市場構造と主要な価格反応ゾーンをチャート上で直接読み取りたいトレーダー向けに設計された MT5 インジケーターです。BOS、ChoCH、オーダーブロック、Fair Value Gap (FVG)、流動性、Kill Zones、Volume Profile、そして素早い分析のためのコンパクトなダッシュボードを組み合わせています。 本インジケーターは、市場構造、ICT、Smart Money の概念を意思決定の枠組みとして使用するトレーダーを対象としています。トレンド継続、反転の可能性、価格の不均衡、流動性ターゲット、注目ゾーンをより構造的に特定する助けとなります。 購入者向けの付属リソース 購入後、MQL5 のプライベートメッセージにてご依頼いただくと、完全な PDF ユーザーガイドとパラメータ設定のヒントを提供いたします。MQL5 のプライベートメッセージによる直接的な技術サポート。 バージョン 1.20 では 2 つの重要な追加機能があります: Pending BOS / Pending Cho
Trend Forecaster – Since 2023. The Trend Forecaster indicator utilizes a unique proprietary algorithm to determine entry points for a breakout trading strategy. The indicator identifies price clusters, analyzes price movement near levels, and provides a signal when the price breaks through a level. The Trend Forecaster indicator is suitable for all financial assets, including currencies (Forex), metals, stocks, indices, and cryptocurrencies. You can also adjust the indicator to work on any time
Quantum TrendPulse を ご紹介します。これは、   SuperTrend   、   RSI   、および Stochastic のパワーを 1 つの包括的なインジケーターに組み合わせて、取引の可能性を最大限に引き出す究極の取引ツールです。精度と効率を求めるトレーダー向けに設計されたこのインジケーターは、市場のトレンド、勢いの変化、最適なエントリー ポイントとエグジット ポイントを自信を持って特定するのに役立ちます。 主な特徴: SuperTrend 統合: 現在の市場動向に簡単に追従し、収益性の波に乗ることができます。 RSI精度: 買われすぎと売られすぎのレベルを検出し、市場の反転のタイミングに最適で、SuperTrendのフィルターとして使用されます。 確率的精度: 確率的振動を活用して、変動の激しい市場で隠れたチャンスを見つけます。SuperTrend のフィルターとして使用されます。 マルチタイムフレーム分析:   M5 から H1 または H4 まで、さまざまなタイムフレームで市場を常に把握します。 カスタマイズ可能なアラート: カスタム取引条件が満たされ
優れたテクニカルインジケーター「Grabber」をご紹介します。これは、すぐに使える「オールインワン」トレーディング戦略として機能します。 ひとつのコードに、市場のテクニカル分析ツール、取引シグナル(矢印)、アラート機能、プッシュ通知が強力に統合されています。 このインジケーターを購入された方には、以下の特典を無料で提供します: Grabberユーティリティ:オープンポジションを自動で管理するツール ステップバイステップのビデオマニュアル:インジケーターのインストール、設定、取引方法を解説 カスタムセットファイル:インジケーターをすばやく自動設定し、最大限の成果を出すための設定ファイル 他の戦略はもう忘れてください!Grabberだけが、あなたを新たなトレードの高みへと導いてくれるのです。 Grabber戦略の主な特徴: 推奨タイムフレーム:M5〜H4 対応通貨ペア・資産:どれでも使用可能ですが、私が実際に検証した以下を推奨します(GBPUSD、GBPCAD、GBPCHF、AUDCAD、AUDUSD、AUDSGD、AUDCHF、NZDUSD、NZDCAD、EURCAD、EURUSD、E
FX Power: 通貨の強弱を分析して、より賢い取引を実現 概要 FX Power は主要通貨と金の実際の強弱をあらゆる市場状況で理解するための必須ツールです。強い通貨を買い、弱い通貨を売ることで、 FX Power は取引の意思決定を簡素化し、高い確率の取引機会を見出します。トレンドを追従する場合でも、極端なデルタ値を使用して反転を予測する場合でも、このツールはあなたの取引スタイルに完全に適応します。ただ取引するだけではなく、 FX Power で賢く取引をしましょう。 1. なぜ FX Power がトレーダーにとって非常に有益なのか 通貨と金のリアルタイム強弱分析 • FX Power は主要通貨と金の相対的な強弱を計算し、マーケットダイナミクスに関する明確な洞察を提供します。 • どの資産がリードしているか、または後れを取っているかを監視して、取引するペアを賢く選びましょう。 マルチタイムフレームの包括的なビュー • 短期、中期、長期のタイムフレームで通貨と金の強弱を追跡し、マーケットトレンドに基づいて取引戦略を調整できます。 • スキャルピングからスイングトレード
まず第一に、この取引インジケーターは再描画されず、再描画されず、遅延しないことを強調する価値があります。これにより、手動取引とロボット取引の両方に理想的なものになります。 ユーザーマニュアル:設定、入力、戦略。 アトミックアナリストは、価格の強さとモメンタムを利用して市場でより良いエッジを見つけるためのPA価格アクションインジケーターです。ノイズや誤ったシグナルを除去し、取引ポテンシャルを高めるための高度なフィルターを備えています。複雑なインジケーターの複数のレイヤーを使用して、アトミックアナリストはチャートをスキャンし、複雑な数学的計算をシンプルなシグナルと色に変換します。これにより、どのような初心者トレーダーでも理解して使用し、一貫した取引の決定を行うことができます。 「アトミックアナリスト」は、新規および経験豊富なトレーダー向けにカスタマイズされた包括的な取引ソリューションです。プレミアムインジケーターとトップノッチの機能を1つの取引戦略に組み合わせ、すべてのタイプのトレーダーにとって汎用性のある選択肢にします。 デイリートレーディングとスキャルピング戦略:高速で正確なデイ
OrderFlux | MetaTrader 5 用フットプリント・オーダーフロー バージョン 2.0 – アクティブトレーダー向けのリアルタイム Bid/Ask 可視化 OrderFlux は MT5 用のフットプリントおよびオーダーフローインジケーターです。価格がどこに動いたかだけでなく、その動きの中で何が起きているか(各価格レベルの Bid/Ask ボリューム、デルタ、インバランス、ボリューム分布)を表示します。 多くのチャートはローソク足の最終結果しか表示しません。OrderFlux はそこに至るまでの過程を表示します。ローソク足の形状だけでなく、市場参加者の動向を読み取りたい場合にまさに役立ちます。 ライブチャートにおいて、OrderFlux は主に次の3つの質問に答えます: 現在、どこで積極的な買いまたは売りの圧力が市場に参入しているか? どの価格レベルでボリュームが吸収、または拒否されているか? 現在の動きはセッションのコンテキスト(背景)にどう適合しているか? インターフェースで得られるもの メインチャートは、Canvas ベースでフットプリントを直接レンダリングします
RelicusRoad Pro: 定量的市場オペレーティングシステム 【期間限定】無制限アクセス 70% OFF - 2,000人超のトレーダーと共に なぜ多くのトレーダーは「完璧な」インジケーターを使っても失敗するのでしょうか? それは、文脈を無視して 単一の概念 だけでトレードしているからです。文脈のないシグナルは単なるギャンブルです。勝ち続けるには、 根拠の重なり(コンフルエンス) が必要です。 RelicusRoad Proは単なる矢印インジケーターではありません。完全な 定量的市場エコシステム です。独自のボラティリティモデリングを用いて、価格が推移する「適正価値の道(Fair Value Road)」をマッピングし、ノイズと真の構造的ブレイクを判別します。 推測はやめましょう。機関投資家レベルの「ロード・ロジック」でトレードを。 コアエンジン:「Road」アルゴリズム システムの中心となる Road Algo は、市場環境にリアルタイムで適応するダイナミックなボラティリティチャネルです。 安全ライン(平衡点) と、価格が数学的に反転しやすい 拡張レベル を投影します。 Si
Hydra Trend Rider is a non-repainting, multi-timeframe trend indicator that delivers precise buy/sell signals and real-time alerts for high-probability trade setups. With its color-coded trend line, customizable dashboard, and mobile notifications, it's perfect for traders seeking clarity, confidence, and consistency in trend trading. Setup & Guide:  Download  MT4 Version here. To learn how to use the Indicator: Indicator Manual & Guide -   Read Here Follow our MQL5 channel for daily market ins
トレンドラインプロ   市場の真の方向転換点を理解するのに役立ちます。この指標は、真のトレンド反転と主要プレーヤーが再び参入するポイントを示します。 分かりますか     BOSライン   複雑な設定や不要なノイズなしに、より長い時間足でのトレンドの変化と重要なレベルを把握できます。シグナルは再描画されず、バーが閉じた後もチャート上に残ります。 MT4バージョン   -   RFI LEVELS PRO インジケーター と組み合わせることで、その最大限の能力を発揮します インジケーターが示す内容: 本当の変化   トレンド(BOSライン) 一度シグナルが現れたら、それは有効です!これは、リペイント機能を持つインジケーターとの重要な違いです。リペイント機能を持つインジケーターは、シグナルを発した後、それを変更し、資金の損失につながる可能性があります。これにより、より高い確率と精度で市場に参入できます。また、矢印が現れた後、目標値(利益確定)に達するか、反転シグナルが現れるまで、ローソク足の色を変更する機能もあります。 繰り返しエントリ   主要プレーヤーの補充 エントリーポイントを探す
作者のその他のプロダクト
Product Description: Adaptive Y-Axis Scaling is a powerful MT5 indicator designed to enhance your trading experience by providing precise control over the Y-axis (price) scaling of your charts. This innovative tool allows you to customize the price scaling by specifying the number of pips from the visible chart's highs and lows. The calculated price range from this input is then used to set the maximum and minimum prices for the open chart, ensuring an optimized and comprehensive view of market
FREE
Introducing the B4S BidLine CandleTimer An insightful indicator that combines real-time bid line visualization with a dynamic countdown timer. Gain a competitive edge in your trading as you stay informed about the time remaining until the next candle starts, all displayed seamlessly on your chart. Why B4S BidLine CandleTimer? Unleash the potential of your trading strategy with the B4S BidLine CandleTimer. Here's why this indicator stands out: Real-Time Bid Line: Witness market movements like nev
Brief Description: An advanced navigation, news display, and control panel indicator designed to revolutionize your chart analysis experience. Seamlessly navigate through timeframes, dates, and times with an intuitive control panel, and stay informed with visually represented detailed news events. Now with enhanced features and improvements for an even better trading experience. Key Features: User-Friendly Control Panel: Easily navigate through timeframes, dates, and times. Enable or disable the
Brief Description B4S Economic News Radar now offers enhanced features to keep traders informed and empowered. Experience comprehensive news coverage directly on your trading chart, including upcoming and past events, customizable reminders, and automatic time zone adjustments. Why News Events Matter: Market volatility triggered by economic indicators, central bank decisions, and geopolitical events can significantly impact trading outcomes. Stay ahead of these shifts with timely information and
Brief Description The indicator is a powerful tool based on Inner Circle Trader's trading theory. It strategically plots lines at key prices relative to time, highlighting crucial market moments such as Tokyo Open, New York Midnight, London Open, New York Open, New York 8:30 AM, and New York Session End. The indicator is built on the foundation of Inner Circle Trader's trading theory, emphasizing the significance of key open times as liquidity and reference zones. These zones act as magnets for
Brief Description The B4S_ICT_Killzones indicator is designed to enhance your trading strategy by highlighting key market times based on the Inner Circle Trader's (ICT) proven trading model. This indicator intelligently plots colored boxes around critical "killzone" periods, providing valuable insights into market behavior influenced by different geographical and time zone locations and time variations. Features / Indicator Settings 1. Killzone Identification Asian Range: Target the Asian tradin
Brief Description: The B4S_Institutional_Round_Number_Prices indicator identifies and marks key price levels, known as round number prices or institutional price levels, renowned for their psychological significance. These levels often influence institutional activity, attracting attention and triggering significant market moves.   Features: Round Number Price Identification: The indicator excels at identifying round number prices, providing you with crucial insights into potential market moveme
Brief Description The B4S PriceLevel Watcher is a useful indicator designed to empower traders with precise price level notifications. It allows users to set customizable notifications based on specific price types, such as close, high, low, ask, bid, or either ask or bid of the current candle.   Problem being solved In the ever-evolving world of trading, staying attuned to price movements is paramount. Traders need to remain vigilant, ready to act swiftly as market conditions change. However, t
フィルタ:
レビューなし
レビューに返信