AlarmLIne
- 指标
-
Adrian Hernandez Castellanos
 Ingeniero en computación con más de 25 años de experiencia en el sector de las tecnologías de la información con maestría en Gestión de Tecnologías de la información. He trabajado en una variedad de empresas, desde pequeñas startups hasta grandes corporaciones, en una variedad de roles, con un
 - 版本: 1.4
- 更新: 3 二月 2024
- 激活: 20
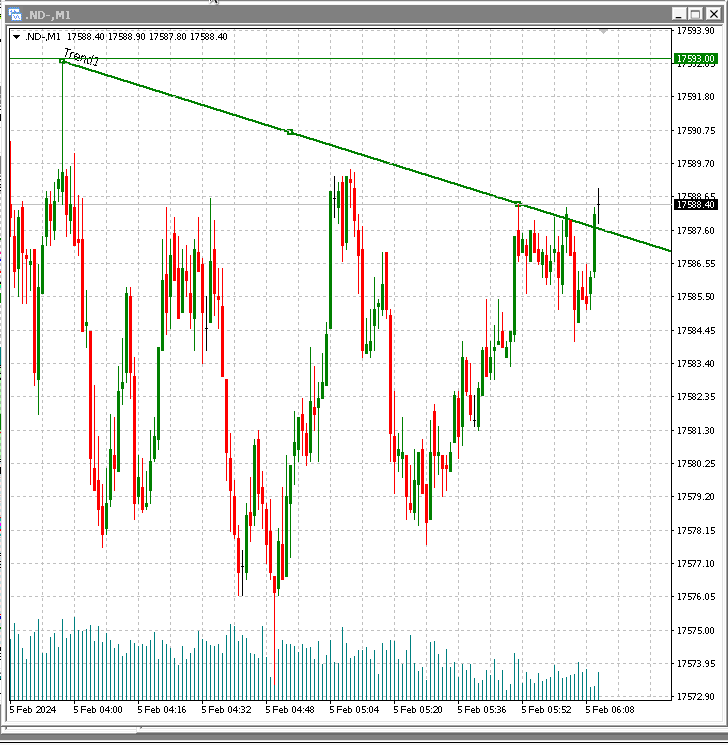
趋势线突破警报
描述:
该指标在价格突破趋势线时触发警报(声音、警报或通知),无论是在上方还是下方。
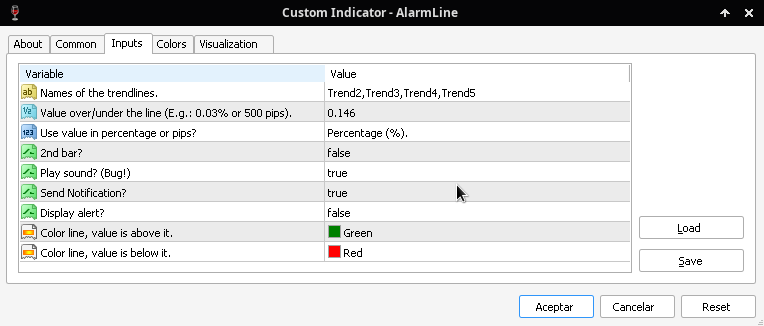
参数:
- Names of the trendlines.: 趋势线的名称,用逗号分隔(确保您的趋势线名称开头没有空格且准确)。
- Value over/under the line (E.g.: 0.03% or 500 pips).: 在触发警报之前定义趋势线上下方范围的值,可以根据以下参数以百分比或点数给出。
- Use value in percentage or pips?:定义前一个参数是按百分比还是按点数给出的。
- 2nd bar?:True,当有两根柱高于或低于趋势线时触发警报。
- Play sound? (Bug!):True,通过扬声器播放声音(有一个罕见的错误,正在分析中)。
- Send Notification?:True,将通知发送到 Options>Notifications 中配置的移动设备。
- Display alert?:True,在终端上显示警报。
- Color line, value is above it.: 当值高于趋势线时线的颜色。
- Color line, value is below it.: 当值低于趋势线时线的颜色。
笔记:
- 如果您认为任何更改可以帮助您或您发现任何错误,请在相应部分提及它们以进行修复。
- 限量免费下载 10 次。(配额已达,目前价格为 34.56 美元,截至 20240228 再持续几天)。