AlarmLIne

Trend Çizgisi Kırılma Uyarısı

Açıklama:

Bu gösterge, fiyat bir trend çizgisini yukarı veya aşağı kırdığında bir alarm (ses, uyarı veya bildirim) tetikler.

Parametreler:

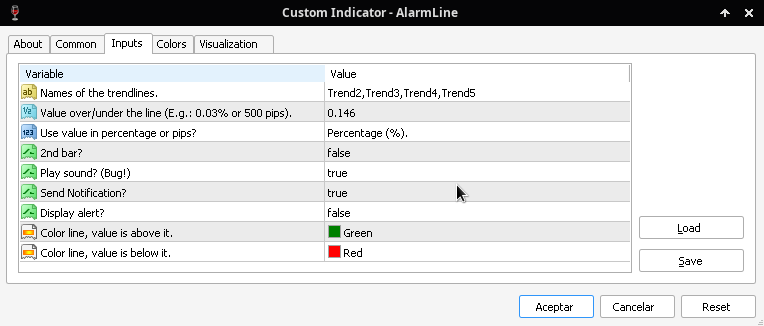
  • Names of the trendlines.: Virgüllerle ayrılmış trend çizgisi isimleri (Trend çizgisi adınızın başında boşluk olmadığından ve doğru olduğundan emin olun).
  • Value over/under the line (E.g.: 0.03% or 500 pips).: Alarmı tetiklemeden önce trend çizgisinin yukarıda/aşağıda bir marjı tanımlayan değer, bir sonraki parametreye bağlı olarak yüzde veya pip olarak verilebilir.
  • Use value in percentage or pips?: Önceki parametrenin yüzde olarak mı yoksa pip olarak mı verildiğini tanımlar.
  • 2nd bar?: True, trendin yukarıda veya aşağıda iki çubuk olduğunda alarmı tetikler.
  • Play sound? (Bug!): True, hoparlörden bir ses çalar (nadir bir hata var, şu anda analiz ediliyor).
  • Send Notification?: True, Options>Notifications'ta yapılandırılan mobil cihaza bir bildirim gönderir.
  • Display alert?: True, terminalde bir uyarı gösterir.
  • Color line, value is above it.: Değer çizginin üzerindeyken çizginin rengi.
  • Color line, value is below it.: Değer çizginin altındayken çizginin rengi.

Notlar:

  • Yardımcı olabilecek bir değişiklik düşünüyorsanız veya bir hata bulursanız, düzeltmek için ilgili bölümde bundan bahsedin.
  • 10 ücretsiz indirmeyle sınırlıdır. (Kota doldu, şu anki fiyat 20240228'e kadar birkaç gün daha 34,56$).

Önerilen ürünler
IQ FX Gann Levels a precision trading indicator based on W.D. Gann’s square root methods . It plots real-time, non-repainting support and resistance levels to help traders confidently spot intraday and scalping opportunities with high accuracy. William Delbert Gann (W.D. Gann) was an exceptional market analyst, whose trading technique was based on a complex blend of mathematics, geometry, astrology, and ancient mathematics which proved to be extremely accurate. Setup & Guide:  Download  MT5 Ver
HF SuperZig
Wong Sze Wai
5 (2)
This SuperZig indicator is special design for some trader trade with  ZigZag  and  Fibonacci . ( !!! NEW !!! +++ Support and Resistance +++ ) It will draw least two Fibonacci automatically in your chart period. Alerts when Created/Touced the Support/Resistance Box, it will send phone push/email notification to you at the same time. ZigZag + Fibo + BreakOutLine + SupportResistance = SuperZig !!! Input Parameter: " Show ZigZag " ::  Show ZigZag indicator with your own style ; " Show BreakOut Lin
The Best Choice compra y venta
Sandro Israel Hernandez Zamora
¿Has escuchado decir que la tendencia es tu amiga? pues nada es mas cierto en el mundo del trading. Este indicador analiza las tendencias y su fuerza para que puedas aprovecharlas y utilizamos un conjunto de indicadores como RSI, %W, MACD y EMAS para analizar el mercado y sus movimientos, por lo que podrás mantener tu gráfico limpio sabiendo que todos estos indicadores los tienes en uno solo. Este, como cualquier indicador, no representa una certeza de compra o venta definitiva, por lo siempre r
The indicator compares pattern found on chart history with the current price movement. Since history repeats itself, then, by comparing the two patterns, indicator can predict the further movement of the price. The indicator allows you to overlay highlighted history pattern with current movement and you will visually see this movement and will be able to compare the past and the present. To compare two patterns, you need: It is necessary to find and highlight a pattern on the history chart of a
ABCD Harmonic Patterns
Mehmet Ozhan Hastaoglu
Thanks to this indicator, you can easily see the new ABCD harmonic patterns in the chart. If the two price action lengths are equal, the system will give you a signal when it reaches the specified level. You can set the limits as you wish. For example, You can get the signal of the price, which occurs in the Fibonaci 38.2 and 88.6 retracements, and then moves for the same length, at the level you specify. For example, it will alarm you when the price reaches 80% as a percentage. In vertical
DoAid
Samuel Akinbowale
5 (1)
DoAid DoAid indicator is a simple channel indicator with an advance timeframe correlation board. DoAid indicator: can be used with any instrument provided by your broker and MetaTrader, be it Currency , Commodity ,Stock, or Cryptocurrencies. DoAid indicator   can be used for swing, scalping and day trading. DoAid indicator   is also a multi time-frame indicator {MTF}. DoAid indicator can be used with any timeframe. It does not repaint.It does not repaint. When To Buy if the market price is
KT Pin Bar
KEENBASE SOFTWARE SOLUTIONS
KT Pin Bar identifies the pin bar formation which is a type of price action pattern which depicts a sign of reversal or rejection of the trend. When combined with support and resistance, BRN and other significant levels, Pin Bar pattern proved to be a very strong sign of reversal. Basically, a pin bar is characterized by a small body relative to the bar length which is closed either in upper or lower 50% part of its length. They have very large wicks and small candle body. A pin bar candlestic
Super Signal Series – V6 PRO Advanced Breakout Scanner Dashboard Exclusive Bonus When you purchase  this indicator, you receive 2 professional Gold EAs: MT4 Gold EA XAU Trend Matrix EA – Worth $150  : See the EA     https://www.mql5.com/en/market/product/162870 MT5 Gold EA XAU Steady Gain Pro – Worth $150 : See the EA    https://www.mql5.com/en/market/product/162861 Total Bonus Value: $300 Advanced Breakout Scanner Dashboard Super Signal Series – V6 PRO is a professional multi-pair breakout scan
Limitless MT4
Dmitriy Kashevich
Limitless MT4 is a universal indicator suitable for every beginner and experienced trader. works on all currency pairs, cryptocurrencies, raw stocks Limitless MT4 - already configured and does not require additional configuration And now the main thing Why Limitless MT4? 1 complete lack of redrawing 2 two years of testing by the best specialists in trading 3 the accuracy of correct signals exceeds 80% 4 performed well in trading during news releases Trading rules 1 buy signal - the ap
Scalpers Zone – Nihai Arz/Talep + Stokastik Ret & Üçlü Dokunuş Göstergesi Scalpers Zone, yüksek olasılıklı scalping girişleri arayan traderlar için tasarlanmıştır. Günlük ve 7 günlük arz/talep bölgelerini tespit eder ve bu bölgelerin mükemmel şekilde hizalandığı alanları vurgular; böylece en güçlü potansiyel dönüş noktalarını işaretler. Kripto ve altın gibi volatil varlıklar için, bölge kalınlığı daha iyi görünürlük ve hassasiyet sağlamak amacıyla artırılabilir. Ana Özellikler: Hizalanmış Bölge
This indicator works on MT4 and is very easy to use. When you receive a signal from it, you wait for that candle with the signal to close and you enter your trade at the beginning of the next new candle . A red arrow means sell and a green arrow means buy. All arrows comes with Alert  like for easy identification of trade signal. Are you okay with that? 1 minute candle 1 minute expire
Acemi veya Profesyonel, en çok satan çok zaman dilimli Pivot Prof, alış ve satışlarınızı güzelleştirecek ve uzmanların kullandığı Destek ve Direnç katmanlarıyla size birinci sınıf değişim olanakları sunacaktır. Pivot alış ve satış, anahtar aralıklarda piyasaya giriş ve çıkış yapmak için kolay ve güzel bir tekniktir ve yetkililer tarafından uzun süredir kullanılmaktadır ve tüm semboller üzerinde çalışmaktadır: Forex, Kripto, Hisse Senetleri, Endeksler vb. Pivot Prof top getiriyor Katmanları bayi
NOTE: PRICE WILL RISE VERY SOON. DON'T SKIP THIS OFFER! Dear traders I am glad to introduce the " Market Swing Scanner Board" indicator to you. This indicator was made mainly to be used in combination with the Market Swing Index Indicator. You use the  "Market Swing Scanner Board"  indicator to scan for trading opportunities on the  Market Swing Index Indicator . This tool is designed for serious traders who have decided to make a difference through trading. Be the next person to witness this st
Automatic, live & interactive picture of all trendlines. Assign push, email and sound alerts to the lines of your choice and be informed about price rollback, breakout, rollback after breakout, number of rollbacks, line expiration by double breakout. Correct, drag or delete the lines and interactively tune the line system. https://youtu.be/EJUo9pYiHFA . Chart examples https: //www.mql5.com/en/users/efficientforex Price Interaction Events All events are effective immediately and only after one
The strategy works on the ECN account (5min and more) Inside bar :    with the direction of movement average 200 (you can change 200 it if you want). when the price is on the MA the indicator only gives the buy sign, and the opposite if the price is below the MA 1 Buy: The indicator draws a blue line, when a candle closes above that line and the price reverses towards the line, Buy from that blue line. Put the stop on the red line and the take profit on the yellow line TP1, or green line TP2 2
TrendControl is an arrow indicator of technical analysis for determining a trend, which can adjust to the price, is a graphical plot calculated using mathematical formulas, the initial data for which is a price chart. The indicator shows the direction of the trend, takes into account the minimum and maximum values ​​of the extreme candles on the chart, then brings them to the average and compares them with the past data. The principle of operation of the indicator is to automatically determine
Parabolik SAR ve Destek/Direnç Seviyeleri, forex ticaretinde potansiyel trend dönüşlerini ve giriş ve çıkış noktalarını belirlemek için kullanılan bir teknik analiz göstergesi olmakla kalmayıp aynı zamanda hazır bir otonom ticaret stratejisidir. Gösterge, grafiğe dinamik destek ve direnç seviyeleri ekleyerek PSAR göstergesini temel alır ve bu da yatırımcıların piyasanın potansiyel olarak tersine dönebileceği önemli fiyat seviyelerini belirlemesine yardımcı olabilir. Yatırımcılar bu göstergeyi
NO REPAINT ADVANCED CHART PATTERN INDICATOR By definition, a price ( chart)  pattern is a recognizable configuration of price movement that is identified using a series of  trendlines  and/or curves. When a price pattern signals a change in trend direction, it is known as a reversal pattern; a continuation pattern occurs when the trend continues in its existing direction following a brief pause. Advanced Chart Pattern Tracker is designed to find the MOST ACCURATE patterns. A special script is a
Some informations on the chart with the single attachment. RangeBorder Buy Sell (RBBS) Non Repaint Indicator will provide trend line, buy sell arrows,reversal arrows, range channel, order exit area,high average price line and low average price line.All arrows and lines don't repaint and not lagging. Once candle closed it won't  repaint. Reading Indicator: 1. Small Stars , Indicates oversold and overbought with certain logic and price may reverse when this small star triggers. Useful to identify
Introduction to Fractal Pattern Scanner Fractal Indicator refers to the technical indicator that makes use of the fractal geometry found in the financial market. Fractal Pattern Scanner is the advanced Fractal Indicator that brings the latest trading technology after the extensive research and development work in the fractal geometry in the financial market. The most important feature in Fractal Pattern Scanner is the ability to measure the turning point probability as well as the trend probabi
AMAN Signals
Niravkumar Maganbhai Patel
Introducing AMAN Signals. An MT4 Indicator that predicts the trend where the prices are heading! Indicator parameters Period 1 : the number of bars used for the indicator calculations. Proper values - Above 21. Multiplier 1 : Proper values - from: 5. Period 2 : the number of bars used for the indicator calculations. Proper values - Above 21. Multiplier 1 : Proper values - from: 5. Using the AMAN Signals FAST Indicator: Green: Buy or Bullish Candle Red: Sell or Bearish Candle Strength Percentag
POWER TO GET WEALTHY TRADING SYSTEMS.  NON REPAINT REVERSAL ARROW AND CHANNEL  Intra-Day trading and Scalping Strategy:   Designed for fast and accurate day trading and short-term trades. Day and Swing Trading Strategy:   Can be used as a reliable tool for day and swing traders who aim for the big moves of the price. Multi Currencies and Markets:   Works on different instruments and markets with its reliable precision. Multi Timeframes:   Can be used on multiple timeframes with good performanc
Breakout Candle
Dhabaleswar Prasad Jena
This indicator is based the principle of breakout candle. Every candle that breaks out from the cluster may not lead to a rally. There are various factors that determine how a breakout candle will behave. This indicator calculates all those factors to suggest BUY/SELL signal once a breakout happens. This is a universal indicator that can work for all kind of instruments eg stock, currency, oil, crypto etc. This also works in every timeframe. PARAMETERS ================= move = 20 strongCandle =
[Trend Line Pro 3]  Trend Line Pro 3 is a discretionary analysis indicator that visualizes swing structure based on Dow Theory / ZigZag concepts and organizes key lines (support/resistance and trendlines) as well as potential break/structure-change points (BreakEdge) directly on the chart. * This product is NOT an EA. It does not place trades or send orders. It helps you organize market structure with the same rules and align your decision criteria more consistently.
KT Renko Patterns MT4
KEENBASE SOFTWARE SOLUTIONS
2.33 (3)
KT Renko Patterns, Renko grafiğini tuğla tuğla tarayarak, farklı finansal piyasalarda yatırımcılar tarafından sıkça kullanılan popüler grafik formasyonlarını tespit eder. Zaman tabanlı grafiklerle karşılaştırıldığında, Renko grafiklerinde işlem yapmak daha kolay ve belirgindir çünkü grafik sade ve temiz bir yapıya sahiptir. KT Renko Patterns birçok Renko formasyonunu içerir ve bunların çoğu Prashant Shah'ın “Renko Grafikleriyle Karlı Ticaret” adlı kitabında ayrıntılı olarak açıklanmıştır. Bu g
KT 4 Timeframe Trend MT4
KEENBASE SOFTWARE SOLUTIONS
The KT 4 Time Frame Trend is an invaluable forex indicator for traders seeking to identify the trend direction across 4-time frames accurately. This innovative indicator allows users to simultaneously observe and analyze price trends across four different timeframes. Whether you're a beginner or an experienced trader, this tool offers an enhanced understanding of trend dynamics, leading to improved trading strategies on your trading platform. The capability to concurrently monitor multiple timef
Özel teklif : ALL TOOLS , her biri sadece $35 ! Yeni araçlar   $30   olacak, ilk   hafta   veya   ilk 3 alış için!  MQL5’te Trading Tools Kanalı : En son haberler için kanalıma katılın Deviation Trend Profile Scanner (DTPS), trend yönünü tespit eden, oynaklığı ölçen ve bir tablo içinde birden fazla sembol/zaman diliminden bilgileri düzenleyen bir göstergedir. Ayarlanabilir hareketli ortalama, uyarlanabilir standart sapma bölgeleri ve dağılım histogramı kullanarak fiyat davranışına dair istatist
Draw On Liquidity (DOL) – PDHL, PWHL & Kill Zones Liquidity levels often act as magnets for price movement. The highs and lows of the previous day (PDHL) and week (PWHL) are key reference points where stop orders and institutional activity tend to cluster. Identifying these levels manually is time-consuming and prone to error. The Draw On Liquidity (DOL) indicator automatically plots these essential levels on your chart and highlights high-probability trading windows through session kill zones.
Indicator plots price cycle blocks and sends signals with smart volume confirmation. Price cycles and fractals are combined to determine the demand/supply blocks. The indicator can be used alone or combined with other Cycle Indicators Inputs: Period: Recommended value is between 35 and 55( Which are Set 1 and Set 2 periods of cycle sniper ) Engulfing: If true, you will be able to see the engulfing bar confirmation. Volume Filter: True (The  arrow comes with volume confirmation ) Videos with dif
BONUS INDICATOR HERE :  https://linktr.ee/ARFXTools Trading Flow Using Fibo Eminence Signal 1️⃣ Wait for the Fibonacci to Auto-Draw The system automatically detects swings (from high to low or vice versa) Once the Fibonacci levels appear, the indicator sends an alert notification “Fibonacci detected! Zone is ready.” 2️⃣ Check the Entry Zone Look at the ENTRY LINE (blue zone) This is the recommended SELL entry area (if the Fibonacci is drawn from top to bottom) Wait for the price to enter
Bu ürünün alıcıları ayrıca şunları da satın alıyor
Miraculous Göstergesi – Gann Dokuz Kareye Dayalı %100 Tekrarlamayan Forex ve İkili Araç Bu video, Forex ve İkili Opsiyon traderları için özel olarak geliştirilmiş son derece doğru ve güçlü bir ticaret aracı olan Miraculous Göstergesi 'ni tanıtıyor. Bu göstergeyi benzersiz kılan, efsanevi Gann Dokuz Karesi ve Gann Titreşim Yasası 'na dayanmasıdır; bu da onu modern ticarette mevcut en hassas tahmin araçlarından biri yapmaktadır. Miraculous Göstergesi tamamen tekrarlamaz ; yani mum kapandıktan son
Gann Made Easy
Oleg Rodin
4.83 (155)
Gann Made Easy , bay teorisini kullanarak ticaretin en iyi ilkelerine dayanan, profesyonel ve kullanımı kolay bir Forex ticaret sistemidir. WD Gann. Gösterge, Zararı Durdur ve Kâr Al Seviyeleri dahil olmak üzere doğru SATIN AL ve SAT sinyalleri sağlar. PUSH bildirimlerini kullanarak hareket halindeyken bile işlem yapabilirsiniz. LÜTFEN ÜCRETSİZ OLARAK TİCARET İPUÇLARI, BONUSLAR VE GANN MADE EA ASİSTANI ALMAK İÇİN SATIN ALIMDAN SONRA BENİMLE İLETİŞİME GEÇİN! Muhtemelen Gann ticaret yöntemlerini b
M1 Sniper
Oleg Rodin
5 (18)
M1 SNIPER kullanımı kolay bir işlem göstergesi sistemidir. M1 zaman dilimi için tasarlanmış bir ok göstergesidir. Gösterge, M1 zaman diliminde scalping için bağımsız bir sistem olarak kullanılabilir ve mevcut işlem sisteminizin bir parçası olarak kullanılabilir. Bu işlem sistemi özellikle M1'de işlem yapmak için tasarlanmış olsa da, diğer zaman dilimleriyle de kullanılabilir. Başlangıçta bu yöntemi XAUUSD ve BTCUSD ticareti için tasarladım. Ancak bu yöntemi diğer piyasalarda işlem yaparken de ya
Meravith
Ivan Stefanov
5 (2)
Market maker aracı. Meravith şunları yapar: Tüm zaman dilimlerini analiz eder ve geçerli trendi gösterir. Alış ve satış hacimlerinin eşit olduğu likidite bölgelerini (hacim dengesi) vurgular. Farklı zaman dilimlerinden tüm likidite seviyelerini doğrudan grafiğinizde gösterir. Referansınız için metin tabanlı piyasa analizi üretir ve sunar. Mevcut trende göre hedefler, destek seviyeleri ve stop-loss noktalarını hesaplar. İşlemleriniz için risk/ödül oranını hesaplar. Hesap bakiyenize göre pozisyon
RFI levels PRO
Roman Podpora
5 (1)
Önceden gösterge   Piyasa dönüş seviyelerini ve bölgelerini belirler , fiyatın seviyeye geri dönmesini beklemenize ve yeni bir trendin başlangıcında, sonunda değil, işleme girmenize olanak tanır. Gösteriyor   tersine çevirme seviyeleri       Piyasanın yön değişikliğini teyit ettiği ve daha fazla hareket oluşturduğu yer. Bu gösterge yeniden çizim gerektirmeden çalışır, her türlü enstrüman için optimize edilmiştir ve en yüksek potansiyelini bir enstrümanla birlikte kullanıldığında ortaya koyar.
Game Changer Indicator
Vasiliy Strukov
4.37 (19)
Game Changer è un indicatore di tendenza rivoluzionario, progettato per essere utilizzato su qualsiasi strumento finanziario, per trasformare il tuo MetaTrader in un potente analizzatore di trend. Funziona su qualsiasi intervallo temporale e aiuta a identificare i trend, segnala potenziali inversioni, funge da meccanismo di trailing stop e fornisce avvisi in tempo reale per risposte tempestive del mercato. Che tu sia un professionista esperto o un principiante in cerca di un vantaggio, questo st
TPSpro RFI Levels
Roman Podpora
4.85 (27)
TALİMATLAR RUS  /  TALİMATLAR   ENG  /  Sürüm MT5 Ana fonksiyonları: Satıcı ve alıcıların aktif bölgelerini görüntüler! Gösterge, satın alma ve satışlar için tüm doğru ilk dürtü seviyelerini/bölgelerini görüntüler. Giriş noktaları arayışının başladığı bu seviyeler/bölgeler etkinleştirildiğinde, seviyeler renk değiştirir ve belirli renklerle doldurulur. Ayrıca, durumun daha sezgisel bir şekilde algılanması için oklar görünür. LOGIC AI - Bir şablonu etkinleştirirken giriş noktalarını aramak için
PRO Renko Sistemi, RENKO grafikleri ticareti için özel olarak tasarlanmış son derece hassas bir ticaret sistemidir. Bu, çeşitli ticaret araçlarına uygulanabilen evrensel bir sistemdir. Sistemi etkin piyasa sana doğru ters sinyallerine erişim hakkı denilen ses nötralize eder. Göstergenin kullanımı çok kolaydır ve sinyal üretiminden sorumlu tek bir parametreye sahiptir. Aracı, seçtiğiniz herhangi bir ticaret aracına ve renko çubuğunun boyutuna kolayca uyarlayabilirsiniz. Yazılımımla karlı bir
GoldRush Trend Ok Sinyali GoldRush Trend Ok Sinyali göstergesi, XAU/USD'de yüksek hızlı, kısa vadeli scalperlar için özel olarak tasarlanmış hassas, gerçek zamanlı trend analizi sağlar. 1 dakikalık zaman dilimi için özel olarak tasarlanan bu araç, net giriş noktaları için yön okları gösterir ve scalper'ların değişken piyasa koşullarında güvenle hareket etmelerini sağlar. Gösterge, PRIMARY ve SECONDARY uyarı oklarından oluşur. PRIMARY sinyalleri, trend yönündeki değişikliği gösteren Beyaz ve
First 25 copies at $80, after that price becomes $149 (3 copies left) Gold Signal Pro is a powerful MT4 indicator designed to help traders spot strong price reactions in the market. It focuses on clear wick rejections , showing when price strongly rejects a level and often continues in the same direction. Gold Signal Pro is mainly built for scalping gold (XAUUSD) and works best on lower timeframes like M5 and M15 , where timing matters most. That said, it can also be used on any forex pair, a
Trend indicator AI
Ramil Minniakhmetov
4.65 (80)
Trend Ai göstergesi, trend tanımlamasını işlem yapılabilir giriş noktaları ve geri dönüş uyarılarıyla birleştirerek bir yatırımcının piyasa analizini geliştirecek harika bir araçtır. Bu gösterge, kullanıcıların forex piyasasının karmaşıklıklarında güvenle ve hassasiyetle yol almalarını sağlar. Birincil sinyallerin ötesinde, Trend Ai göstergesi geri çekilmeler veya düzeltmeler sırasında ortaya çıkan ikincil giriş noktalarını belirleyerek, yatırımcıların belirlenen trend içindeki fiyat düzeltmele
Trend Screener
STE S.S.COMPANY
4.79 (95)
Trend Göstergesi, Trend Alım Satım ve Filtreleme için Çığır Açan Benzersiz Çözüm, Tüm Önemli Trend Özellikleriyle Tek Bir Araç İçinde Yerleştirildi! Forex, emtialar, kripto para birimleri, endeksler ve hisse senetleri gibi tüm sembollerde/araçlarda kullanılabilen %100 yeniden boyamayan çoklu zaman çerçevesi ve Çoklu para birimi göstergesidir. SINIRLI SÜRELİ TEKLİF: Destek ve Direnç Tarama Göstergesi sadece 50$ ve ömür boyu mevcuttur. (Orijinal fiyat 250$) (teklif uzatıldı) Trend Screener, grafik
Trend Lines PRO
Roman Podpora
5 (1)
TREND ÇİZGİLERİ PRO     Piyasanın gerçek yön değişimini anlamaya yardımcı olur. Gösterge, gerçek trend dönüşlerini ve büyük oyuncuların piyasaya yeniden girdiği noktaları gösterir. Anlıyorsun     BOS hatları  Daha yüksek zaman dilimlerindeki trend değişiklikleri ve önemli seviyeler, karmaşık ayarlar veya gereksiz gürültü olmadan gösterilir. Sinyaller yeniden çizilmez ve çubuk kapandıktan sonra grafikte kalır. VERSION MT 5     -    RFI LEVELS PRO  göstergesiyle birlikte kullanıldığında maksimum p
Currency Strength Wizard , başarılı ticaret için size hepsi bir arada çözüm sağlayan çok güçlü bir göstergedir. Gösterge, birden çok zaman dilimindeki tüm para birimlerinin verilerini kullanarak şu veya bu forex çiftinin gücünü hesaplar. Bu veriler, şu veya bu para biriminin gücünü görmek için kullanabileceğiniz, kullanımı kolay para birimi endeksi ve para birimi güç hatları biçiminde temsil edilir. İhtiyacınız olan tek şey, işlem yapmak istediğiniz tabloya göstergeyi eklemektir ve gösterge size
Gold Scalper Super
Aleksandr Makarov
5 (2)
Gold Scalper Super is an easy-to-use trading system. The indicator can be used as a standalone scalping system on the M1 time frame, as well as part of your existing trading system. Bonus: when purchasing an indicator, Trend Arrow Super is provided free of charge, write to us after purchase. The indicator 100% does not repaint!!! If a signal appears, it does not disappear! Unlike indicators with redrawing, which lead to the loss of a deposit, because they can show a signal and then remove it.
Presenting one-of-a-kind Gann Indicator for XAUUSD IQ Gold Gann Levels is a non-repainting, precision tool designed exclusively for XAUUSD/Gold intraday trading. It uses W.D. Gann’s square root method to plot real-time support and resistance levels, helping traders spot high-probability entries with confidence and clarity. William Delbert Gann (W.D. Gann) was an exceptional market analyst whose trading technique was based on a complex blend of mathematics, geometry, astrology, and ancient calcul
ŞU ANDA %40INDIRIMLI Yeni Başlayanlar veya Uzman Tüccarlar için En İyi Çözüm! Bu Gösterge benzersiz, yüksek kaliteli ve uygun fiyatlı bir ticaret aracıdır çünkü bir dizi tescilli özellik ve yeni bir formül ekledik. Sadece BİR grafik ile 28 Forex çifti için Döviz Gücünü okuyabilirsiniz! Yeni bir trendin veya scalping fırsatının tam tetik noktasını belirleyebildiğiniz için ticaretinizin nasıl gelişeceğini hayal edin? Kullanım kılavuzu: buraya tıklayın Bu ilk olan, orijinal! Değersiz bir özent
Smc Blast Signal
Mohit Dhariwal
5 (3)
Full Fledged EA and Alert plus for alerts will also be provided in this offer along with the purchase of Indicator. Limited copies only at this price and Ea too. Grab your copy soon Alert plus for indicator with set file is kept in comment section with the image  SMC Blast Signal with FVG, BOS and trend Breakout The SMC Blast Signal is a Precise trading system for Meta Trader 4 that uses Smart Money Concepts (SMC), including Fair Value Gaps (FVG) and Break of Structure (BOS), to identify high-pr
Pulse Scalping Line - an indicator for identifying potential pivot points. Based on this indicator, you can build an effective Martingale system. According to our statistics, the indicator gives a maximum of 4 erroneous pivot points in a series. On average, these are 2 pivot points. That is, the indicator shows a reversal, it is erroneous. This means that the second signal of the indicator will be highly accurate. Based on this information, you can build a trading system based on the Martingale
Pip Storm Signal
Camila Bernardez Camero
PIP STORM Sinyali PIP STORM , volatil piyasa koşullarında ultra sık işlem yapılmasını sağlamak üzere tasarlanmış, ok tabanlı gelişmiş bir sistemdir. Ana amacı, geciken veya aşırı kullanılan göstergelere dayanmadan sürekli işlem yapılabilir scalping sinyalleri üretmektir. Tahmin etmez — fiyat geçiş bölgelerine kesin şekilde tepki verir, mikro kırılmaları ve likidite dengesizliklerini gerçek zamanlı, minimalist bir onay motoruyla tespit eder. Güncel Kalın Yeni sürümler ve güncellemelerden habe
Volatility Trend System - girişler için sinyaller veren bir ticaret sistemi. Oynaklık sistemi, trend yönünde doğrusal ve noktasal sinyaller ve ayrıca yeniden çizme ve gecikme olmaksızın trendden çıkmak için sinyaller verir. Trend göstergesi, orta vadeli trendin yönünü izler, yönünü ve değişimini gösterir. Sinyal göstergesi volatilitedeki değişikliklere dayalıdır ve piyasa girişlerini gösterir. Gösterge, çeşitli uyarı türleri ile donatılmıştır. Çeşitli alım satım araçlarına ve zaman dilimlerine
Apollo SR Master , Destek/Direnç bölgelerinde alım satımı daha kolay ve güvenilir hale getiren özelliklere sahip bir Destek/Direnç göstergesidir. Gösterge, yerel fiyat zirvelerini ve diplerini tespit ederek Destek/Direnç bölgelerini herhangi bir gecikme olmadan gerçek zamanlı olarak hesaplar. Ardından, yeni oluşan Destek/Direnç bölgesini doğrulamak için, Destek/Direnç bölgesinin dikkate alınabileceğini ve gerçek bir SAT veya AL sinyali olarak kullanılabileceğini gösteren özel bir sinyal gösterir
Bu gösterge paneli, seçilen semboller için mevcut en son harmonik kalıpları gösterir, böylece zamandan tasarruf edersiniz ve daha verimli olursunuz / MT5 sürümü . Ücretsiz Gösterge: Basic Harmonic Pattern Gösterge sütunları Symbol : seçilen semboller görünecektir Trend: yükseliş veya düşüş Pattern : desen türü (gartley, kelebek, yarasa, yengeç, köpekbalığı, cypher veya ABCD) Entry : giriş fiyatı SL: zararı durdur fiyatı TP1: 1. kar alma fiyatı TP2: 2. kar alma fiyatı TP3: 3. kar alma fiyatı
- Real price is 200$ - 50% Discount (It is 99$ now) -   It is enabled for 3 purchases. Contact me for extra bonus (Gann Trend   indicator), instruction or any questions! - Non-repaint, No lag - I just sell my products in Elif Kaya Profile, any other websites are stolen old versions, So no any new updates or support. - Lifetime update free Gann Gold EA MT5 Introduction W.D. Gann’s theories in technical analysis have fascinated traders for decades. It offers a unique approach beyond traditional c
Şu anda %40 İNDİRİMLİ! Herhangi bir Acemi veya Uzman Tüccar için En İyi Çözüm! Bu gösterge paneli yazılımı 28 döviz çifti üzerinde çalışıyor. Ana göstergelerimizden 2'sine (Gelişmiş Para Birimi Gücü 28 ve Gelişmiş Para Birimi Dürtüsü) dayanmaktadır. Tüm Forex piyasasına harika bir genel bakış sağlar. Gelişmiş Para Birimi Gücü değerlerini, para birimi hareket hızını ve tüm (9) zaman dilimlerinde 28 Forex çifti için sinyalleri gösterir. Trendleri ve / veya scalping fırsatlarını belirlemek için
Scalper Inside PRO
Alexey Minkov
4.74 (69)
* VALENTINE’S DAY 20% SALE * LIMITED TIME OFFER * An exclusive indicator that utilizes an innovative algorithm to swiftly and accurately determine the market trend. The indicator automatically calculates opening, closing, and profit levels, providing detailed trading statistics. With these features, you can choose the most appropriate trading instrument for the current market conditions. Additionally, you can easily integrate your own arrow indicators into Scalper Inside Pro to quickly evaluate
Advanced Arrow
Alfred Kamal
3.9 (39)
This indicator depends on some secrets equations to draw Signals with Stop loss and maximum 4 Take profits. There is a free EA depends on this indicator as a gift when you purchase/rent it. Features Simply it gives you entry point as Ready sign (Buy / Sell) and arrow (Buy / Sell) after candle closed, also SL line and 4 TP lines or less. Once SL-TP lines are shown with the arrow, they remains as they are until signal change. It is historical indicator. No Repaint. user manual for V5 please click
MetaForecast M4
Vahidreza Heidar Gholami
5 (2)
MetaForecast, fiyat verilerindeki harmonileri kullanarak herhangi bir piyasanın geleceğini tahmin eder ve görselleştirir. Piyasa her zaman tahmin edilemezken, fiyatlarda bir desen varsa, MetaForecast geleceği mümkün olduğunca doğru bir şekilde tahmin edebilir. Benzer ürünlere göre, MetaForecast piyasa eğilimlerini analiz ederek daha kesin sonuçlar üretebilir. Giriş Parametreleri Past size (Geçmiş boyut) MetaForecast'ın gelecekteki tahminler oluşturmak için kullandığı çubuk sayısını belirtir. Mo
Scalper Vault
Oleg Rodin
5 (35)
Scalper Vault , başarılı bir scalping için ihtiyacınız olan her şeyi size sağlayan profesyonel bir scalping sistemidir. Bu gösterge, forex ve ikili opsiyon tüccarları tarafından kullanılabilecek eksiksiz bir ticaret sistemidir. Önerilen zaman çerçevesi M5'tir. Sistem size trend yönünde doğru ok sinyalleri sağlar. Ayrıca size üst ve alt sinyaller ve Gann piyasa seviyeleri sağlar. Göstergeler, PUSH bildirimleri dahil her türlü uyarıyı sağlar. Göstergeyi satın aldıktan sonra lütfen benimle iletişim
FX Power MT4 NG
Daniel Stein
4.95 (21)
FX Power: Daha Akıllı Ticaret Kararları için Para Birimlerinin Gücünü Analiz Edin Genel Bakış FX Power , her piyasa koşulunda başlıca para birimlerinin ve altının gerçek gücünü anlamak için vazgeçilmez bir araçtır. Güçlü para birimlerini alıp zayıf olanları satarak, FX Power ticaret kararlarınızı basitleştirir ve yüksek olasılıklı fırsatları ortaya çıkarır. İster trendlere sadık kalın ister Delta'nın aşırı değerlerini kullanarak tersine dönüşleri öngörün, bu araç ticaret tarzınıza mükemmel bir
Yazarın diğer ürünleri
MACD Color Script
Adrian Hernandez Castellanos
5 (1)
(Sürükle ve bırak) MACD göstergesinin arka planını alım veya satım trendine göre renklendiren bir komut dosyası. Değiştirebileceğiniz parametreler, MetaTrader MACD göstergesinin sağladığı parametrelerle aynıdır ve ayrıca tercihlerinize göre en uygun renkleri düzenlemek için gerekli olanlardır. Değiştirebileceğiniz parametreler şunlardır:     Fast EMA     Slow EMA     MACD SMA     Apply To     Color Positive Trend     Color Negative Trend     Color Neutral Trend     Save variables (Geçerli değerl
FREE
ADX Color Script
Adrian Hernandez Castellanos
Ortalama Yön Hareketi Endeksi (ADX) göstergesinin arka planını alım veya satım trendine göre renklendiren sürükle ve bırak betiği Ortalama Yön Hareketi Endeksi (ADX) göstergesi, bir trendin gücünü ölçmek için kullanılan bir teknik göstergedir. Bu sürükle ve bırak betiği, ADX göstergesinin arka planını alım veya satım trendine göre renklendirir. Arka plan rengi, betiğin parametreleri tarafından belirlenir. Değiştirilebilir parametreler: Period: ADX göstergesinin zaman aralığıdır. Level: Trendin y
Stoch Color Indicator
Adrian Hernandez Castellanos
Stokastik Osilatör Renklendirme Bu gösterge, göstergenin trendine göre arka planı renklendirir. Gösterge, %K ve %D değerlerine göre arka planı renklendirir. Trend yukarı veya aşağı yönlü olsun, arka plan rengi stokastik osilatör parametreleri tarafından belirlenir. Ancak, yalnızca son 400 çubuk çizilir (notlara bakın). Değiştirilebilir parametreler: %K Period : %K dönemi %D Period: %D dönemi Slowing: Yavaşlama dönemi Price Field : Low/High, Close/Close MA Method: Simple, Exponential, Smoothed, L
Stoch Color Script
Adrian Hernandez Castellanos
Bu komut dosyası (Sürükle ve bırak), alım veya satım eğilimine göre stokastik osilatörün arka planını renklendirir. Arka plan rengi, gösterge çizgilerinin konumuna göre belirlenir. Değiştirilebilecek parametreler şunlardır: %K Period: %K dönemidir. %D Period: %D dönemidir. Slowing: Yavaşlama dönemidir. Price Field : Low/High veya Close/Close. MA Method: Simple, Exponential, Smoothed, Linear weighted. Color Positive Trend: Yükselen eğilimin arka plan rengidir. Color Negative Trend: Düşmekte
ADX Color Indicator
Adrian Hernandez Castellanos
Ortalama Yönlü Hareket İndeksi (Average Directional Movement Index- ADX) göstergesi, alım veya satım trendine göre arka planı renklendirir. ADXColor göstergesi, bir trendin gücünü ölçmek için kullanılan bir teknik göstergedir. Göstergenin arka plan rengi, parametreleri tarafından belirlenir ve yalnızca son 400 çubuğu boyar. Değiştirebileceğiniz parametreler şunlardır: Period: ADX göstergesinin zaman periyodu. Trend Level: ADX göstergesinin yükseliş veya düşüş trendi olarak kabul edilmesi için ul
MACD Color Indicator
Adrian Hernandez Castellanos
MACD göstergesi ile satın alma veya satış eğilimini renklendirme Bu gösterge, MACD (Moving Average Convergence Divergence) göstergesinin değerine göre grafiğin arka planını renklendirir. Arka plan rengi, eğilimin gücünü ve tersine dönme olasılığını ölçmek için kullanılır. Göstergeyi kullanma Göstergeyi MetaTrader platformuna yükleyin. Ardından, grafiğin üzerine sürükleyip bırakın. Ayarlar Göstergenin aşağıdaki ayarlarını değiştirebilirsiniz: Fast EMA: Hızlı EMA'nın periyodu. Slow EMA: Yav
Filtrele:
İnceleme yok
İncelemeye yanıt