SX Chart Tools
- 指标
-
Nikolett Gorjanacz Toth
 SizerX – risk and trade management tools for MetaTrader 5.
Built by a trader, for traders: position sizing, trade management, pyramiding and prop firm protection in one clean panel. Every feature is tested on live and Strategy Tester charts before release. - 版本: 1.0
- 激活: 10
SX Chart Tools for MetaTrader 5
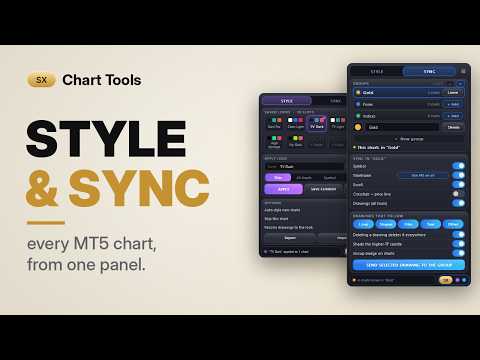
SX Chart Tools was made out of the everyday mess of working with several charts in MetaTrader 5. Every chart lives on its own: colours have to be set one by one, templates and saved profiles only help so far, and nothing keeps the charts in step when you change the symbol, scroll back or draw a zone. SX Chart Tools puts all of this on one small panel.
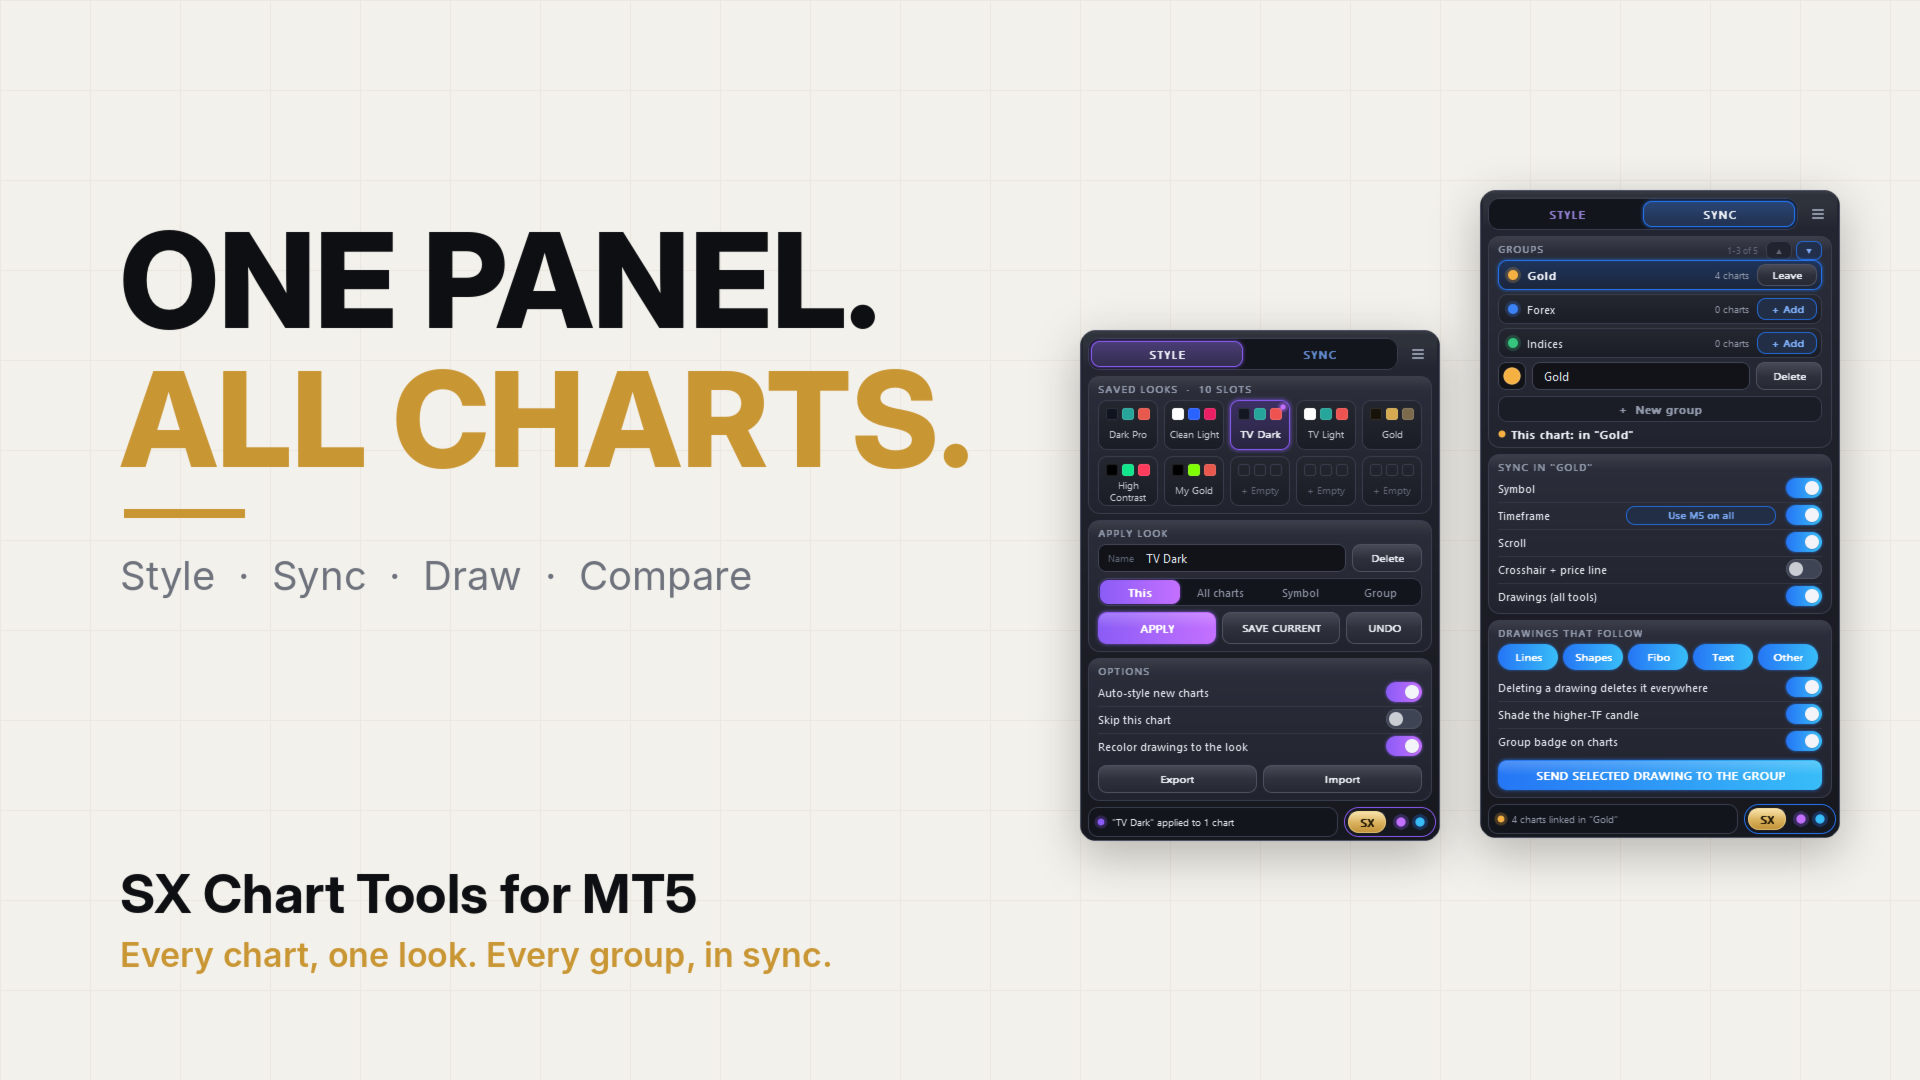
STYLE - one look for all your charts
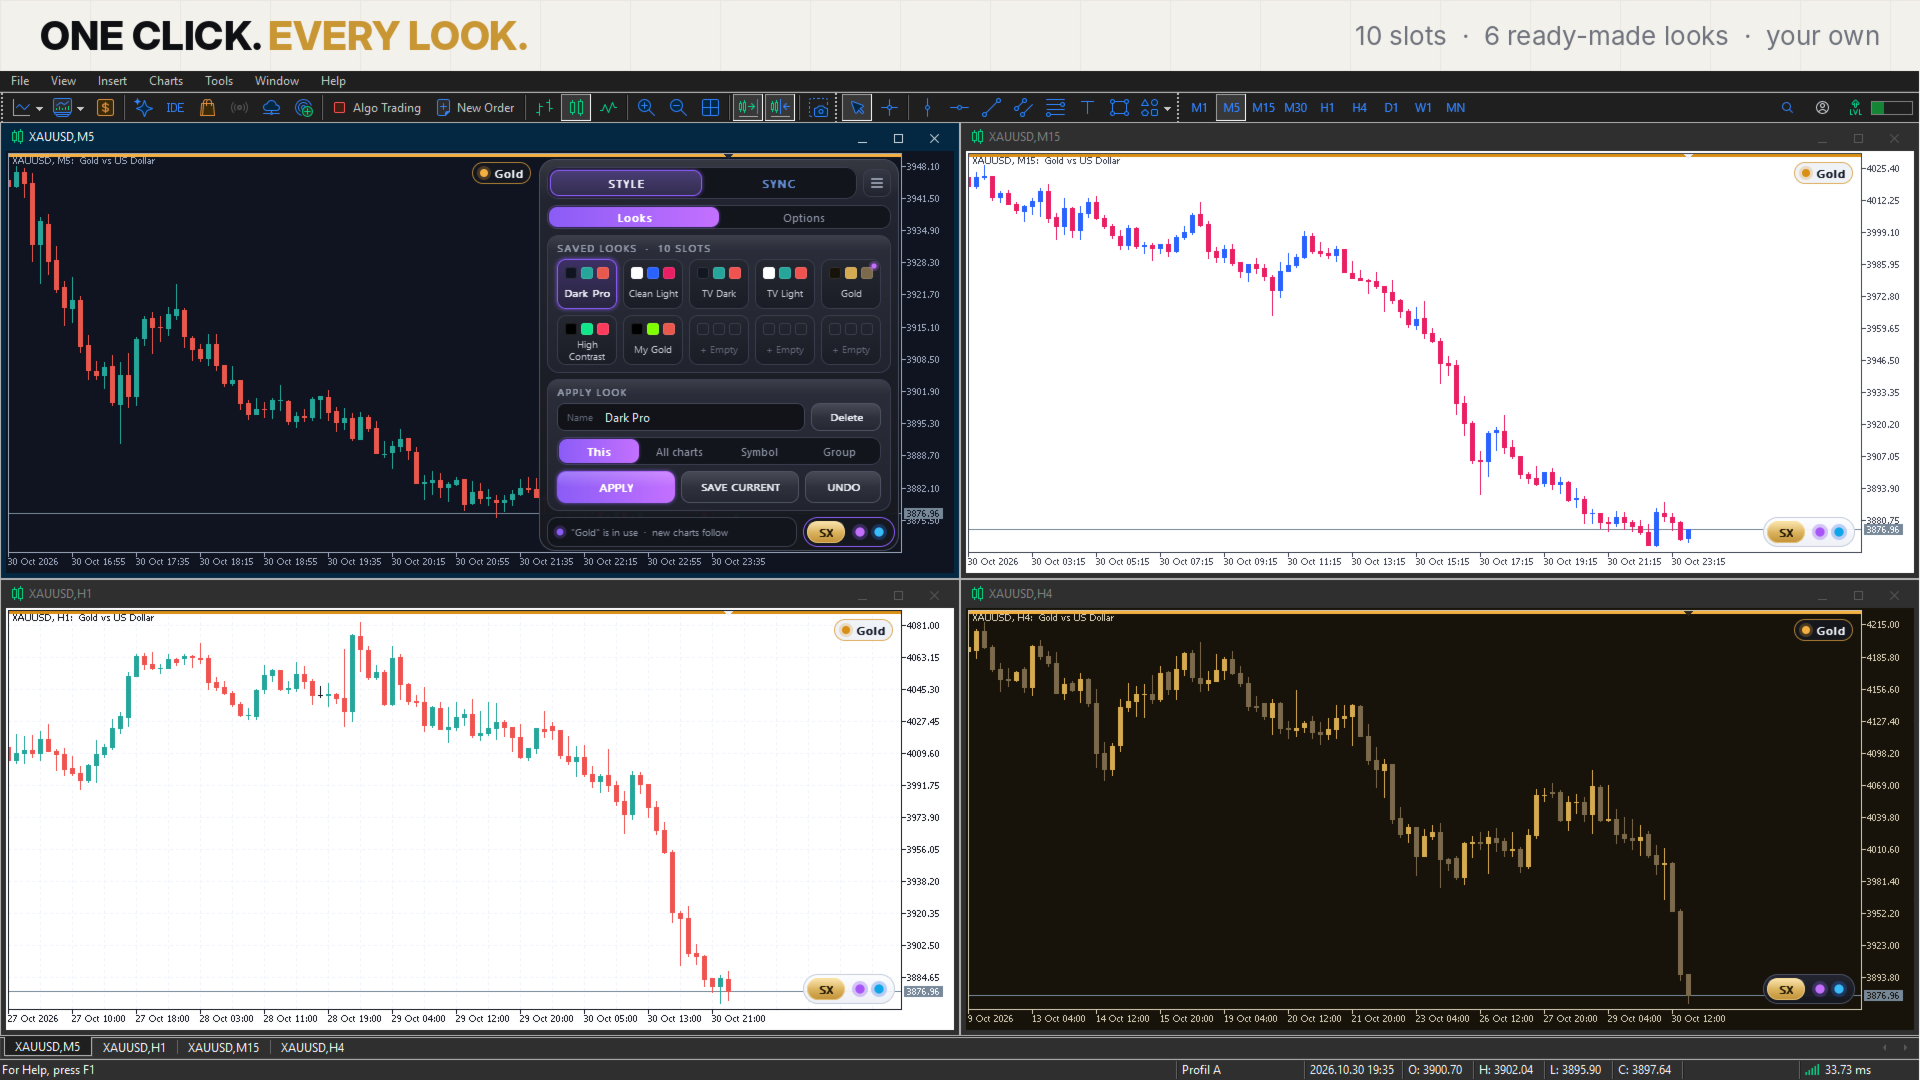
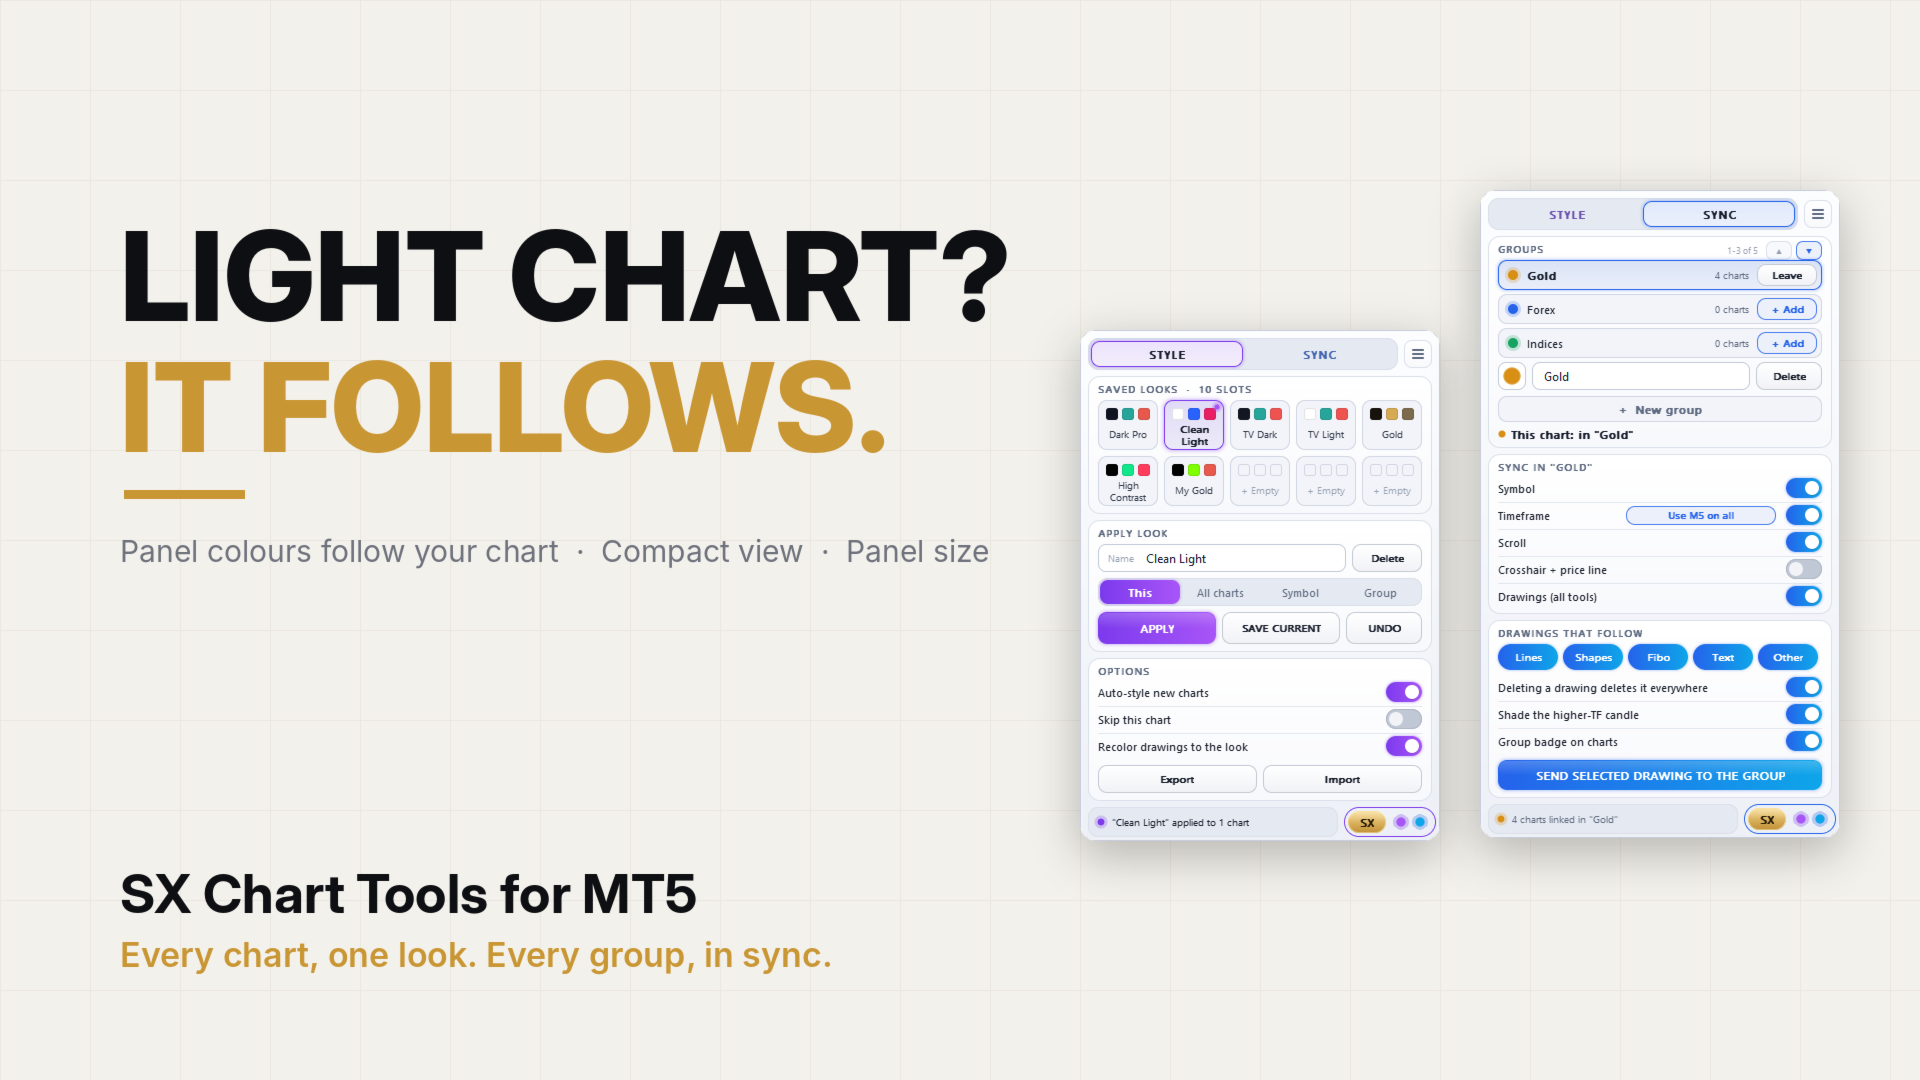
A look stores everything you see on a chart: background, grid, candle and line colours, Bid/Ask lines, chart type, volumes, period separators, OHLC, price and date scale, trade levels, one-click trading, and the zoom if you want it.
- 10 slots: 6 ready-made looks (Dark Pro, Clean Light, TV Dark, TV Light, Gold, High Contrast) and 4 free slots for your own.
- Apply a look to this chart, to all charts, to every chart of the same symbol, or to the charts of a sync group.
- Undo takes back the last Apply on every chart it changed.
- Save current: style a chart with F8 the way you like it, then save it into a free slot and give it a name.
- Auto-style: charts you open later get the look in use straight away.
- Skip this chart: keeps a chart out of All charts, Symbol, Group and Auto-style.
- Recolor drawings: Apply can also change the colour of your drawings to fit the look.
- Export and import your looks, for example to use them in another terminal.
For STYLE one copy of the indicator is enough, it can style all your open charts.
SYNC - charts that work together
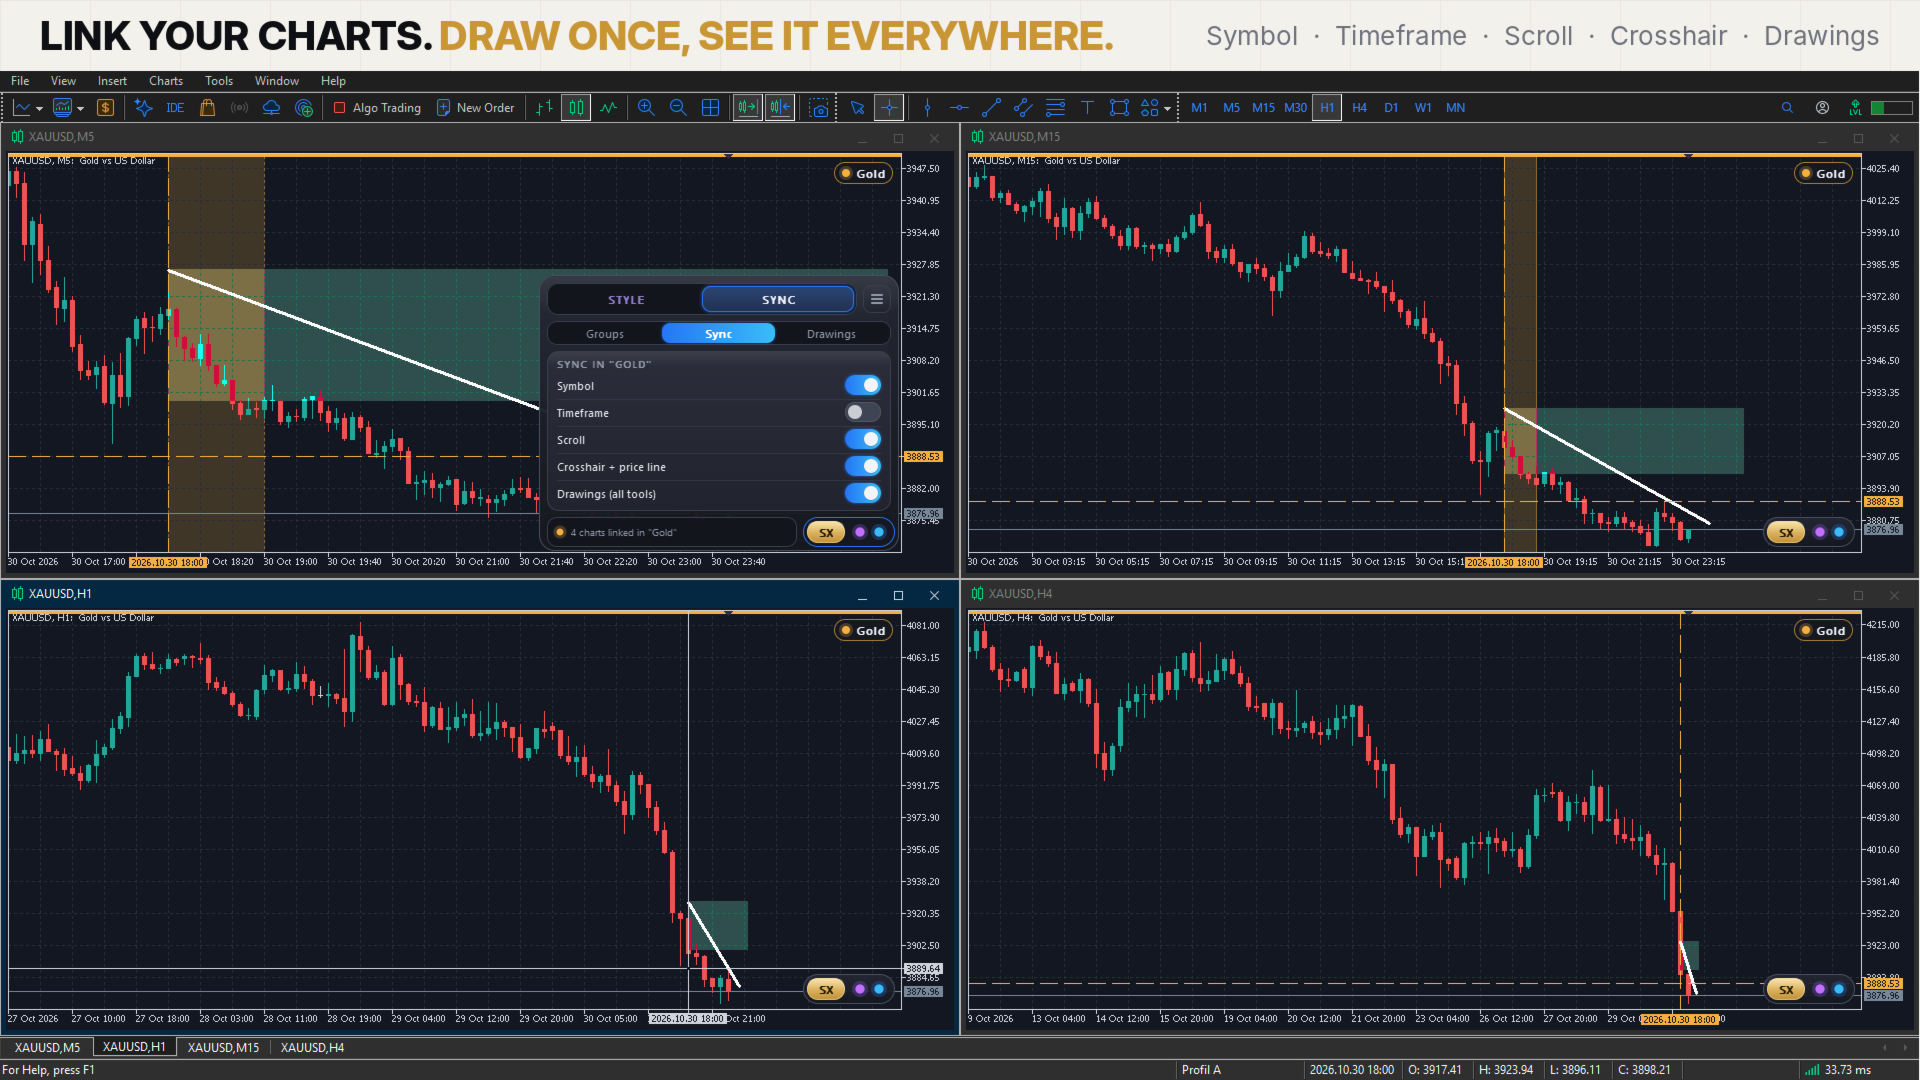
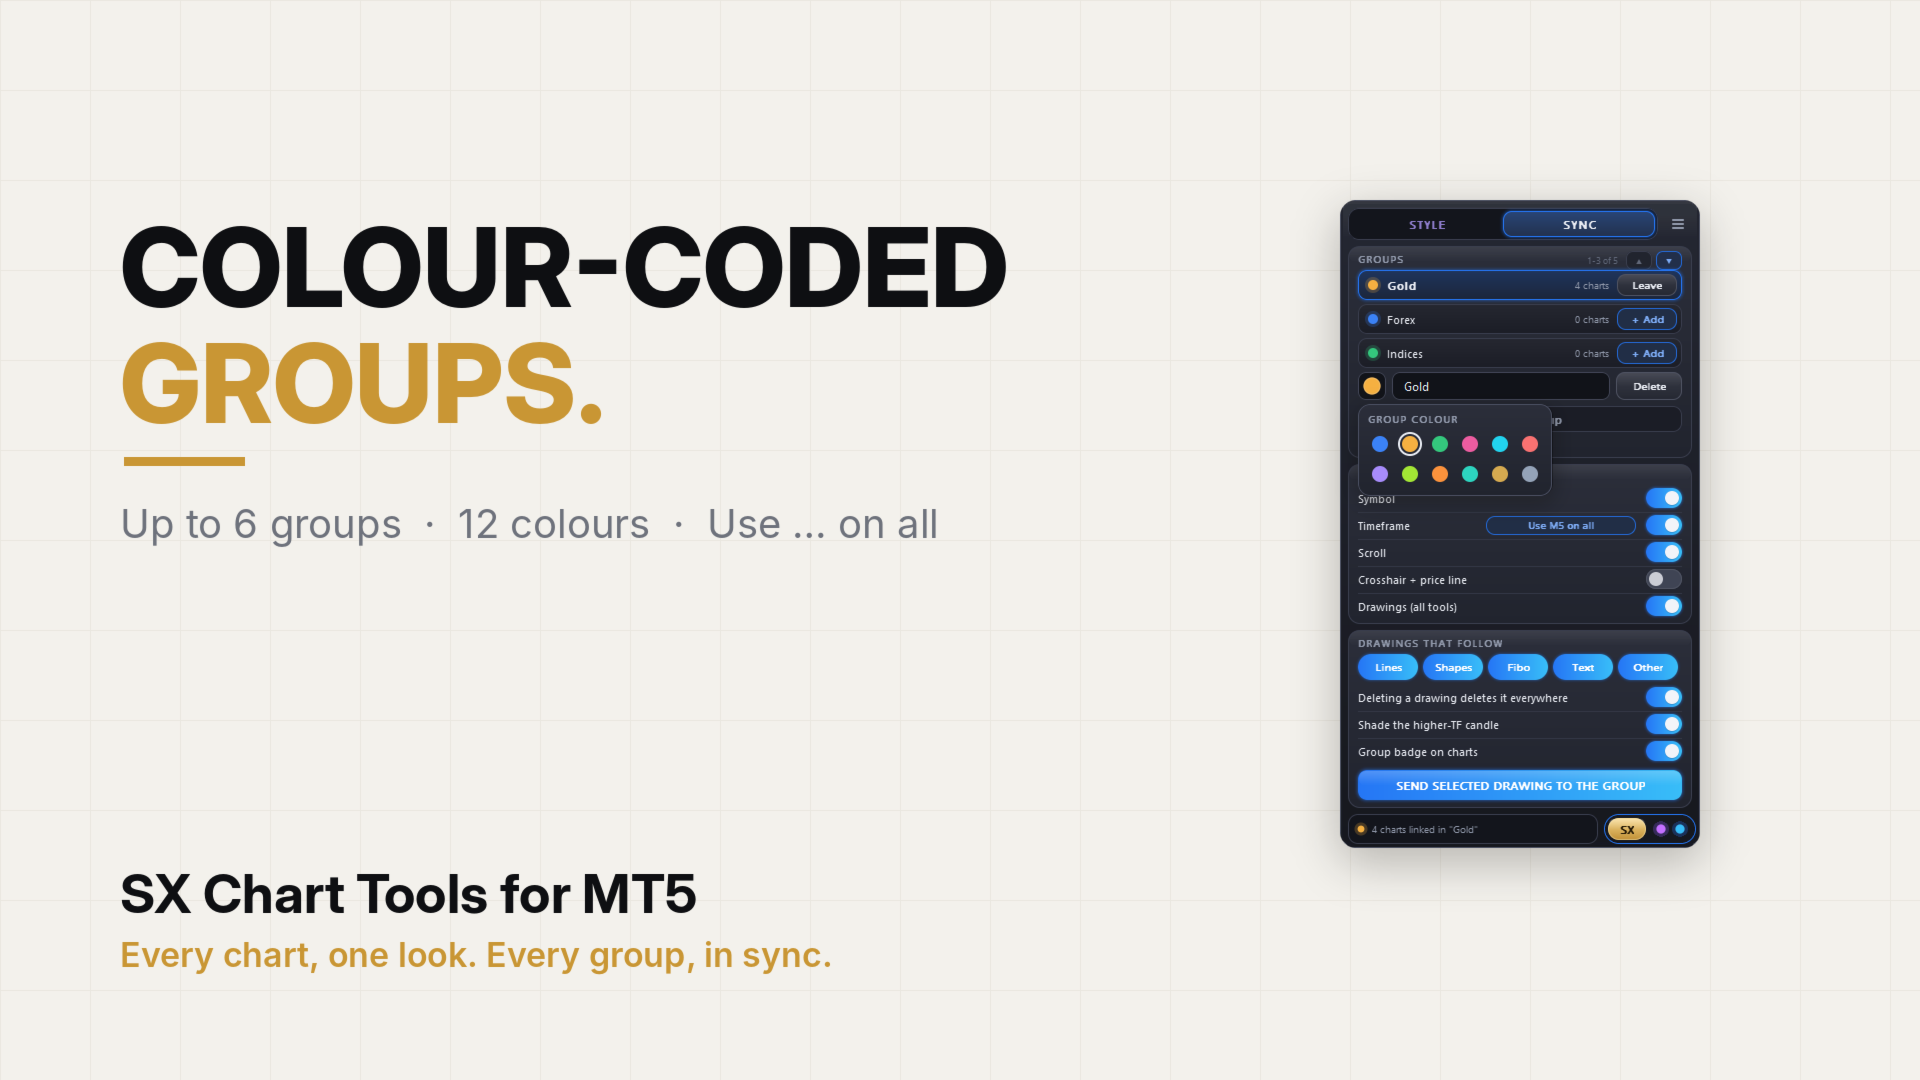
Put the charts you want to link into a group. You can have up to 6 groups at the same time, each with its own name and colour, and they do not affect each other. For SYNC every chart in a group needs its own copy of the indicator.
Each group follows what you switch on:
- Symbol: change the symbol on one chart and the whole group follows. Every chart keeps its own timeframe.
- Timeframe: change the timeframe on one chart and the group follows.
- Scroll: scroll back on one chart and the others go to the same time. Press End and they all come back to the latest bar.
- Crosshair and price line: the other charts show a vertical line at the same time, and charts of the same symbol a horizontal line at the same price.
- Drawings: draw a zone, a trend line, a Fibo or a text once and it appears on the charts of the group with the same symbol, also on other timeframes. Move it or change it and it changes everywhere.
More on drawings:
- Choose which kinds follow the group: lines, shapes, Fibo, text, other.
- Deleting a drawing can delete it everywhere, or only on the chart where you delete it.
- Send selected drawing: sends one drawing to the group even if its kind is switched off.
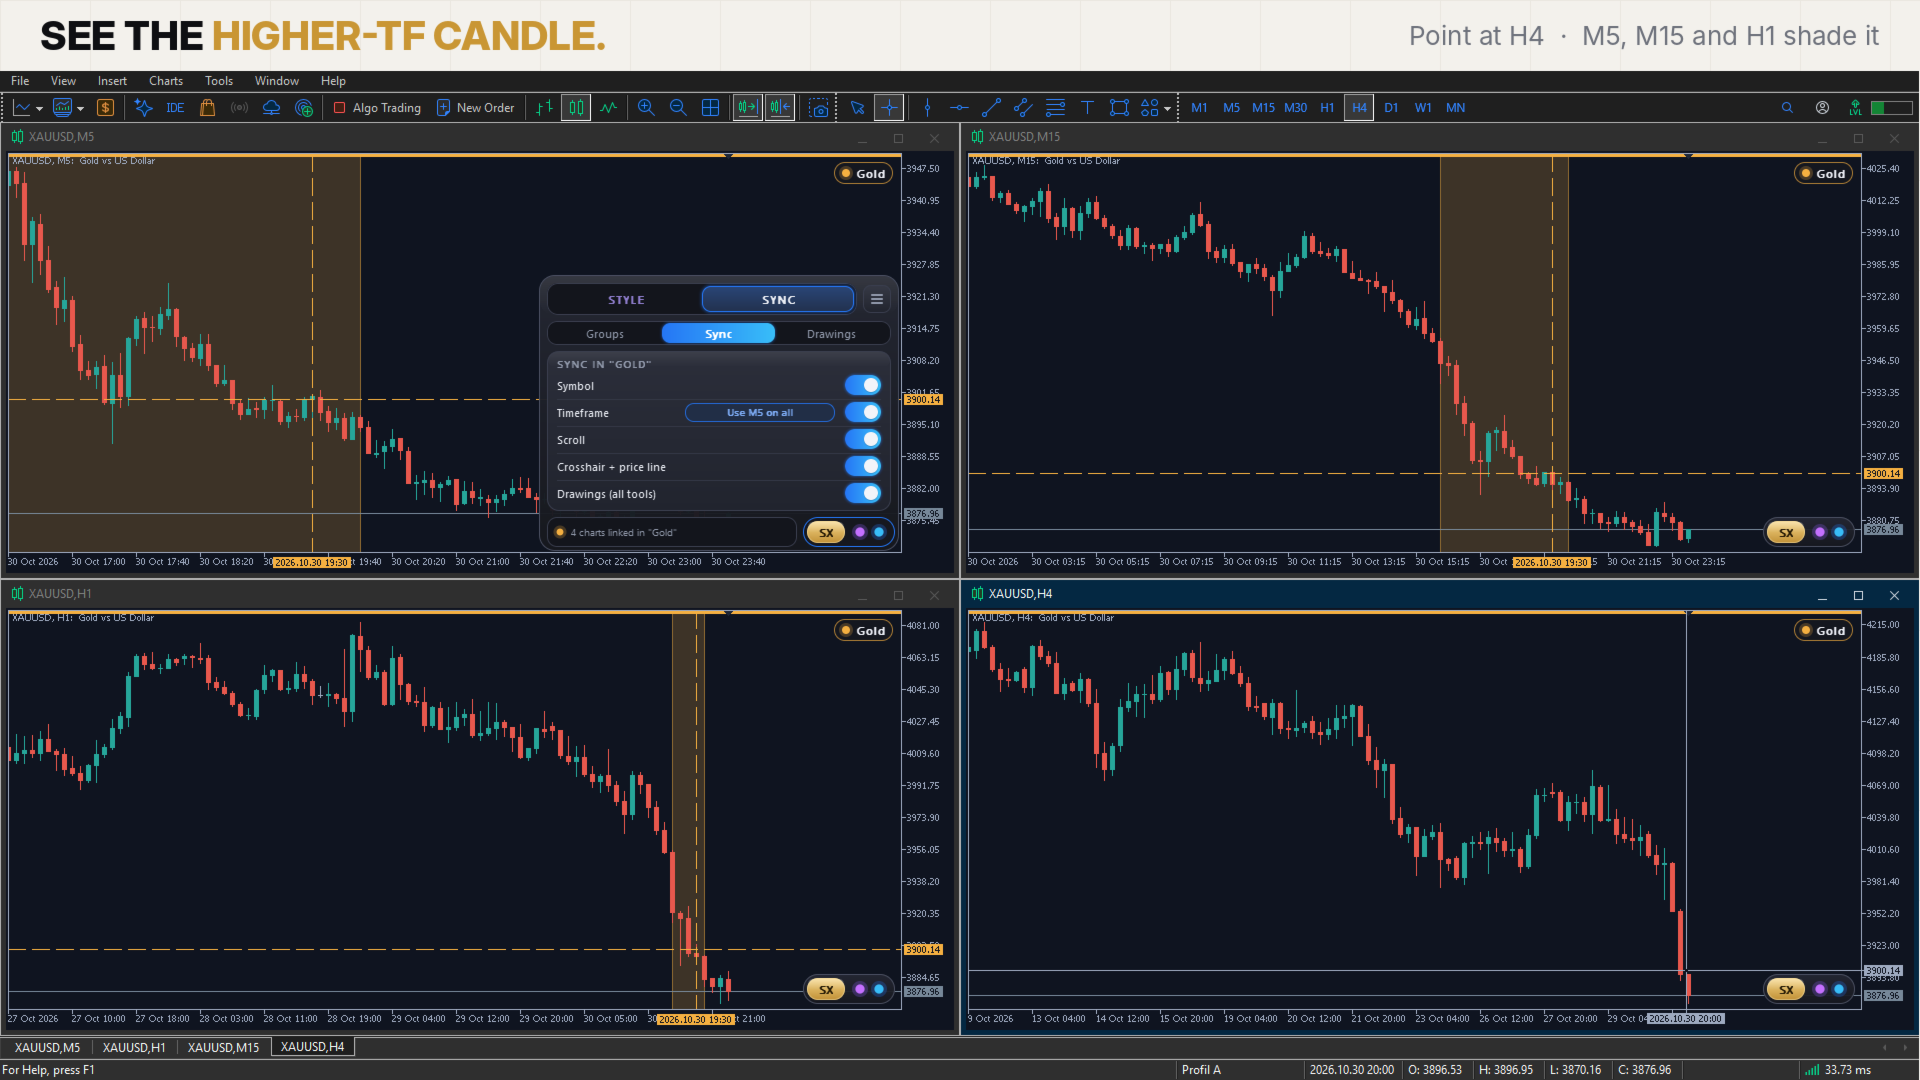
- Shade the higher-TF candle: point at a candle on H4 (or any higher timeframe) and the lower timeframe charts shade the candles inside it.
Small things that help:
- A coloured line and the group name at the top of every chart, so you always see which charts belong together.
- If the charts of a group show different symbols or timeframes, a "Use EURUSD on all" (or "Use H1 on all") button appears. One click and the whole group is lined up.
- Loading a template or deleting many drawings at once on one chart is not passed on to the rest of the group.
- If a chart with another symbol joins a group that follows the symbol, the panel warns you.
- A chart that trades 24/7, like BTC, does not jump back to Friday because a forex chart in the same group is closed at the weekend.
THE PANEL
- The SX button sits in a corner of the chart (you choose which). SX opens the panel, the purple dot opens STYLE, the blue dot opens SYNC.
- The panel follows the colours of the chart, dark or light.
- It opens right at the SX button and stays in that corner. Switching tabs or pages never moves it.
- The compact view is sized on purpose: even on an average laptop screen (Full HD) the panel opens on every chart of a 4-chart layout. On smaller charts it splits into short pages, and nothing gets cut off.
- Panel size input from 75 to 100 percent if you want it smaller.
- Only one chart has an open panel at a time, and a click on the chart closes it.
TIP
Alt+R tiles all open charts in MT5. If you only want one instrument's charts next to each other, keep a separate MT5 profile for each instrument, or minimise the other charts before you press Alt+R.
TRYING THE DEMO
The demo runs in the Strategy Tester in visual mode, where MetaTrader opens only one chart. There you can open the panel, try the looks on the STYLE tab, save your own and use Undo. Renaming a look is not possible in the tester. The SYNC tab opens as well, but it needs at least two real charts, so it can only be tried in the live terminal.
Tip: move the speed slider of the tester down. At full speed the chart updates so fast that the panel hardly reacts to clicks.
INPUTS
Button position, panel size, the group of the chart (0 = not linked), the switches a new group starts with, crosshair colour, price line on or off, and hiding the crosshair after a few seconds without movement. Almost everything can be changed on the panel later, the inputs are only starting values.
Full user guide with pictures: https://www.mql5.com/en/blogs/post/779035
If something does not work the way you expect, or you have an idea, send me a private message on MQL5.