ReSu mt5

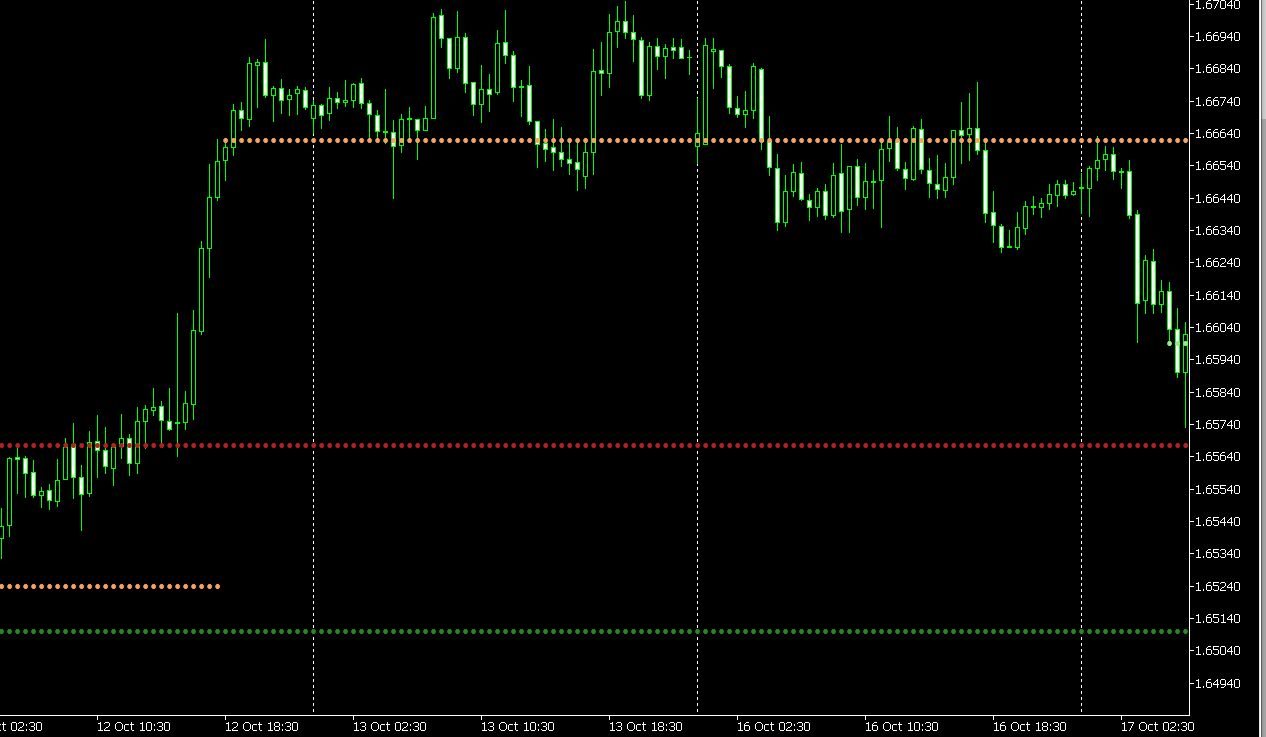
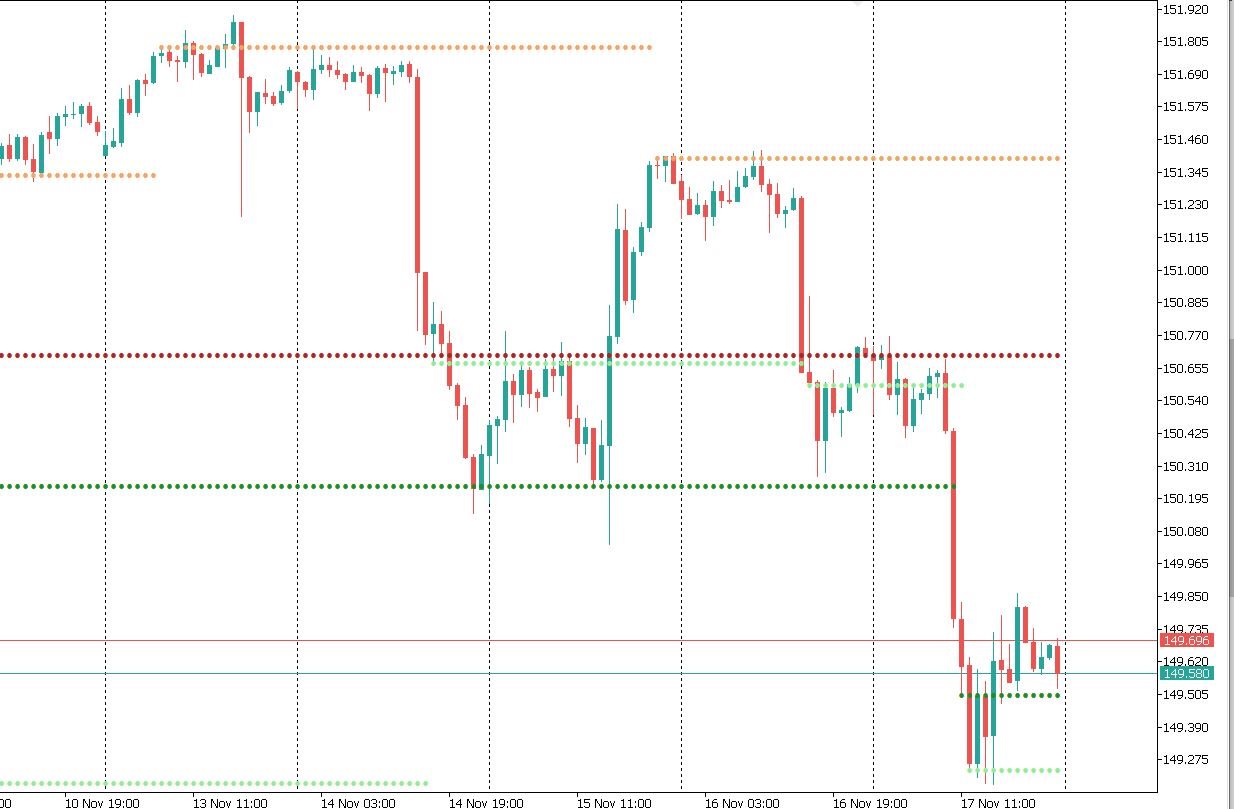
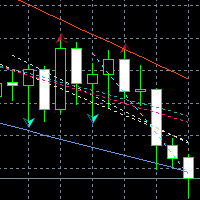
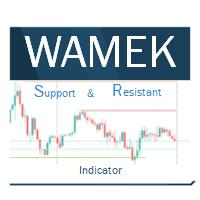
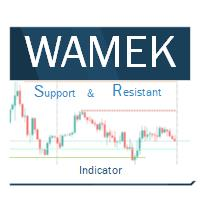
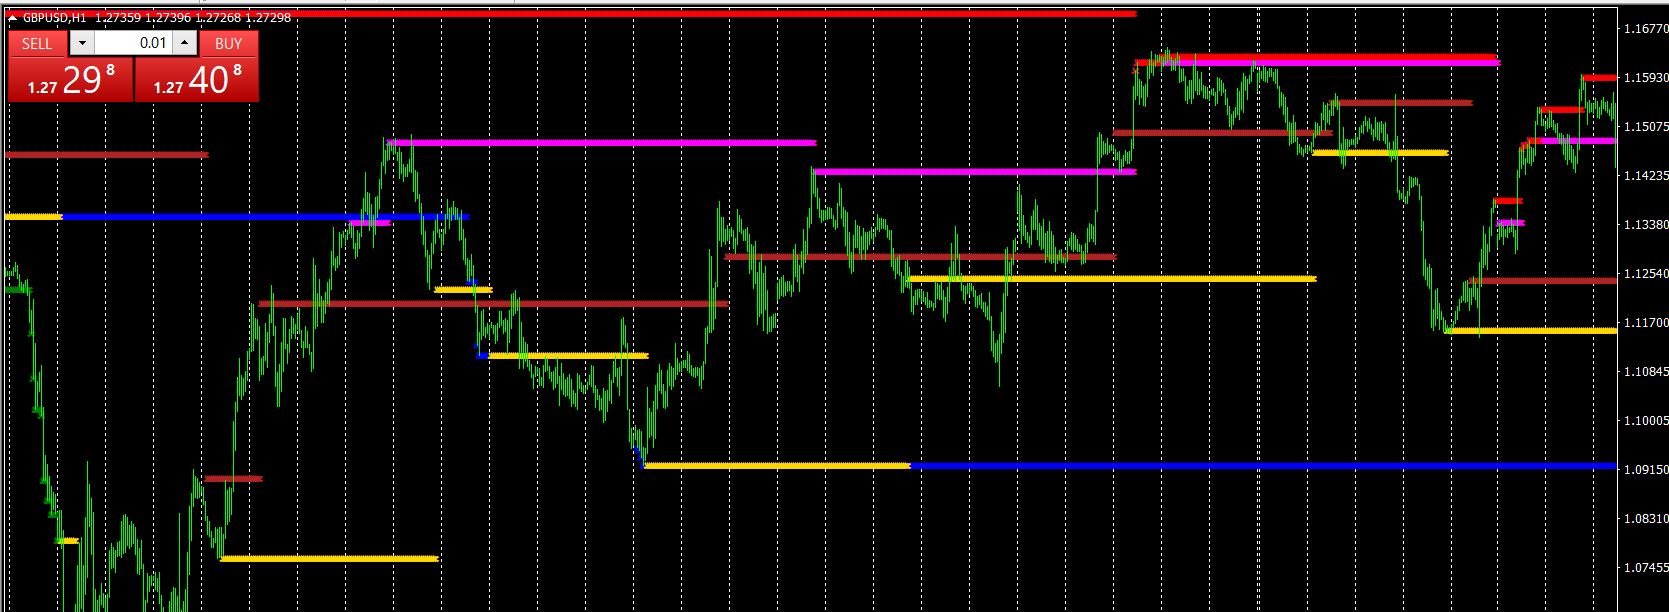
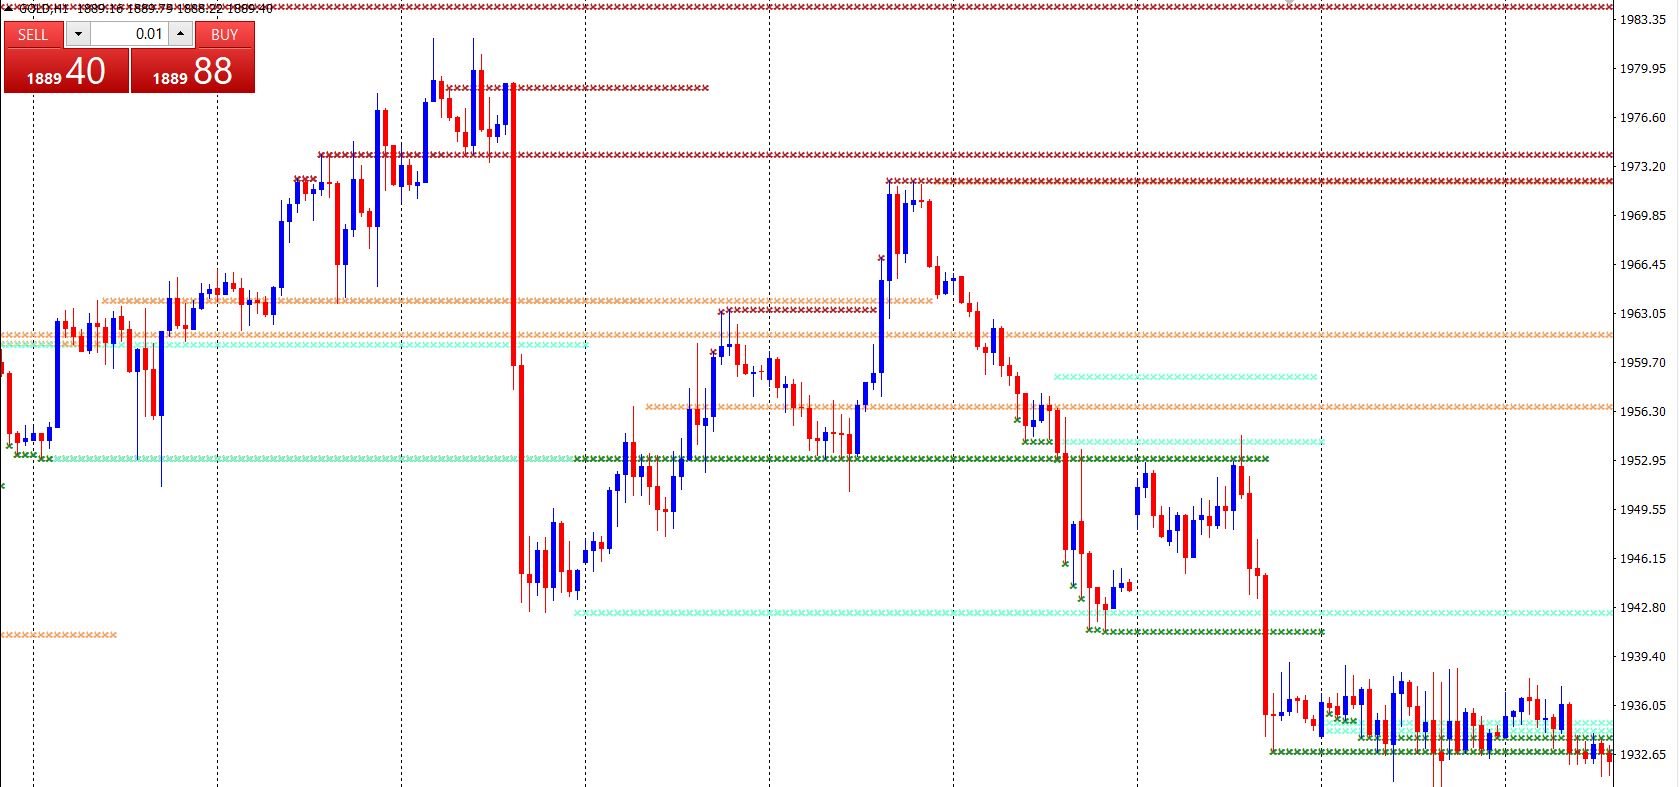
The Wamek Support and Resistant (WSR) Indicator is a remarkable tool that stands out in the world of technical analysis. It sets itself apart by cleverly combining price action and leading indicators to delineate support and resistance levels with a high degree of accuracy. Its unique feature is its adaptability; users can fine-tune the indicator by adjusting input parameters, enabling them to create customized support and resistance levels that suit their trading strategies. Notably, one of WSR's most attractive qualities is its non-repainting nature, meaning once it identifies a level as support or resistance, it maintains that classification.

To consider a price level as either support or resistance in real-time, WSR recommends waiting for a minimum of four price points to form around that level. This prudent approach ensures that the support or resistance is more robust and less prone to false signals. When such a level has been established, traders are advised to be patient and wait for price action to retest it.

The WSR Indicator's present offering is even more enticing, as it currently enjoys a substantial 40% discount. This limited-time opportunity invites traders to seize the advantage of this cutting-edge indicator at a reduced cost. Now is the opportune moment to leverage the distinct capabilities of the WSR Indicator and elevate your trading endeavors to new heights.


Now, let's delve deeper into how the Wamek Support and Resistant Indicator can significantly enhance your trading experience:

Reliability at its Core:

WSR instills confidence in traders by providing dependable support and resistance levels. The algorithm's ability to analyze both historical data and current price action enables it to generate levels that are more likely to hold up in the face of market volatility. This reliability is invaluable to traders looking to make informed decisions in a constantly changing market environment. It eliminates the need for guesswork and minimizes the risks associated with trading blind.

Tailored to Your Strategy:

What truly sets WSR apart is its adaptability. By adjusting the input parameters, traders can fine-tune the indicator to align with their specific trading strategies. Whether you're a day trader looking for short-term support and resistance levels or a swing trader with a longer time horizon, WSR can be customized to cater to your unique needs. This versatility empowers traders to refine their strategies and make more informed decisions.

To cater to individual preferences, the WSR Indicator extends the privilege of altering color codes. This customization feature allows traders to align the indicator's visual representation with their personal aesthetics and preferences, fostering a more immersive and user-friendly experience.

Across Various Markets:

WSR's capabilities are not limited to a specific asset class. It is equally effective when applied to currencies, commodities, stocks, and cryptocurrencies. This versatility ensures that traders can utilize WSR across a wide range of financial markets, making it a valuable tool for those with diverse investment portfolios. Whether you're trading the highly liquid forex market or the volatile world of cryptocurrencies, WSR can help you identify key support and resistance levels to inform your trading decisions.


Default Setting:

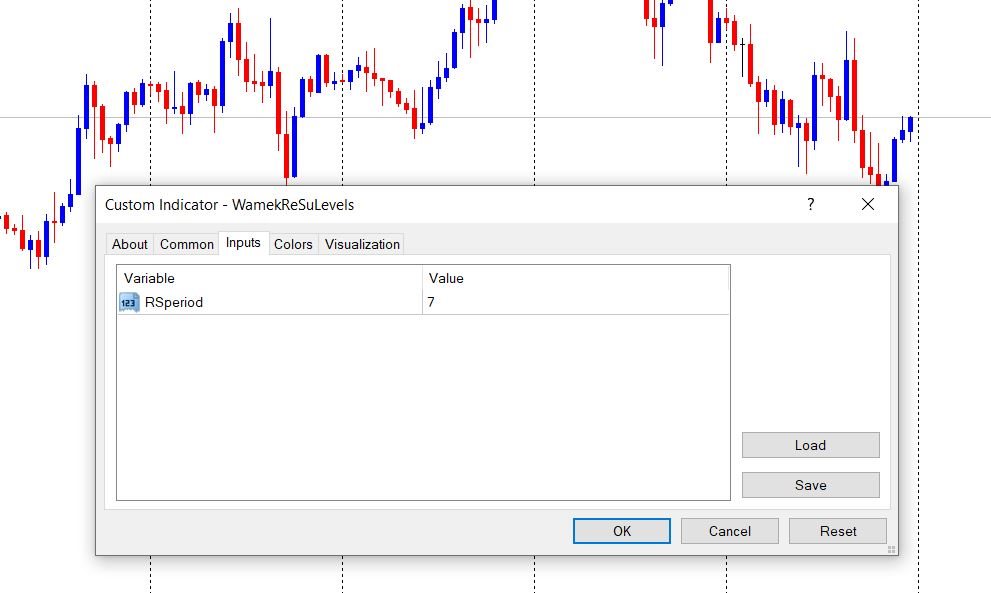
The default setting of WSR's input parameter is RSperiod=7. This setting can serve as a good starting point for many traders, providing a balanced approach to identifying support and resistance levels. However, it's essential to remember that customization is the key to unlocking the full potential of this indicator. Traders should experiment with different input values to fine-tune WSR to their specific trading goals and timeframes.
推荐产品
SPECIAL LAUNCH OFFER: $30 (1-Month Rent) Limited time offer to build our community and gather feedback! AmbM GOLD Institutional Scalper A high-precision M5 algorithm for XAUUSD (Gold) , engineered to trade exclusively at Institutional Liquidity Levels ($5/$10 psychological marks). PERFORMANCE DATA (BUY ONLY) • Win Rate: 87.09%. • Safe Growth: +$4,113 profit on $10k (13.75% Max Drawdown). • Extreme Stress Test: Successfully generated +$22,997 in a 5-year stress test (2020-2026), proving
Unmask Institutional Market Shifts with Precision Institutional Divergence Reversal Pro Most divergence indicators fail because they are "noisy"—they find every tiny curve in the market, leading to false signals. Institutional Divergence Reversal Pro is engineered to filter out retail noise and identify high-probability reversal zones where "Smart Money" is active. By combining multi-timeframe monitoring with a proprietary Quality Scoring System , this tool ensures you only focus on the setups t
Signal Eskiya mt5
Vitalii Zakharuk
Signal Eskiya, in addition to channel lines, reflects entry signals in the form of arrows. Trading strategies using the channel indicator belong to the classic methods of technical analysis, are easy to execute, and therefore available even to beginners. Price ranges work equally well on any trading assets and timeframes, they can be used both independently and with additional confirmation from oscillators and market volumes. American traders say: “Trend is your friend”, which means “Trend is
Win43 Scalper
Eadvisors Software Inc.
O novo s43 Scalper para Mini-Índice (WIN-IND) faz operações de curto prazo no timeframe 1min buscando pequenas variações do mercado, utiliza nova tecnologia de trade, os resultados no intraday são íncríveis, confira:      Após a instalação adicione no gráfico dos instrumentos win para visualizar os resultados no backteste. Recomendamos o timeframe de 1min.
Equinox Gold
Dmitriq Evgenoeviz Ko
Equinox Gold is a high-tech trading expert advisor (EA) specifically designed for the gold market ( XAUUSD ). The system is based on a unique Market Equilibrium algorithm that identifies areas of imbalance between supply and demand during extreme volatility. Unlike most robots that use dangerous sit-and-wait methods, Equinox Gold relies on mathematical momentum confirmation and strict risk control for every trade. MAIN ADVANTAGES VRP Filter (Volatility Range Filter): The robot automatically ada
Aliens dougkang de moviles
Cesar Juan Flores Navarro
Tomamos 5 medios móviles las unimos en una la cual suavizamos y volvemos a suavizar, resultando un mega suavizador de medios móviles suavizadas. Indicador de mql5 funciona en cualquier broker y para todos los tiempos, siendo el mas optimo el de 5, 15 a mas. Funciona mejor en grupo consigo misma osea poner uno de 14 y otro de 50 y 400,, así se observa mejor su desempeño.
Frontier Pivots
Nestor Jose Mendez Boza
FRONTIER PIVOTS - Geometric Levels Indicator This indicator plots support and resistance levels/ranges on the chart using mathematical calculations. It helps traders identify potential price reaction zones based on geometric patterns. Main Features: Automatically calculates and displays key price levels Plots both support and resistance lines Uses daily price data for level calculation Clean visual presentation with different colors for different level types No repainting - levels remain static
Caicai L&S Yield Histogram Important Notice: This indicator is an integral tool of the automated EA Caicai Long and Short Pair Trading . This indicator visually displays the percentage deviation (Yield %) of a pair's current spread relative to its own historical mean. It is an excellent tool for quickly visualizing the gross financial potential of a market distortion in Long & Short operations. Main Features: Percentage Visualization: Understand the size of the distortion in palpable percentage
Divergence Bomber MultiTF
Gabriel Alejandro Sanchez Lledo
WARLOCK Divergence Bomber MultiTF MT5 Professional Edition v3.0 – Multi-Timeframe Divergence Powerhouse Professional Product Description (Ready for MQL5 Market) WARLOCK Divergence Bomber MultiTF MT5 is a premium, institutional-grade divergence scanner that combines the three most powerful oscillators — RSI, MACD, and Stochastic — across 9 timeframes simultaneously (M1, M5, M15, M30, H1, H4, D1, W1, MN1). It detects Regular and Hidden bullish/bearish divergences in real time, calculates a sophis
Manyal trading system, CovEchoTrend Robot, focuses on reliability and flexibility. By employing statistical analysis methods to study the relationships between the base indicator and market patterns, the system enables a deeper understanding of market processes. Intelligent pattern analysis: The application of statistical data processing helps identify key trend reversal points more accurately, signaling significant market shifts. Informed decision-making is based on the intersection of indicato
Quarter EMA
Jithin Sajan Sajan
Kindly rate and comment about the product for upgradation & Support The 5 EMA is plotted in green color ( Lime ). The 14 EMA is plotted in red color ( Red ). The 20 EMA is plotted in blue color ( Blue ). The 200 EMA is plotted in yellow color ( Yellow ). The Quarter EMA that provided calculates and plots four Exponential Moving Averages (EMAs) on the chart using different periods: 5, 14, 20, and 200. Each EMA is represented by a different color on the chart. Here's a description of each EMA:

Quintet EMA
Jithin Sajan Sajan
Kindly rate and comment about the product for upgradation & Support The   5 EMA   is plotted in   green   color ( Lime ). The  14 EMA  is plotted in  red  color ( Red ). The   20 EMA   is plotted in   blue   color ( Blue ). The  200 EMA  is plotted in  black  color ( Black ). The   200 EMA   is plotted in   yellow   color ( Yellow ). The Quarter EMA that provided calculates and plots four Exponential Moving Averages (EMAs) on the chart using different periods: 5, 14, 20, and 200. Each EMA is
Adaptive Trend Lines
Henri Salvatore Bigatti
4.76 (25)
This indicator shows the TLH and TLL and some trendlines that allow us to estimate the trend of market.  It also shows the values of the angles of the lines in percentage in points (pip) , the standard deviation, and the trend of each line, and when it breaks the lines of support and resistance (TLH and TLL). And finally, it also shows the points identified as supports and resistances through the fractal algorithm in the graph. The high and low trend lines are supported by the highs and lows, th
FREE
Ugenesys AI MT5
Odaine Ramon Mcmillan
uGenesys AI - 90% Accurate Daytrading Indicator Introducing the ultimate forex trading indicator system, uGenesys AI, powered by cutting-edge AI technology and advanced analytical techniques, including Time-Series Analysis and Genetic Algorithms. Our AI-powered trading system leverages the power of time-series analysis to identify trends and patterns in historical price data, allowing traders to make informed predictions about future market movements. By analyzing vast amounts of data, our syst
Expert. Automatic and manual trading. Ready-made trading system based on Elliott waves and Fibonacci retracement levels . It is simple and affordable. Display of the marking of Elliott waves (main or alternative option) on the chart. Construction of horizontal levels, support and resistance lines, a channel. Superposition of Fibonacci levels on waves 1, 3, 5, A Alert system (on-screen, E-Mail, Push notifications).    visual panel for opening orders in manual trading. visual panel for setting up
Pare de seguir as "sardinhas" e comece a operar como big player, de forma automática. O robô Imbalance Autotrader é a mais recente tecnologia de trade que monitora os big players (grandes investidores) do mercado financeiro. Com estratégia de rompimento ( breakout ) ou pullback (Fair Value Gap FVG e Order Block) , você consegue configurar o robô para o ativo, conforme condições que você deseja operar. Além disso, o robô pode ter stops configuráveis, dinâmicos ou fixos. Na questão de gerenciamen
BTC Master Pro
Farzad Saadatinia
4.58 (12)
BTC Master Pro —— 您值得信赖的比特币纪律化交易伙伴。 全新版本现已集成 OpenAI 人工智能技术 ,在高波动的加密市场环境中,实现更智能的执行与更精准的交易过滤。 本专业级交易机器人专为 Bitcoin (BTCUSD) 在 MetaTrader 5 平台上的交易而设计,专注于结构化执行、风险暴露控制以及智能化风险管理。 当前价格: $499  →  下一阶段: $699  →  最终价格: $999 LIVE SIGNAL HERE 基于 OpenAI 的执行过滤系统 最新版本集成 OpenAI 技术,用于实时分析市场环境并过滤低质量或弱势交易信号。 AI 安全层(AI Safety Layer): 人工智能模块作为交易执行前的第二层审核机制。其功能严格限定为执行过滤工具(而非市场预测工具)。每一笔交易都必须通过结构化逻辑与智能验证流程,以减少不必要的回撤并避免低质量入场。 为什么选择 BTC Master Pro? 加密货币市场——尤其是比特币——具有高度波动性。情绪化决策往往导致不稳定的交易结果。本系统旨在帮助交易者在快速市场变化中保持结构化、纪律性与
SMC Venom 模型 BPR 指標是針對在智慧貨幣 (SMC) 概念內工作的交易者的專業工具。它會自動辨識價格圖表上的兩種關鍵模式: FVG (公平價值缺口)是三根蠟燭的組合,其中第一根和第三根蠟燭之間存在缺口。它在水平之間形成一個沒有成交量支撐的區域,這通常會導致價格調整。 BPR (平衡價格區間)是兩種 FVG 模式的組合,形成一個「橋樑」 - 當價格以低成交量活動移動時,突破並返回到水平的區域,從而在蠟燭之間產生間隙。 這些模式可協助交易者透過分析圖表上的交易量和價格動態(大型市場參與者和普通參與者之間的互動)來識別關鍵的支撐/阻力位、突破區域和切入點。 此指標以矩形和箭頭的形式可視化模式,也支援靈活的警報設定。 主要特點: 模式顯示模式:選擇顯示 BPR 模式(看漲和看跌)或 FVG 模式(看漲和看跌)。 可以隱藏所有圖表分析模式。 以條數過濾:BPR 結構中 FVG 之間的最小/最大距離。 訊號的附加視覺化: 箭頭有 9 種類型可供選擇(標準、細、分形等)或手動輸入 Wingdings 代碼,其表格可以選擇性地顯示在圖表上。 設定顏色、尺寸及其縮放時相對於價格的動態
"Blow It Up!" – The Trading Indicator That Questions Your Life Choices Tired of boring indicators? Meet your new market companion that delivers:   "YOLO BUY!" arrows   when you should probably panic   Explosive rectangle confetti   (because why not?)   200+ soul-crushing quotes   like   "Your stop loss is imaginary"   and   "This isn’t trading, it’s donating to whales"   Random alerts that roast your strategy This Indicator is like Therapy   – Because daytrading shouldn’t feel
PZ Mean Reversion MT5
PZ TRADING SLU
3 (2)
采用专业和量化方法进行均值回归交易的独特指标。它利用了价格以可预测和可衡量的方式转移并返回均值这一事实,这允许明确的进入和退出规则大大优于非量化交易策略。 [ Installation Guide | Update Guide | Troubleshooting | FAQ | All Products ] 清晰的交易信号 非常容易交易 可定制的颜色和尺寸 实现性能统计 优于大多数交易策略 显示合适的止损和止盈水平 它实现了电子邮件/声音/视觉警报 这个怎么运作 该指标从更高的时间范围测量完全可定制的移动平均线的标准偏差,并使用趋势跟踪方法精确地找到交易。交易是通过深入当前图表的价格行为发现的,并在价格返回到平均价格区间时关闭,根据您选择的更高时间范围计算。由于其编码方式,该指标将远离高波动性和强劲趋势市场,并且仅在可预测的情况下进行交易,在可接受的波动性与方向性比率范围内,回归均值是可行的。 指标剖析 绿线是更高时间范围内的移动平均线(也就是平均值) 虚线区域是移动平均线周围的典型价格区间 蓝线是看涨交易的突破价格 红线是看跌交易的突破价格 交易是针对均值进行的,并在典型的价格
My Trendline
Ashok Kumar Singha
My Trendline is an Indicator based on Upper and Lower Trendline which will Plot Automatically into the Chart. This Indicator will perfectly indicate you the Trend of the Market. It can be use in any Time Frame. The Indicator will automatically adjust according to the Current Time Frame. Steps to Setup the Indicator: Install the Custom Indicator; Set all the Inputs, Line Color, Width and Styles etc. (Can use the Default Setting also); Set visualization to All Timeframe; and DONE It can
Linha PCM Fimathe
Anderson Maicon De Vargas Odorcik
1 (1)
Manual de Instalação e Configuração Para que você tenha a melhor experiência profissional, siga estes passos simples para preparar o seu terminal: 1. Ativação no Terminal (Ajuste de Segurança) Antes de começar, precisamos garantir que o MetaTrader permita que você manipule a ferramenta livremente: Pressione Ctrl + O para abrir as Opções . Vá na aba Gráficos . Marque a opção: "Selecionar objetos com um clique do mouse" . Isso permitirá que você ajuste a régua de medição de forma instantânea. 2. V
WanaScalper
Isaac Wanasolo
1 (1)
A scalping indicator based on mathematical patterns, which on average gives signals with relatively small SL, and also occasionally helps to catch big moves in the markets (more information in the video) This indicator has three main types of notifications: The first type warns of a possible/upcoming signal on the next bar The second type indicates the presence of a ready signal to enter the market/open a position The third type is for SL and TP levels - you will be notified every time price re
Rocket Trend
Andriy Sydoruk
The Rocket Trend indicator is trending. The indicator draws two-color points connected by lines along the chart. This is a trend indicator, it is an algorithmic indicator. It is easy to work and understand when a blue circle appears, you need to buy, when a red one appears, sell. The indicator is used for scalping and pipsing, and has proven itself well. Rocket Trend is available for analyzing the direction of the trend for a specific period of time. Ideal for novice traders learning the laws o
CoioteTradeDetector
Alexandre Moraes De Souza Lima
O CoioteTradeDetector monitora o time and trades (time and salles), é possível criar filtros de alerta gráficos (plotagem de linha com qtd) com variações de agressões pré-definidas. É possível monitorar grandes lotes, ordens diretas e alta frequência de trades. Para perfeito funcionamento do produto é preciso ter os dados de agressão da corretora (acesso completo ao times and trades).
The MACD Divergence Indicator is a powerful tool designed to identify Classical (Normal) Divergences on the MACD, which can signal potential market reversals or continuation trends. Divergences occur when the price and the indicator move in opposing directions, highlighting potential shifts in momentum. What is a Classical (Normal) Divergence? Classical Divergences are categorized into two main types: Bullish Divergence: Occurs when the price forms lower lows, but the MACD forms higher lows. Thi
Sonic R Pro Enhanced
Huu Thuong Nguyen
Sonic R Pro Enhanced EA - 2025 版本 $249 仅限前5名购买者! 实时信号 查看 Sonic R Pro Enhanced 的实时表现: 交易策略 Sonic R Pro Enhanced 是经典 Sonic R 策略的升级版,通过 Dragon Band(EMA 34 和 EMA 89)进行自动化交易,并结合先进算法以提高盈利能力。 时间周期:M15, M30 支持货币对:XAUUSD, BTCUSD, AUDJPY, USDJPY 交易风格:回调交易 & 反趋势交易 最低资金要求:500 USD 杠杆比例:1:200 起 用户指南 设置:只需配置一个参数 - RiskAmount 如果 RiskAmount < 0:按账户余额的百分比计算风险 如果 RiskAmount > 0:每笔交易的固定风险金额 (USD) 示例: RiskAmount = -1 : 风险为账户余额的 1% RiskAmount = -2.5 : 风险为账户余额的 2.5% RiskAmount = 50 : 每笔交易固定风险 50 USD RiskAmou
Pti
Sergei Gurov
PTI is an index developed by Tom Joseph, which compares the points of Purchase/Third Wave Sales with a Buying Momentum/Sales of The Fourth Wave. This comparison will then be transferred to an algorithm that calculates the VALUE of the PTI INDEX. You can learn more about this index by reading his book Simplified Wave Analysis.  This indicator is an example of my understanding of this index.  This index should be used as follows: 1) You need to click on the "Start Calculation" chart 2) Make the
适用于 MT5 的 4 倍标准差通道 使用适用于 MetaTrader 5 的 4 倍标准差通道指标,将您的图表转化为专业的机构交易空间。 这款高级指标将动态回归通道、多级波动区域、可自定义移动平均线以及强大的高时间框架支撑/阻力位整合到一个简洁且高度可定制的工具中。 对于希望精准识别趋势方向、波动扩张、溢价/折价区域以及高概率反转区域的交易者而言,这款指标堪称完美之选。 主要功能 高级标准差通道 自动绘制智能线性回归趋势通道 价格上下最多 4 个偏差级别 检测波动扩张和过度扩张的市场状况 可选通道左右延伸,用于未来预测 实时趋势斜率分析 多级波动区域 +1 / -1 偏差 +2 / -2 偏差 +3 / -3 偏差 +4 / -4 偏差 快速识别: 趋势延续区域 均值回归机会 耗尽区域 机构价格极值 内置移动平均线套件 支持多种移动平均线类型: SMA EMA WMA SMMA / RMA HMA DEMA TEMA 包含多达 6 条完全可自定义的移动平均线,可调节以下参数: 长度 类型 颜色 可见性 适用于: 趋势过滤
WhaleFinder MT5
Kazuya Yamaoka
Considering the main theories of Forex (Dow Theory, support lines, chart patterns, and Fibonacci retracements), It tells you the price range where whales (large investors) are likely to appear. You can trade at the price points that professionals also aim for. You no longer have to warry about where to aim next. We are live-streaming the actual operation of the system. Please check for yourself if it is usable. Please check it out for yourself. https://www.youtube.com/@ganesha_forex We do not
该产品的买家也购买
Neuro Poseidon MT5
Daria Rezueva
5 (9)
Neuro Poseidon is a new indicator by Daria Rezueva. It combines precise trading signals with adaptive TP/SL levels - creating best possible trades as a result! Message me and get  Neuro Poseidon Assistant  as a gift to automize your trading process! What makes it stand out? 1. Proven profitability on all assets and timeframes 2. Only confirmed BUY and SELL signals present on the chart 3. Adaptive TP & SL levels generated by the software for each trade 4. Easy to understand - suitable for al
Divergence Bomber
Ihor Otkydach
4.9 (89)
购买该指标的每位用户将额外免费获得以下内容: 原创工具“Bomber Utility”,该工具会自动跟踪每一笔交易,设置止损和止盈点,并根据策略规则自动平仓; 适用于不同交易品种的指标设置文件(Set 文件); 三种不同风险模式下的 Bomber Utility 设置文件:“最低风险”、“平衡风险” 和 “观望策略”; 一套详细的 视频操作手册,帮助您快速完成安装、配置并开始使用本交易系统。 注意: 要获取以上所有赠品,请通过 MQL5 的私人消息系统联系卖家。 我为您介绍原创的自定义指标 “Divergence Bomber”(背离轰炸机),它是一套基于 MACD 背离交易策略 的“全功能”交易系统。 该技术指标的主要任务是识别 价格与 MACD 指标之间的背离,并发出交易信号(包括推送通知),指示未来价格可能的运动方向。平均而言,这些信号的准确率超过 98%。有关该指标如何工作的详细说明,请观看本页面上的视频演示。 该系统使用 止损订单 和 动态回撤平仓机制 来管理交易。 Divergence Bomber 指标的主要特点: 支持交易的品种: AUDCAD、AUDCHF、AUDSG
SignalTech MT5
Yue Wang
5 (26)
SignalTech MT5 is an unique fully rule based trading system for EURUSD, USDCHF, USDJPY, AUDUSD, NZDUSD, EURJPY, AUDJPY, NZDJPY, CADJPY.  All the winning trades with chart setups are published on the comments page. 2026-05 3690 Pips (Until 05-26 NY Closed) 2026-04 2243 Pips 2026-03 2165 Pips 2026-02 2937 Pips 2026-01 2624 Pips 2025-12 1174 Pips It can generate signals with Buy/Sell Arrows and Pop-Up/Sound Alerts. Each signal has clear Entry and Stop Loss levels, which should be automatically flag
Azimuth Pro
Ottaviano De Cicco
5 (7)
Azimuth Pro V2:MT5合成分形结构分析与确认入场 概述 Azimuth Pro 是 Merkava Labs 推出的多层级波段结构指标。四层嵌套波段层级、锚定波段的VWAP、ABC形态识别、三时间框架结构过滤以及收盘确认入场——一个图表,一个从微观波段到宏观周期的完整工作流程。 这不是盲目的信号产品。它是一个以结构为先的工作流程,专为重视位置、背景和时机的交易者打造。 V2上市优惠 — Azimuth Pro V2售价USD 399(接下来的100份)。最终价格:USD 499。 1. V2的变化 合成多时间框架引擎 高时间框架分析从零开始重建,采用与Meridian Pro相同的专有合成架构。更清晰的HTF背景、稳定的实时行为、无经典MTF同步问题。合成引擎还解锁了 固定比率时间框架级联 (x2、x3、x4、x6)——不再在经纪商的固定时间框架之间任意跳转,您可以按图表时间框架的固定倍数分析结构,在每个尺度上保持相同的分形关系。 确认入场箭头 作为稳定且可恢复的执行层而设计的收盘确认箭头。当ABC设置形成且自适应确认逻辑在收盘K线上验证方向时,箭头会写入下一根K线的
介绍     Quantum Breakout PRO   ,突破性的 MQL5 指标,正在改变您交易突破区域的方式!由拥有超过13年交易经验的资深交易员团队开发,     量子突破 PRO     旨在通过其创新和动态的突破区域策略将您的交易之旅推向新的高度。 量子突破指标将为您提供带有 5 个利润目标区域的突破区域的信号箭头,以及基于突破框的止损建议。 它既适合新手交易者,也适合专业交易者。 量子 EA 通道:       点击这里 重要的!购买后请私信我领取安装手册。 建议: 时间范围:M15 货币对:GBPJPY、EURJPY、USDJPY、NZDUSD、XAUUSD 账户类型:ECN、Raw 或 Razor,点差极低 经纪商时间:GMT +3 经纪商:IC Markets、Pepperstone with Raw 和 Razor 的点差最低 规格: 不重漆! 最多 5 个建议利润目标区域 建议止损水平 可定制的盒子。您可以设置自己的 Box Time Start 和 Box Time End。 接触 如果您有任何疑问或需要帮助,请通过私人消息与我联系。
ARIPoint
Temirlan Kdyrkhan
1 (1)
ARIPoint is a powerful trading companion designed to generate high-probability entry signals with dynamic TP/SL/DP levels based on volatility. Built-in performance tracking shows win/loss stats, PP1/PP2 hits, and success rates all updated live. Key Features: Buy/Sell signals with adaptive volatility bands Real-time TP/SL/DP levels based on ATR Built-in MA Filter with optional ATR/StdDev volatility Performance stats panel (Success, Profit/Loss, PP1/PP2) Alerts via popup, sound, push, or email Cu
Quantum TrendPulse
Bogdan Ion Puscasu
5 (25)
介绍 Quantum TrendPulse   ,这是一款终极交易工具,它将 SuperTrend   、   RSI 和 Stochastic 的强大功能整合到一个综合指标中,以最大限度地发挥您的交易潜力。该指标专为追求精准和效率的交易者而设计,可帮助您自信地识别市场趋势、动量变化以及最佳进入和退出点。 主要特点: 超级趋势整合: 轻松跟随当前的市场趋势并乘上盈利浪潮。 RSI 精度: 检测超买和超卖水平,非常适合把握市场逆转时机,可用作 SuperTrend 的过滤器 随机精度: 利用随机振荡在波动的市场中寻找隐藏的机会, 用作超级趋势的过滤器 多时间范围分析: 从 M5 到 H1 或 H4,在不同时间范围内关注市场动态。 可定制的警报: 当您的自定义交易条件得到满足时收到通知,这样您就不会错过任何交易。 无论您是新手还是经验丰富的交易员,   Quantum TrendPulse 都能为您提供所需的优势,帮助您增强策略并自信地进行交易。借助这一强大的指标,将洞察力转化为利润 — 掌控您的交易! ***购买 Quantum TrendPulse,即可免费获得 Quantum Tr
M30/H1/H4 波段版已上线 想抓住M5/M15无法捕捉的大行情? Gold Signal Swing Pro(M30/H1/H4)现已发售。 目标每笔$20-$80+。 https://www.mql5.com/en/market/product/177643 KURAMA GOLD SIGNAL PRO(MT5版)— 7层过滤器 XAUUSD完整交易系统 不重绘。不重画。不延迟。每个信号确认后永久固定。 买断版购买者专属福利:购买买断版许可证可免费获得 AI Zone Radar(价值$59)+ PDF使用手册。购买后请在MQL5上给我发消息。 AI Zone Radar: https://www.mql5.com/en/market/product/175834 在真实黄金交易员社区中使用,因精度和易用性获得高度评价。 你的问题 — 以及解决方案 黄金每天波动$30-$50。你知道机会就在那里。但你是否经历过: - 入场过早,价格反向运行$10后才朝你预期的方向走 - 每
Trend Forecaster
Alexey Minkov
5 (7)
Trend Forecaster – Since 2023. The Trend Forecaster indicator utilizes a unique proprietary algorithm to determine entry points for a breakout trading strategy. The indicator identifies price clusters, analyzes price movement near levels, and provides a signal when the price breaks through a level. The Trend Forecaster indicator is suitable for all financial assets, including currencies (Forex), metals, stocks, indices, and cryptocurrencies. You can also adjust the indicator to work on any time
首先,值得强调的是,这个交易工具是非重绘、非重画和非滞后的指标,非常适合专业交易。 在线课程,用户手册和演示。 智能价格行动概念指标是一个非常强大的工具,既适用于新手,也适用于经验丰富的交易者。它将超过20个有用的指标合并到一个指标中,结合了高级交易思想,如内圈交易员分析和智能资金概念交易策略。该指标侧重于智能资金概念,提供有关大型机构交易方式的见解,帮助预测它们的动向。 它在流动性分析方面尤其擅长,有助于理解机构的交易方式。它擅长预测市场趋势,并仔细分析价格波动。通过将您的交易与机构策略对齐,您可以更准确地预测市场走向。该指标多才多艺,擅长分析市场结构,识别重要的订单区块,并识别各种模式。 它擅长识别BOS和CHoCH等模式,理解动量的转变,并突出显示供需强劲的关键区域。它还擅长发现强大的不平衡,并分析价格创造更高高点或更低低点的模式。如果您使用斐波那契回撤工具,该指标可以满足您的需求。它还可以识别相等的高点和低点,分析不同的时间框架,并通过仪表板显示数据。 对于使用更高级策略的交易者,该指标提供了工具,如公平价值差指标和优惠和折扣区域的识别。它特别关注高时间框架订单区块,并
Meridian Pro
Ottaviano De Cicco
5 (2)
Meridian Pro 2.00:MT5 专业多周期趋势矩阵 Meridian Pro 2.00 是面向 MetaTrader 5 的专业自适应趋势矩阵。它结合了原始 Meridian 趋势引擎、清晰的图表 ribbon、收盘柱确认箭头、8 周期 dashboard、Fuel 动量、加权共识、合成 HTF 处理,以及直接显示在当前图表上的高周期环境线。 目标很简单:在一个有纪律的 workflow 中读取当前趋势、多周期结构、强度、动量和 EA-ready 状态,而不是在多个图表上堆叠互不关联的指标。 Meridian Pro 的不同之处 一个自适应引擎 - 同一套波动率感知 Meridian 逻辑应用于 M1 到 W1。 合成 HTF 架构 - 高周期行由低周期数据推导,减少传统零售 MTF 中常见的 repaint、同步延迟和 broker-dependent HTF 质量问题。 完整矩阵输出 - Bias、Strength、Fuel 和加权 Consensus 一起显示,而不是拆成独立工具。 图表执行层 - ribbon 和箭头专注于当前周期,选配 HTF 线在同一图表上增加高
Btmm state engine pro
Garry James Goodchild
5 (5)
BTMM State Engine Pro is a MetaTrader 5 indicator for traders who use the Beat The Market Maker approach: Asian session context, kill zone timing, level progression, peak formation detection, and a multi-pair scanner from a single chart. It combines cycle state logic with a built-in scanner dashboard so you do not need the same tool on many charts at once. What it does Draws the Asian session range; session times can follow broker server offset or be set in inputs. Tracks level progression (L
PZ Trend Trading MT5
PZ TRADING SLU
3.8 (5)
许多盈利交易者不仅知道如何识别市场趋势,而且也能把握趋势建立后的交易机会。 Pz 趋势交易 指标设计用来在趋势行情中尽可能的赚取利润。 已建立的趋势提供了一揽子交易机会,但大多数趋势交易指标完全忽视了它们,让交易者在趋势行情时完全不知道该如何做!一般趋势指标只通知有关的趋势变化,但根本不足以得到卓越的回报. Pz 趋势交易 指标比一般趋势指标显示多达 20 倍的交易 , 因为它注重所谓的市场时机。它不仅显示当前的市场趋势,也有回调,内柱线的突破和调整。它令您在趋势回调之后介入,安全的柱线内突破金字塔加仓,以及发现潜在的反转,和已知的调整。 趋势改变 一个趋势改变在市场方向变化时发生。趋势变化在图表上用带数字的彩色圆圈显示。蓝色 (1) 信号为上涨开始, 而红色 (1) 信号为下跌开始。趋势变化并非评估当前价格动作的结果, 它意味着交易设置是不定时地。如果您正确使用本指标, 在趋势变化时, 您将将已经入场 (参看下面的调整)。 回调 但凡趋势在运动中,行情上下抖动,盈利者收割利润,且其它参与者入场。趋势回调代表好的买入机会,通常是由主力获利离场导致。如果行情在回调后回归上行, 指标将
RelicusRoad Pro MT5
Relicus LLC
4.96 (24)
RelicusRoad Pro: 量化市场操作系统 终身访问限时 70% 折扣 - 加入 2,000+ 交易员社区 为什么大多数交易者即使拥有“完美”指标也会失败? 因为他们在真空中交易 单一概念 。没有背景的信号是赌博。要持续获胜,您需要 共振 (CONFLUENCE) 。 RelicusRoad Pro 不是一个简单的箭头指标。它是一个完整的 量化市场生态系统 。它描绘价格运行的“公允价值之路”,区分市场噪音和真实的结构性突破。 停止猜测。开始用机构级“路”逻辑进行交易。 核心引擎:“Road” (路) 算法 系统的核心是 Road Algo ,一个实时适应市场条件的动态波动率通道。它投射出 安全线 (平衡) 和价格可能反转的 扩展水平 。 Simple Road: 典型市场的标准结构映射。 Smooth Road: 针对震荡盘整的降噪计算。 Breakout Road: 专为识别波动率扩张和爆发性走势而调整。 1. 算法动量与确认 我们的“剥头皮箭头”不只是简单的交叉。它们利用 高阶多项式逻辑 过滤噪音,确保信号与主周期一致。我们检测动量、价格行为和 Road 结构汇聚的精确入场
KT Alpha Hunter Arrows MT5
KEENBASE SOFTWARE SOLUTIONS
大多数箭头指标只给你一个信号,然后让你自己去判断剩下的一切。KT Alpha Hunter Arrows 为你提供完整的交易计划。 每一个信号箭头出现时,都会同时绘制一套完整计划:入场线、止损位、四个止盈目标,以及实时优势判断,告诉你当前这个交易品种和时间周期是否值得交易。随附的 Trade Manager EA 会在你手动入场后负责后续执行,让你在市场波动剧烈、情绪干扰明显时也能保持交易纪律。不重绘。仅在K线收盘后确认信号。适用于 Forex、黄金、指数以及任何你在 MT5 上交易的品种。 核心功能 不重绘买入和卖出箭头,只在K线收盘后生成。 每个信号都会显示入场线、结构性止损位和四个止盈目标。 Edge Dashboard 会分别评估当前图表上的买入和卖出机会。 判断系统包括:No Edge、Marginal、Tradeable、Good 或 Strong。 一键 Auto Optimize 按钮可根据当前品种和时间周期自动优化设置。 完整套装包含 Trade Manager EA,并提供五种专为本指标设计的预设交易管理方案。 Prop Firm Risk Panel 可在图表上
PZ Swing Trading MT5
PZ TRADING SLU
5 (5)
Swing Trading 是第一个旨在检测趋势方向的波动和可能的反转波动的指标。它使用在交易文献中广泛描述的基准摆动交易方法。该指标研究多个价格和时间向量,以追踪总体趋势方向,并检测市场超卖或超买并准备好进行修正的情况。 [ 安装指南 | 更新指南 | 故障排除 | 常见问题 | 所有产品 ] 市场波动的利润不会被窃取 指示器始终显示趋势方向 彩色价格带代表机会基准 彩色虚线表示可能的反转波动 该指标分析其自身的质量和性能 它实现了一个多时间仪表板 可定制的趋势和波动周期 它实现了电子邮件/声音/推送警报 指示器为非重涂或重涂 什么是摇摆交易 摇摆交易是一种尝试在一天到一周内从证券中获得收益的交易方式,尽管某些交易最终可以保持更长的寿命。摇摆交易者使用技术分析来买入弱点和卖出力量,并有耐心等待这些机会的发生,因为在发生一波抛售浪潮之后购买证券而不是陷入抛售更有意义。 机会基准 关于历史数据的大量研究证明,适合于波动交易的市场倾向于在基线价格带上下交易,基线价格带由图表显示,使用平均真实区间计算得出。波动交易者使用基线,该策略是购买常态和卖出躁狂,或做空常态并掩盖沮丧。在没有疲
MetaTrader 5 智能多层突破与回调探测器 "智能 · 简单 · 快速!" 您是否厌倦了错过高概率的突破入场机会? 您是否花费数小时扫描多张图表,试图将突破与趋势方向和货币动能对齐——却仍然错过了行情? Break Pullback 用一个指标解决所有这些问题。 什么是 Break Pullback? Break Pullback 是一款专业级 MetaTrader 5 指标,专为交易市场结构、突破和趋势延续形态的交易者而设计。 它能实时自动检测多个货币对的突破与回调形态——并通过三层确认过滤每个信号: 结构突破检测——识别图表上的关键突破位 高时间框架日线偏向——将入场与主导日线趋势方向对齐 货币强弱指数——确认配对货币间的动能失衡 结果:更少的虚假信号,更强的信心,更快的执行——无需面对图表过载。 适合哪些交易者? Break Pullback 专为使用以下方法的交易者设计: 突破与回测策略 市场结构分析(BOS、 OB Order Block 、结构位) 聪明钱概念(SMC)或 ICT 风格入场 趋势跟踪与延续形态 跨外汇和黄金(XAUUSD)的多对扫描 日内和波段
PZ Divergence Trading MT5
PZ TRADING SLU
3.71 (7)
棘手的发现和频率稀缺是最可靠的交易方案之一。该指标使用您喜欢的振荡器自动查找并扫描常规和隐藏的发散。 [ 安装指南 | 更新指南 | 故障排除 | 常见问题 | 所有产品 ] 容易交易 发现常规和隐藏的分歧 支持许多知名的振荡器 根据突破实现交易信号 显示适当的止损和获利水平 可配置的振荡器参数 可自定义的颜色和尺寸 按条形过滤大小差异 实现绩效统计 它实现了电子邮件/声音/视觉警报 为了提供广阔的市场前景,可以使用不同的振荡器在同一张图表中多次加载该指标,而不会产生干扰。该指标支持以下振荡器: RSI CCI MACD OSMA 随机 动量 很棒的振荡器 加速器振荡器 威廉姆斯百分比范围 相对活力指数 由于差异可能会扩大很多,尤其是在外汇市场中,因此该指标产生了转折:它在等待交易突破之前等待donchian突破确认差异。最终结果是带有非常可靠的交易信号的重新粉刷指示器。 输入参数 幅度:用于寻找差异的之字形周期 振荡器-选择要加载到图表的振荡器。 突破期-交易信号的突破期,以柱为单位。 发散类型-启用或禁用发散类型:隐藏,常规或两者。 最小散度单位为条形-最小散度单位为条形
The Propfolio Master Suite is the ultimate all-in-one analytical workstation for professional traders. Combining the power of the Beat The Market Maker (BTMM) methodology, Smart Money Concepts (SND/Liquidity), and Advanced Volume Profile, this suite replaces multiple different indicators with one optimized engine. Monitor up to 14 pairs simultaneously from a single chart, instantly identify market cycles, and seamlessly map institutional footprints with the click of a button. The Command Center
ARICoins
Temirlan Kdyrkhan
ARICoin is a powerful trading companion designed to generate high-probability entry signals with dynamic TP/SL/DP levels based on volatility. Built-in performance tracking shows win/loss stats, PP1/PP2 hits, and success rates all updated live. Key Features: Buy/Sell signals with adaptive volatility bands Real-time TP/SL/DP levels based on ATR Built-in MA Filter with optional ATR/StdDev volatility Performance stats panel (Success, Profit/Loss, PP1/PP2) Alerts via popup, sound, push, or email Cust
UZFX {SSS} 短线智能信号 MT5 是一款无重绘的高性能交易指标,专为在快速波动的市场中需要精准、实时信号的短线交易者、日内交易者和波段交易者设计。该指标由 (UZFX-LABS) 开发,融合了价格行为分析、趋势确认和智能过滤技术,可在所有货币对和时间周期内生成高概率的买入和卖出信号。 我推荐*的最佳时间周期:15分钟及以上。 {1小时}是我的首选。效果令人惊叹……! 注意:与{ LTL 164343 }指标结合使用,可提高获胜信号率。 使用 LTL 信号判断趋势,利用 SSS 信号确定入场时机。 这种方法将最大化您的胜率,并有效规避虚假信号。 核心功能 智能信号检测——精准识别强劲的趋势反转与延续形态。 多周期短线交易——在所有时间周期内运行流畅。 可自定义提醒——针对每个信号接收弹出窗口、电子邮件及手机通知(可配置)。 清晰可视箭头——图表上醒目的蓝色(买入)和红色(卖出)箭头。 自适应信号强度——可调节信号强度,适用于短期、中期或长期交易。 用户友好界面——简洁的图表显示,无重绘或信号延迟。 工作原理 UZFX SSS指标通过扫描价格走势来检测: 看涨反转——价格
OrderFlux | MetaTrader 5 的足迹订单流 (Footprint Orderflow) 版本 2.0 – 活跃交易者的实时 Bid/Ask 可视化 OrderFlux 是 MT5 的足迹 (Footprint) 和订单流 (Orderflow) 指标。它不仅显示价格走到了哪里,还显示了运动过程中发生了什么:每个价格水平的 Bid/Ask 成交量、Delta、失衡 (Imbalance) 和成交量分布。 许多图表只向您显示 K 线的最终结果。OrderFlux 向您展示了到达那里的过程。当您想解读市场参与度而不仅仅是 K 线形态时,这正是您所需要的。 Manual   -->   Klick 在实时图表中,OrderFlux 主要回答三个问题: 激进的买入或卖出压力目前正在哪里进入市场? 在哪些价格水平上成交量被吸收或拒绝? 当前的运动如何契合交易时段 (Session) 的背景? 您在界面中得到什么 主图表直接基于 Canvas 渲染足迹。此外还有底部徽章(时间、Delta、成交量)、可选的 Delta 摘要和 Session 背景。 流量 (Flow) 模块 DO
RFI levels PRO MT5
Roman Podpora
3.67 (3)
该指标能够准确显示反转点和价格回落区域。     行业领军人物 。您能洞察新趋势的形成,并以最高的精准度做出决策,掌控每一笔交易。 VERSION MT4     -    与……结合时,展现其最大潜力     趋势线专业版   指标 该指标显示的内容: 新趋势开始时的反转结构和反转水平及其激活。 显示屏   获利了结   和   止损   风险回报比最低的水平     RR 1:2       。 具有智能减值逻辑的止损。 显示指定指标中两种趋势类型的反转形态。 指标: 根据     趋势线     (全球趋势变化) 潮流专业版     (趋势快速变化) 简单有效   扫描器   实时趋势(新增)。 多时间框架工具筛选。 展示   利润   在 LOGIC AI 信号之后。 以下列出今日走势积极的金融工具。(RB键) 能够为终端启用通知(警报)功能,并向移动设备推送通知。 逻辑人工智能     — 利用人工智能寻找最佳切入点。 只有在启用 MTF(多时间框架分析)模式时,该功能才可用。 兼容性。 当与趋势线指标结合使用时,该指标能发挥其最大潜力。 这     RFI LEVELS
OmniSync Projection
Antonio-alin Teculescu
5 (1)
Chronos Fractal Engine is an innovative price projection indicator for MetaTrader 5, designed to transform your technical analysis by intelligently identifying and projecting historical price patterns. Built upon an advanced correlation algorithm and the fractal principles of the market, this powerful tool visualizes potential future price movements, giving you a unique edge in your trading decisions. What is Chronos Fractal Engine? At its core, the Chronos Fractal Engine employs a sophisticat
CRT Multi-Timeframe Market Structure & Liquidity Sweep Indicator Non-Repainting | Multi-Asset | MT4 Version Available MT4 Version: https://www.mql5.com/en/market/product/162556 Full Setup Guide: https://www.mql5.com/en/blogs/post/767525 Indicator Overview CRT Ghost Candle HTF Fractal is a complete institutional-grade market structure toolkit for MetaTrader 5. It projects higher-timeframe candle structure, CRT trap levels, session levels, previous period highs and lows, pivot points, and a real
Trend Lines PRO MT5
Roman Podpora
5 (1)
趋势线专业版 -     有助于了解市场真正转变的方向。该指标显示了真正的趋势反转点以及主要参与者重新入场的点位。 你看     BOS线路   无需复杂设置或不必要的干扰,即可在高时间框架内显示趋势变化和关键水平。信号不会重绘,并在K线收盘后仍保留在图表上。 MT4 版本   - 与 RFI LEVELS PRO 指示器结合使用时,可发挥其最大潜力 该指标显示的内容: 真正的转变   趋势线(BOS线) 一旦信号出现,它就始终有效!这与会重绘的指标有着重要的区别,后者可能会发出信号后又改变信号,从而导致资金损失。现在,您可以更精准、更准确地进入市场。此外,还有一个功能:在箭头出现后,K线会着色,直到达到目标价位(止盈)或出现反转信号为止。 重复条目   以及主要玩家的充值 为了提高寻找入场点时的视觉清晰度,我们创建了一个模块,该模块首先显示买入/卖出区域,并在该区域内寻找最佳入场点。此外,我们还加入了智能逻辑来管理止损位,该逻辑会随着时间的推移逐步降低止损位的大小,从而降低入场时的初始风险( 移动止损位 )。 信号强度水平     (BOS) 该指标采用三个显著性等级来衡量趋势变化
Grabber System MT5
Ihor Otkydach
4.83 (23)
向您介绍一款优秀的技术指标——Grabber,它是一套即开即用的“全包式”交易策略。 在一个代码中集成了强大的市场技术分析工具、交易信号(箭头)、提醒功能和推送通知。 每位购买该指标的用户还可免费获得以下内容: Grabber辅助工具:用于自动管理已开仓位 视频操作指南:逐步教学如何安装、设置和使用该指标进行交易 原创Set文件:可快速自动配置,帮助实现最佳交易效果 忘掉其他策略吧!只有Grabber能够真正激励你在交易中攀登新高峰! Grabber策略的主要特点: 交易周期:从M5到H4 适用资产:任意,但我推荐我亲自测试过的品种(GBPUSD、GBPCAD、GBPCHF、AUDCAD、AUDUSD、AUDSGD、AUDCHF、NZDUSD、NZDCAD、EURCAD、EURUSD、EURAUD、EURGBP、EURCHF、USDCAD、USDSGD) 交易时间:全天候 24/7 交易效果:我分享自己的真实交易结果,并在此教学如何操作: https://www.mql5.com/ru/market/product/134563?source=Site+Market+MT5+Indic
Entry Points Pro for MT5
Yury Orlov
4.48 (140)
这款指标用于 MT5,可提供准确的入场交易信号,且无重绘。 它可应用在任何金融资产:外汇、加密货币、贵金属、股票、指数。 它将提供极其精准的评估,并告诉您何时开仓和平仓的最佳时机。 观看 视频 (6:22),其中包含一个仅处理单一信号的示例,该信号即可值回指标购价! 大多数交易者在 Entry Points Pro 指标的帮助下,在第一个交易周内即改善了他们的交易结果。 订阅我们的 Telegram 群 ! Entry Points Pro 指标的益处。 入场信号无重绘 如果信号出现,并得到确认,则它不会再消失;不像是重绘指标,它会导致重大的财产损失,因为它们可以在显示信号后再将其删除。 无差错开仓 指标算法可令您找到入场交易(买入或卖出资产)的理想时机,从而提高每位交易者的成功率。 Entry Points Pro 可操作任何资产 它允许您在 MT5 平台上交易任何经纪商的加密货币、股票、贵金属、指数、大宗商品和货币。 提供任何方向的信号 Entry Points Pro 指标提供针对任意价格走势的入场交易信号 - 上涨、下跌或横盘(横向)。 最大盈利潜力 离场信号
“ Dynamic Scalper System MT5 ”指标专为在趋势波内进行剥头皮交易而设计。 已在主要货币对和黄金上进行测试,并可与其他交易工具兼容。 提供顺势短线建仓信号,并提供额外的价格变动支持。 指标原理: 大箭头决定趋势方向。 在趋势波内,我们采用一种生成小箭头形式的剥头皮交易信号的算法。 红色箭头代表看涨方向,蓝色箭头代表看跌方向。 敏感的价格变动线会沿着趋势方向绘制,并与小箭头信号协同作用。 信号运作方式如下:当线在适当时刻出现时,将形成入场信号;在出现线时,持仓;线完成后,平仓。 建议的操作时间范围为M1 - H4。 箭头在当前K线上方形成,如果下一根K线已开仓,则不会重新绘制上一根K线上方的箭头。 输入参数 Trend Wave Period - 趋势方向(大箭头)的周期,改变趋势波的时间间隔。值 1 表示趋势方向的最长持续时间,参数值越大,持续时间越短。 Scalper Arrows Period - 信号箭头(小箭头)的计算周期,改变入场信号的生成频率。值 3 表示最频繁的生成频率,参数值越大,箭头频率越低,准确度越高。 这些参数可以根据不同
Killer Combo System
Alex Amuyunzu Raymond
Killer Combo System is a multi-strategy indicator designed to highlight potential reversal and continuation setups by combining several technical modules in one tool. It provides flexible configuration, allowing users to enable or disable different confirmation filters according to their own trading approach. Available Modules RSI and CCI Divergence Detection MACD Crossovers Candlestick Pattern Recognition Multi-Timeframe Filtering Moving Average and Bollinger Band Trend Filters Signal Labels an
作者的更多信息
The selective pin bar is designed to identify reversals. To use the selective pin bar effectively, traders typically look for Strong Rejection: The tail of the pin bar should extend significantly beyond the surrounding price action. It indicates that there was a sharp rejection of higher or lower prices during the trading period. A strong rejection suggests that the market sentiment may be changing.
FREE
The Scaled Awesome Oscillator (SAO) represents a refined adaptation of the Awesome Oscillator, aimed at establishing consistent benchmarks for identifying market edges. Unlike the standard Awesome Oscillator, which records the variation in pips across different commodities, the only unchanging reference point is the zero line. This limitation hampers investors and traders from pinpointing specific levels for trend reversals or continuations using the traditional Awesome Indicator, a creation of
FREE
The selective pin bar is designed to identify reversals. To use the selective pin bar effectively, traders typically look for Strong Rejection: The tail of the pin bar should extend significantly beyond the surrounding price action. It indicates that there was a sharp rejection of higher or lower prices during the trading period. A strong rejection suggests that the market sentiment may be changing.
FREE
VolumeCrossOver Mt4
Daniel Opoku
4 (1)
Volume Cross Over is an indicator that measure positive and negative volume flow in a financial instrument, such as a stock, commodity, or index. It is base on the idea of On-Balance Volume developed by  Joseph Granville. However instead of trending lines, this indicator shows volume cross over.  When  the closing price of an asset is higher than the previous  closing price, then the Bull volume is greater  than zero and Bear volume is negative. It suggests that buying volume is dominating, an
FREE
Volume Cross Over is an indicator that measure positive and negative volume flow in a financial instrument, such as a stock, commodity, or index. It is base on the idea of On-Balance Volume developed by  Joseph Granville. However instead of trending lines, this indicator shows volume cross over.  When  the closing price of an asset is higher than the previous  closing price, then the Bull volume is greater  than zero and Bear volume is negative.  It suggests that buying volume is dominating, and
FREE
The Scaled Awesome Oscillator (SAO) represents a refined adaptation of the Awesome Oscillator, aimed at establishing consistent benchmarks for identifying market edges. Unlike the standard Awesome Oscillator, which records the variation in pips across different commodities, the only unchanging reference point is the zero line. This limitation hampers investors and traders from pinpointing specific levels for trend reversals or continuations using the traditional Awesome Indicator, a creation of
FREE
掌握精准交易 —— 选用 Wamek 趋势咨询工具 告别猜测,开始自信交易。Wamek 趋势咨询是你的先进工具包,帮助你精准把握高概率入场机会,减少虚假信号,并在任何交易策略中最大化盈利。 为什么交易者选择 Wamek 趋势咨询? 激光般精准的趋势识别 我们独家开发的算法能够以外科手术般的精度识别早期反转和持续趋势,过滤市场噪音,提供可执行的交易信号。 为你的策略量身定制 可针对任何交易工具自定义过滤器,调整阈值,精细优化进场点,使信号与您的风险承受能力和目标完美匹配。 随心交易,灵活适配 无论是剥头皮交易、波段交易,还是长期持仓,Trend Consult 都能无缝适配所有时间周期和交易风格。初学者可清晰掌握方向,高手则进一步提升胜率。 完全掌控,自由无束 我们不会强制设定止损或止盈点。你的交易策略仍由你掌控——我们的信号是为了辅助你的决策,而不是取代它。 信号不重绘 一旦箭头在图表上出现,其位置不会再改变。 使用方法(仅需两步) 买入(BUY) :当箭头出现在前一根蜡烛低点下方时。 卖出(SELL) :当箭头出现在前一根蜡烛高点上方时。 全新升级,灵活无匹 优化输入参数
BreakOut Consult MT4 隆重推出 BreakOut Consult,一款将您交易提升到新高度的革命性工具! 我们的尖端算法结合了多种趋势和振荡指标,生成精准的买入和卖出信号,是任何交易者的强大助手。 借助 BreakOut Consult,您可以轻松识别市场中的突破点。我们的动态通道使用支撑位和阻力位来检测突破,算法可以识别两种类型的突破,确保您不错过任何一个黄金机会: 从 上方突破阻力位 和从 下方突破支撑位 从 下方突破阻力位 和从 上方突破支撑位 当出现买入突破时,会显示一个 向上箭头 ;当出现卖出突破时,会显示一个 向下箭头   —— 就这么简单! 我们的算法适用于所有市场,包括: 外汇、大宗商品、股票和加密货币 。不论您是剥头皮交易者、波段交易者还是趋势持仓交易者,BreakOut Consult 都能帮助您在任何时间周期上捕捉突破信号。 我们深知虚假突破可能带来的问题,因此算法中加入了高级过滤机制,有效减少假信号,使 BreakOut Consult 更加可靠与高效。 优点与不足 一旦信号箭头在蜡烛图收盘后出现在图表上,它 永远不会消失 ,让您更加自
ReSu mt4
Daniel Opoku
The Wamek Support and Resistant (WSR) Indicator is a remarkable tool that stands out in the world of technical analysis. It sets itself apart by cleverly combining price action and leading indicators to delineate support and resistance levels with a high degree of accuracy. Its unique feature is its adaptability; users can fine-tune the indicator by adjusting input parameters, enabling them to create customized support and resistance levels that suit their trading strategies. Notably, one of WSR
解锁机构级交易策略,使用我们的先进供需区指标! 利用我们的 供需区指标 ,掌握机构交易策略,精准识别金融市场中的 高胜率买卖点 !通过定位机构资金的买入和卖出区域,该指标让您能与市场大玩家同步交易,把握重大趋势反转,提升盈利机会! 为什么这款指标是专业交易者的必备工具? 无限历史区域扫描 – 自动检测并可视化关键的供需区,无需手动分析,适用于任何时间周期和资产。 精准锁定高盈利区域 – 该指标能清晰标记市场供需区,帮助您预测市场反转和突破,提高交易成功率。 自动扫描K线 – 实时信号提示潜在的入场点,让交易决策更加智能化。 清晰的颜色编码区域 : 粉色区域(供应区) – 突破后变成需求区,但颜色保持不变。 天蓝色区域(需求区) – 突破后变成供应区,颜色仍保持不变。 自动识别关键交易模式 : Drop-Base-Drop(DBD) & Rally-Base-Drop(RBD) – 供应区。 Drop-Base-Rally(DBR) & Rally-Base-Rally(RBR) – 需求区。 掌握机构交易者的优势 大多数散户交易者亏损的原因是他们无法看到“聪明资金”(Smart Mon
Tabow3 mt4
Daniel Opoku
发现更智能、更 versatile 的交易体验:Tabow 3.7 Tabow 3.7 是我们精密构建的智能交易系统 (EA) 的最新演进版本,旨在利用 Awesome 振荡器 (AO) 帮助交易者识别潜在的顶部和底部。此更新版本通过在代码中直接嵌入五种不同的交易策略,显著扩展了您的策略工具包。 Tabow 3.7 不仅仅执行交易;它集成了先进的内部条件和动态交易管理工具,以提供基于规则的、结构化的执行。这些策略分为两类,以实现更细致的方法: SAO_Dev 和 SAO_Norm:   这些策略将 AO 阈值条件与价格行动相结合,并利用 Cval——一个适应四种不同市场条件的多状态变量。 SAO_Valley、SAO_Mount 和 SAO_Perky:   这些策略依赖于 AO 阈值条件与价格行动的结合,提供了一种更直接的方式来捕捉市场走势。 该 EA 旨在提供更大的灵活性,现在支持在受控条件下以单向进行多个同时交易。当出现新的设置时,系统会验证自首次入场以来是否至少过去了五根K线,然后才允许执行另一笔交易。它包含了精心调整的止盈 (TP) 和止损 (SL) 机制,滑点以4位报价经纪
掌握精准交易 —— 选用 Wamek 趋势咨询工具 告别猜测,开始自信交易。Wamek 趋势咨询是你的先进工具包,帮助你精准把握高概率入场机会,减少虚假信号,并在任何交易策略中最大化盈利。 为什么交易者选择 Wamek 趋势咨询? 激光般精准的趋势识别 我们独家开发的算法能够以外科手术般的精度识别早期反转和持续趋势,过滤市场噪音,提供可执行的交易信号。 为你的策略量身定制 可针对任何交易工具自定义过滤器,调整阈值,精细优化进场点,使信号与您的风险承受能力和目标完美匹配。 随心交易,灵活适配 无论是剥头皮交易、波段交易,还是长期持仓,Trend Consult 都能无缝适配所有时间周期和交易风格。初学者可清晰掌握方向,高手则进一步提升胜率。 完全掌控,自由无束 我们不会强制设定止损或止盈点。你的交易策略仍由你掌控——我们的信号是为了辅助你的决策,而不是取代它。 信号不重绘 一旦箭头在图表上出现,其位置不会再改变。 使用方法(仅需两步) 买入(BUY) :当箭头出现在前一根蜡烛低点下方时。 卖出(SELL) :当箭头出现在前一根蜡烛高点上方时。 全新升级,灵活无匹 优化输入参数
BreakOut Consult MT5 隆重推出 BreakOut Consult,一款将您交易提升到新高度的革命性工具! 我们的尖端算法结合了多种趋势和振荡指标,生成精准的买入和卖出信号,是任何交易者的强大助手。 借助 BreakOut Consult,您可以轻松识别市场中的突破点。我们的动态通道使用支撑位和阻力位来检测突破,算法可以识别两种类型的突破,确保您不错过任何一个黄金机会: 从 上方突破阻力位 和从 下方突破支撑位 从 下方突破阻力位 和从 上方突破支撑位 当出现买入突破时,会显示一个 向上箭头 ;当出现卖出突破时,会显示一个 向下箭头 —— 就这么简单! 我们的算法适用于所有市场,包括: 外汇、大宗商品、股票和加密货币 。不论您是剥头皮交易者、波段交易者还是趋势持仓交易者,BreakOut Consult 都能帮助您在任何时间周期上捕捉突破信号。 我们深知虚假突破可能带来的问题,因此算法中加入了高级过滤机制,有效减少假信号,使 BreakOut Consult 更加可靠与高效。 优点与不足 一旦信号箭头在蜡烛图收盘后出现在图表上,它 永远不会消失 ,让您更加自信地
解锁机构级交易策略,使用我们的先进供需区指标! 利用我们的 供需区指标 ,掌握机构交易策略,精准识别金融市场中的 高胜率买卖点 !通过定位机构资金的买入和卖出区域,该指标让您能与市场大玩家同步交易,把握重大趋势反转,提升盈利机会! 为什么这款指标是专业交易者的必备工具? 无限历史区域扫描 – 自动检测并可视化关键的供需区,无需手动分析,适用于任何时间周期和资产。 精准锁定高盈利区域 – 该指标能清晰标记市场供需区,帮助您预测市场反转和突破,提高交易成功率。 自动扫描K线 – 实时信号提示潜在的入场点,让交易决策更加智能化。 清晰的颜色编码区域 : 粉色区域(供应区) – 突破后变成需求区,但颜色保持不变。 天蓝色区域(需求区) – 突破后变成供应区,颜色仍保持不变。 自动识别关键交易模式 : Drop-Base-Drop(DBD) & Rally-Base-Drop(RBD) – 供应区。 Drop-Base-Rally(DBR) & Rally-Base-Rally(RBR) – 需求区。 掌握机构交易者的优势 大多数散户交易者亏损的原因是他们无法看到“聪明资金”(Smart Mon
Tabow3 mt5
Daniel Opoku
发现更智能、更 versatile 的交易体验:Tabow 3.7 Tabow 3.7 是我们精密构建的智能交易系统 (EA) 的最新演进版本,旨在利用 Awesome 振荡器 (AO) 帮助交易者识别潜在的顶部和底部。此更新版本通过在代码中直接嵌入五种不同的交易策略,显著扩展了您的策略工具包。 Tabow 3.7 不仅仅执行交易;它集成了先进的内部条件和动态交易管理工具,以提供基于规则的、结构化的执行。这些策略分为两类,以实现更细致的方法: SAO_Dev 和 SAO_Norm:   这些策略将 AO 阈值条件与价格行动相结合,并利用 Cval——一个适应四种不同市场条件的多状态变量。 SAO_Valley、SAO_Mount 和 SAO_Perky:   这些策略依赖于 AO 阈值条件与价格行动的结合,提供了一种更直接的方式来捕捉市场走势。 该 EA 旨在提供更大的灵活性,现在支持在受控条件下以单向进行多个同时交易。当出现新的设置时,系统会验证自首次入场以来是否至少过去了五根K线,然后才允许执行另一笔交易。它包含了精心调整的止盈 (TP) 和止损 (SL) 机制,滑点以4位报价经
筛选:
无评论
回复评论