 MetaTrader 5
 专家
专家
 指标
指标
 程序库
程序库
 实用工具
实用工具
 窗口小部件
窗口小部件
 规则
规则
适用于MetaTrader 5的技术指标 - 211
 技术指标的信号外汇和股票市场的开仓交易和平仓交易起着至关重要的作用。指标的本质就是一种交易品种的数学转换,旨在预测未来的价格变化。
测试技术指标可以更有利于预测市场行为并从中获利。
技术指标的信号外汇和股票市场的开仓交易和平仓交易起着至关重要的作用。指标的本质就是一种交易品种的数学转换,旨在预测未来的价格变化。
测试技术指标可以更有利于预测市场行为并从中获利。 
What Gets Drawn Most level tools mark every swing they can find, and a chart with forty lines answers nothing. This one keeps a level only when price came back to it, and prints the evidence next to the line: the number of touches and the age in days. Lines above current price and lines below it are drawn in different colours, so the map reads at a glance without counting. What Puts A Level On The Chart A swing high is a bar whose high is not lower than its neighbours on both sides, within the n
FREE

RelicusRoad 是适用于 MetaTrader 4 和 MetaTrader 5 的流动性价位指标,围绕一条中线绘制一组基于波动率的价位通道,让你一眼看出价格是接近近期均值,还是已经伸展到该设定目标位与止损位的边缘。 中线是近期价格的加权均值。上方是三条 Sell 价位,下方是三条 Buy 价位,每一条都比前一条再远一个固定步长,因此只有当价格已经远离均值时,才会到达最外侧的线。 每条线告诉你什么 标记为 Safe Close 的 Neutral 线:近期价格的平衡点;交易回到这里,算是完成了它份内的普通任务。 标记为 TP/SL-1 的 Level 1:一次摆动的正常幅度;在趋势中,价格常常沿趋势一侧贴着这条线运行。 标记为 TP/SL-2 的 Level 2:价格已经伸展;可以在这里落袋部分仓位或收紧止损。 标记为 TP/SL-3 的 Level 3:极值位置;把它当作当前交易的目标位,而不是在同方向开新仓的地方。 上下带宽不对称:上下两侧分别测量,因此一轮强劲上涨之后,上方的带宽往往扩张得更多。 在通道内交易 在边缘反向交易:价格到达 Level 2 或 Level 3

Pivot Box Range draws daily pivot levels and a high-low range box for each day, and it fixes the one thing that quietly breaks most pivot indicators: the broker's short days.
THE SHORT DAY PROBLEM
Most brokers open a Sunday candle that lasts only an hour or two, and some holidays produce half sessions. A pivot indicator that treats those as a full day calculates Monday's levels from almost no data, and the levels land in the wrong place for the whole week.
This indicator merges a short day i
FREE

RangeMoveLine – MT5 Indicator RangeMoveLine is a simple price-action based MT5 indicator designed to track meaningful price movement while filtering out small market fluctuations. The indicator monitors the opening price of each selected timeframe candle and maintains an anchor level. When the price remains within the defined range, the line stays flat. When a candle open moves beyond the selected range, the RangeMoveLine immediately jumps to the new price level. Key Features Dynamic Step Lin

BREAKOUT DIVERGENCE SCANNER PRO - AUTOMATED RSI DASHBOARD
PRODUCT DETAILS
Product Type : MetaTrader 5 Technical Indicator
Category : Multi-Asset & Multi-Timeframe Divergence Scanner Panel
Compatibility : MetaTrader 5 (MT5) Desktop
Trading Style : Scalping, Day Trading, Swing Trading, Position Trading
Timefra

Quant Trend Cloud A cloud that is a regime, not a thread: the band between two slow adaptive lines. No arrows and no dots - the colour says which way the regime stands, and the brightness says whether the candle and the fast line stand clear of the band on that bar. Version 1.0. Release notes, chart examples and new product announcements are posted on the TrendTower channel: https://www.mql5.com/en/channels/trendtower What It Is The cloud is the band between Kaufman's adaptive average and VIDYA.
FREE

ScalpingPro — an impulse scalping indicator for M1–M15 timeframes. Optimized for XAUUSD and major FX pairs.
HOW IT WORKS
The indicator waits until three conditions align at once: 1. Trend: fast EMA(8) above slow EMA(21), price above the fast EMA (for buys; reversed for sells). 2. Impulse: the candle body is at least 0.6 ATR — the candle really moves the market. 3. Momentum: RSI confirms strength, the candle closes in the direction of the move.
When everything is met, a green arrow appears be

VM Trend Candles Indicator - Complete Trend Trading Solution Trend Candles Indicator is a professional, intuitive, and easy-to-use Forex trading system designed to transform complex trend analysis into clear, high-probability trading signals. Based on proven trend-following principles and enhanced with intelligent market filtering, the indicator provides accurate BUY/SELL signals together with automatically calculated Stop Loss and Take Profit levels according to market volatility. The system su

VM SuperAshi Trend Precision Trend Sniper using Smoothed Heiken Ashi, Supertrend and EMA Trend
Overview VM SuperAshi Trend is an indicator that combines a standardized Supertrend with smoothed Heiken-Ashi candles to deliver clear, confirmed, and non-repainting buy/sell signals directly on the chart. It automatically draws Buy/Sell arrows, displays Fast, Slow, and Trend EMA lines, and provides Popup, Email, and Push notifications.
Key Features Supertrend-based signal logic filtered by Heiken-Ashi

SignalArrows - Trading Signal Indicator SignalArrows is a MetaTrader 5 indicator designed to identify potential BUY and SELL signal conditions using moving-average crossover logic with additional confirmation filters. The indicator processes a signal through several stages before plotting an arrow on the chart: How It Works 1. Raw MA Cross Detection
The indicator first detects a crossover between the fast and slow moving averages. 2. Gap Confirmation
After a crossover, the indicator checks whe

Makito Trendline Indicator is a professional chart-analysis tool designed to identify relevant trendlines across multiple timeframes and monitor price interaction with them in real time.
The indicator displays potential buy and sell lines, marks confirmed signal events, and provides a dynamic exit line after a signal becomes active. It is designed to keep multi-timeframe trendline analysis organized and easy to follow directly from one chart.
KEY FEATURES
- Multi-timeframe analysis from W1 t

MT4 Version Here
Red Boxes & Discs (EQH) Equal Highs (Resistance) Buy-side liquidity. Retail stop-losses and breakout buy-stops cluster here. Green Boxes & Discs (EQL) Equal Lows (Support) Sell-side liquidity. Retail stop-losses and breakout sell-stops cluster here. Pivot Numbers (e.g. 115) Pivot Volume Volume traded specifically at that swing turning point. Tags (e.g. 2x EQH (461) ) Clustered Liquidity Multiple equal highs at the same price. Higher multiplier ( 2 × 2× ,3 × 3× ) = stronger li

MTF Oscillators and Trend Filter- M1-M3 Scalper MT5 Indicator Non repaint filter candles for fast scalping. The indicator colours the candles of your working chart when a trend filter on the chart agrees with two oscillators read from higher timeframes. When all three agree, candles turn buy or sell colour. When they do not, candles stay neutral, so you only act when the market is aligned. KEY POINTS - Built for M1, M2 and M3 charts. Recommended on M1 for this strategy. - Two higher time

Triad Regime Line Version 1.0 · algoteknik What This Indicator Is Triad Regime Line draws one line on the price chart and colours it with three Larry Williams tools: Williams %R, the Ultimate Oscillator and Williams Accumulation/Distribution. Green means the market is on a bullish side the three tools agree on, red a bearish side, and grey that they do not agree or that a new side has not been confirmed yet. The line itself is simple on purpose: it is the middle of the highest high and the lowe

Two EMA-difference histograms with confirmed crossover labels and historical BUY and SELL boxes.
Ospe Dual MACD plots two MACD-style EMA differences in one separate window: a 12/26 pair and a 5/13 pair by default. It displays colored histograms and matching lines. The color of each histogram changes with its position relative to zero and its movement from the preceding bar.
When the faster difference crosses above the slower difference on a completed candle, the indicator places a green BUY box
FREE

Индикатор основан на торговле по уровням! основан на принципе уровней и zig-zag!
Определение уровней происходит по взаимодействию индикатора zig-zag!
параметры zig-zag ставим один 5 5 5, другой стандартный
первая стрелка (прозрачная) это алерт основной!!!
а вторая стрелка это подтверждение, эта свеча закрывается противоположного цвета!
на одну свечку по направлению стрелки вход после стрелочной свечи
использую один догон!!! на следующую свечу в том-же направлении!!!!
можно использоват
FREE

Индикатор основан на торговле по уровням! основан на принципе уровней и zig-zag!
Определение уровней происходит по взаимодействию индикатора zig-zag!
параметры zig-zag ставим один 5 5 5, другой стандартный
первая стрелка (прозрачная) это алерт основной!!!!
а вторая стрелка это подтверждение, эта свеча закрывается противоположного цвета!
на одну свечку по направлению стрелки вход после стрелочной свечи
использую один догон!!! на следующую свечу в том-же направлении!!!!
можно использова
FREE

Automatically anchor a Volume-Weighted Average Price to every swing high and swing low — no manual drawing, no guesswork. Swing Anchored VWAP detects market structure in real time and plots two independent VWAP lines: one anchored to each swing high, one anchored to each swing low. Instead of a single flat VWAP that means less the further price moves from its start, this indicator resets itself at every new swing, always giving you a fresh, relevant read on where volume-weighted "fair value" sit
FREE
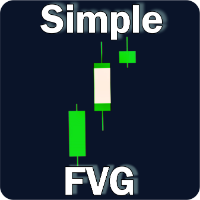
Simple Fair Value Gap Unlock the power of fair value gaps with this simple and precise, easy to use indicator designed to identify and visualize market inefficiencies
Simple Fair Value Gap is an mt5 indicator which paints the center of a fair value gap candle with a different color. A Fair Value Gap (FVG) is a three candle formation in which the middle candle does not get completely overlapped by the left and right candle. i.e The difference between the high and low of either left or right cand
FREE

Turn every candle into a bid x ask footprint built from real tick data. See who is actually trading at each price, with delta, volume profile, imbalance zones and a scored setup engine that prints entry, stop and target Order Flow Footprint Chart Pro Most indicators tell you what price did. This one tells you who did it. Order Flow Footprint Chart Pro rebuilds every candle on your chart from raw tick data and shows you the volume that traded at each individual price inside it, split into the am

解锁聪明钱的秘密:Area of Interest + Exact Fibs! 您是否厌倦了假突破和错误的入场?您想知道大型机构和银行究竟在哪里下买单和卖单吗? 了解 Area of Interest (AOI) — 这款用于 MT5 的终极精准指标, 将先进的 Pine Script 逻辑直接引入您的 MetaTrader 5 图表。 该指标自动检测做市商留下的隐藏供需区域(Supply and Demand zones), 并将其与高精度的动态斐波那契回撤系统相结合。 停止猜测您的入场点, 开始以狙击手般的精度进行交易! 核心功能(为什么这是最好的指标): 自动供需框 (Auto Demand & Supply Boxes): 在您的实时图表上自动且准确地绘制支撑和阻力区域(兴趣区域)。 精确的 Pine 自动斐波那契 (Exact Pine Auto-Fibs): 使用高级逻辑识别最新且已确认的高低枢轴点, 自动绘制关键斐波那契水平 (0. 236, 0. 382, 0. 500, 0. 618, 0. 786)。 100% 不重绘算法 (Non-Repainting): 一旦信

ADX 趋势与动量指标 ADX Trend and Momentum Indicator 是一款用于辅助识别市场方向、评估动量强弱并区分趋势与盘整行情的专业技术分析指标。 该指标基于平均趋向指数(ADX)与方向性指标(+DI 和 -DI)设计,通过变色趋势线、图表箭头以及信息仪表板直观呈现市场状态。 功能特点 变色趋势线: ADX 线根据趋势方向和预设阈值自动切换颜色(绿色表示潜在看涨,红色表示潜在看跌,橙色表示横盘整理)。 多级信号箭头: 在图表上标记初步动量、确认动量以及动能衰退的平仓提示。 震荡过滤机制: 通过可调的 Level Range 参数识别低动能区间,辅助规避无序震荡。 图表仪表板: 实时显示 ADX、+DI 和 -DI 的数值及其变动状态(上升、下降或走平)。 提醒功能: 支持常规弹窗与声音提醒,覆盖主要信号、离场提示和 DI 极值阈值。 信号逻辑与使用 看涨买入信号: 当 +DI 上穿 -DI,且 ADX 突破预设的 Level Trend(默认:35)时触发。 看跌卖出信号: 当 -DI 上穿 +DI,且 ADX 突破预设的 Level Trend 时触发。 初

JSL Orderflow Footprint turns every candle into a price ladder that shows how much volume traded on the bid and on the ask at each price level. It highlights diagonal imbalances, stacked imbalance zones, absorption at candle extremes, cumulative delta (CVD), delta divergence and the daily session volume profile, then combines five of these order-flow conditions into a 0–100 confluence score. A signal is only issued on bar close when the score is high, clearly one-sided and confirmed by the candl

NAD RSI Cross NAD RSI Cross is a simple RSI-based signal indicator that provides clear BUY and SELL signals directly on the chart. How It Works BUY — RSI 14 crosses above 30 after the candle closes. SELL — RSI 14 crosses below 70 after the candle closes. Features RSI 14 BUY level: 30 SELL level: 70 Closed-candle confirmation Clean chart with simple arrows No RSI panel Suitable for XAUUSD M1 Can also be used on other instruments and timeframes SL & TP Set your own SL and TP according to you
FREE

VM Heiken Ashi Pro
Heiken-Ashi 平滑处理(HMA 或 EMA)用于滤除噪声并生成清晰的 BUY/SELL 信号,非重绘(可选 ConfirmOnClosedBar)。在图表上显示 HA 蜡烛(可隐藏原始蜡烛),箭头位置可按 ATR 或固定偏移设置,发送提醒(弹窗、电子邮件、推送)并具备防垃圾信息处理。 主要用途
将原始蜡烛转换为平滑的 Heiken-Ashi 以检测颜色变化(空头到多头 / 多头到空头)并绘制入场箭头。选项 ConfirmOnClosedBar 使指标在蜡烛收盘后才确认信号以避免重绘。UseATRForArrowOffset 使箭头显示更合理。该指标轻量且在多个图表上稳定运行。 快速使用
附加指标,选择 Smoothing Method 和 Smoothing Period(默认 50),如需非重绘确认信号请启用 ConfirmOnClosedBar,按需启用提醒,并保存模板。 推荐时间框架
优先 H1-D1 以获得可靠信号。M5-M15 可用于剥头皮,但请小心并启用蜡烛收盘确认。 关键参数 Smoothing Period -

Spike Hnter Spike hunter is an indicator designed for trading spike indices, including Boom, Crash, PainX,GainX, Spike Up and Spike Down markets. The indicator is built to identify potential spike opportunities while using filtering conditions to help eliminate weaker or less significant signals. Rather than simply detecting every large candle, Spike Hunter analyzes the surrounding market conditions and applies configurable trend, entry filters to produce more selective spike signals. REFERRED

Индикатор основан на торговле по уровням! основан на принципе уровней и zig-zag!
Определение уровней происходит по взаимодействию индикатора zig-zag!
параметры zig-zag ставим один 5 5 5, другой стандартный
первая стрелка (прозрачная) это алерт основной!!!!!
а вторая стрелка это подтверждение, эта свеча закрывается противоположного цвета!
на одну свечку по направлению стрелки вход после стрелочной свечи
использую один догон!!! на следующую свечу в том-же направлении!!!!
можно использов
FREE

This is the test product. Please, DO NOT BUY IT! This is the test product. Please, DO NOT BUY IT! This is the test product. Please, DO NOT BUY IT! This is the test product. Please, DO NOT BUY IT! This is the test product. Please, DO NOT BUY IT! This is the test product. Please, DO NOT BUY IT! This is the test product. Please, DO NOT BUY IT! This is the test product. Please, DO NOT BUY IT!
MetaTrader市场是您可以下载免费模拟自动交易,用历史数据进行测试和优化的唯一商店。
阅读应用程序的概述和其他客户的评论,直接下载程序到您的程序端并且在购买之前测试一个自动交易。只有在MetaTrader市场可以完全免费测试应用程序。
