 MetaTrader 5
 专家
 指标
 程序库
 实用工具
 窗口小部件
 规则
适用于MetaTrader 5的技术指标 - 212
 技术指标的信号外汇和股票市场的开仓交易和平仓交易起着至关重要的作用。指标的本质就是一种交易品种的数学转换,旨在预测未来的价格变化。
测试技术指标可以更有利于预测市场行为并从中获利。

# Trend Exhaustion Meter - Composite exhaustion score
*Category: Trend | Difficulty: advanced | Window: separate window below the chart | Markets: Universal (Forex, indices, commodities, crypto, stocks) | Suggested timeframes: M30, H1, H4, D1*
## Short description
> A 0 to 100 score combining stretch from the mean, directional saturation and momentum fade. It measures the continuation risk of a move, not its reversal.
### Overview
No single symptom says a trend is about to end, but when se

# Normalized Momentum Z - Momentum in standard scores
*Category: Momentum | Difficulty: intermediate | Window: separate window below the chart | Markets: Universal (Forex, indices, commodities, crypto, stocks) | Suggested timeframes: M15, M30, H1, H4, D1*
## Short description
> Standardises momentum against its own recent historical distribution and returns a z score. A value of +2 marks a thrust stronger than roughly 97 per cent of the instrument recent moves.
### Overview
Raw momentum ha

# Momentum Curvature - Acceleration versus velocity
*Category: Momentum | Difficulty: intermediate | Window: separate window below the chart | Markets: Universal (Forex, indices, commodities, crypto, stocks) | Suggested timeframes: M15, M30, H1, H4, D1*
## Short description
> Measures price acceleration, the second derivative of the smoothed series, and compares it with velocity. It detects loss of thrust before direction changes.
### Overview
Anyone who drives knows the brake pedal acts o

# Rate Of Change Spectrum - Which horizon is driving
*Category: Momentum | Difficulty: advanced | Window: separate window below the chart | Markets: Universal (Forex, indices, commodities, crypto, stocks) | Suggested timeframes: M30, H1, H4, D1*
## Short description
> Standardises the rate of change over six horizons and identifies which one is driving the move. It shows the dominant scale score and its rank.
### Overview
Knowing the market is rising tells you little. Knowing whether it ri

# Impulse Strength Gauge - Movement weighted by volume
*Category: Momentum | Difficulty: intermediate | Window: separate window below the chart | Markets: Universal (Forex, indices, commodities, crypto, stocks) | Suggested timeframes: M5, M15, M30, H1, H4*
## Short description
> Weights every bar by combining body size in ATR units with volume relative to its average, then accumulates the contributions. It separates wide but empty bars from genuinely supported impulses.
### Overview
A wide

# Dual Horizon Momentum Delta - Short versus long, time corrected
*Category: Momentum | Difficulty: advanced | Window: separate window below the chart | Markets: Universal (Forex, indices, commodities, crypto, stocks) | Suggested timeframes: M15, M30, H1, H4, D1*
## Short description
> Compares momentum on two horizons after normalising them by the square root of time, a correction without which the long horizon would always look larger by pure construction.
### Overview
Directly comparing

# Impulse Retrace Ratio - Impulse size versus retracement size
*Category: Momentum | Difficulty: intermediate | Window: separate window below the chart | Markets: Universal (Forex, indices, commodities, crypto, stocks) | Suggested timeframes: M15, M30, H1, H4, D1*
## Short description
> Groups consecutive same sign changes into runs and compares the average size of bullish runs with that of bearish ones. It measures whether impulses are larger, not more numerous.
### Overview
A healthy upt

# Momentum Thrust Counter - Counting thrusts beyond threshold
*Category: Momentum | Difficulty: beginner | Window: separate window below the chart | Markets: Universal (Forex, indices, commodities, crypto, stocks) | Suggested timeframes: M15, M30, H1, H4, D1*
## Short description
> Counts bars moving beyond an ATR multiple and reports the net balance. The total line separates calm from battle, both of which show a balance near zero.
### Overview
Most bars on a chart carry no information: t

# Momentum Divergence Scanner - Divergences without repaint
*Category: Momentum | Difficulty: intermediate | Window: chart window (overlaid on price) | Markets: Universal (Forex, indices, commodities, crypto, stocks) | Suggested timeframes: M15, M30, H1, H4, D1*
## Short description
> Flags price to momentum divergences using confirmed swings only. The arrow appears on confirmation and is never withdrawn, unlike almost every other divergence indicator.
### Overview
Almost every divergence

# Elastic Momentum Band - Momentum driven asymmetric channel
*Category: Momentum | Difficulty: intermediate | Window: chart window (overlaid on price) | Markets: Universal (Forex, indices, commodities, crypto, stocks) | Suggested timeframes: M15, M30, H1, H4*
## Short description
> A channel deforming with momentum: the band favouring the move draws closer to the average, the opposite one moves away. It makes breaks in direction easier and counter breaks more selective.
### Overview
A symm

# Momentum Entropy Filter - Order versus randomness in thrusts
*Category: Momentum | Difficulty: advanced | Window: separate window below the chart | Markets: Universal (Forex, indices, commodities, crypto, stocks) | Suggested timeframes: M30, H1, H4, D1*
## Short description
> Computes the Shannon entropy of the recent momentum distribution and converts it into an order score from 0 to 100. It separates markets with recurring structure from those without regularity.
### Overview
Shannon e

# Realized Volatility Cone - Historical volatility percentiles
*Category: Volatility | Difficulty: intermediate | Window: separate window below the chart | Markets: Universal (Forex, indices, commodities, crypto, stocks) | Suggested timeframes: M30, H1, H4, D1*
## Short description
> Draws realized volatility together with the percentiles of its own historical distribution. It tells whether the current level is high or low for that specific instrument.
### Overview
Knowing that realized vo

# Volatility Forecast EWMA - Forecasting the next bar
*Category: Volatility | Difficulty: advanced | Window: separate window below the chart | Markets: Universal (Forex, indices, commodities, crypto, stocks) | Suggested timeframes: M15, M30, H1, H4, D1*
## Short description
> Estimates next bar volatility with an EWMA model on variance, the same scheme used in portfolio risk management, alongside the volatility actually observed.
### Overview
Every volatility indicator looks backwards and

# Volatility Regime Classifier - Classification with hysteresis
*Category: Volatility | Difficulty: intermediate | Window: separate window below the chart | Markets: Universal (Forex, indices, commodities, crypto, stocks) | Suggested timeframes: M15, M30, H1, H4, D1*
## Short description
> Classifies volatility into four regimes using a hysteresis state machine, eliminating the constant flipping typical of fixed thresholds. The active threshold is drawn.
### Overview
Classifying volatility

Alpha Gold SMC Dashboard - Institutional Order Blocks & AI Scoring Matrix Introduction: Stop guessing and start trading with institutional precision. The Alpha Gold SMC Dashboard is an advanced, all-in-one manual trading assistant designed to give you an unfair advantage. Built specifically for XAUUSD and major forex pairs, this indicator doesn't just paint arrows on a chart; it provides a comprehensive real-time analysis of market structure, momentum, and institutional zones. KEY FEATURES: S

SMC Indicator BOS & CHoCH analyze market structure using Smart Money Concepts The indicator combines BOS (Break of Structure), CHoCH (Change of Character), Fair Value Gaps (FVG), Liquidity Sweep logic and ATR filtering to provide a structured view of market movements and potential trading opportunities. The indicator automatically identifies swing highs and swing lows and monitors structural breaks in the market. BOS (Break of Structure) identifies potential continuation of the current market st

Candle Timer is a candle countdown indicator for MetaTrader 5. It shows how much time is left on up to three timeframes, together with your broker's trading hours, the Asia, London and New York sessions and today's high-impact news — in one compact panel.
You open a trade, and ten seconds later the H1 candle closes with a long wick through your stop. Candle Timer keeps that moment in sight: the countdown sits in the panel and on the price line, so you always know when the candle rolls over.
TI

RegimeShiftPro marks the moment the market changes character — when a quiet or ranging phase turns directional, and when a trend starts to lose its drive. It is a regime indicator, not a moving-average cross: it watches the statistical behaviour of returns and reports a regime change only when the evidence is strong enough. How it works The indicator runs one to three independent change-point detectors on the standardized returns of the symbol. Each detector accumulates evidence for a shift in

NKZ MarginZone GOLD MT5 NKZ MarginZone GOLD is a professional trading indicator for MetaTrader 5 that automatically plots a cascade of margin zones and target levels based on the Chicago Mercantile Exchange ( CME Group ) methodology. Designed specifically for day traders and swing traders trading Gold ( XAUUSD ), major currency pairs, and stock indices. It replaces hours of manual technical analysis with instant, mathematically precise volatility-adjusted levels, showing exactly where institu

# Garman Klass Volatility - An estimator using the whole OHLC
*Category: Volatility | Difficulty: advanced | Window: separate window below the chart | Markets: Universal (Forex, indices, commodities, crypto, stocks) | Suggested timeframes: M15, M30, H1, H4, D1*
## Short description
> A volatility estimator using open, high, low and close instead of closes only. Its ratio to the classic estimate separates intra-bar movement from close-to-close movement.
### Overview
The standard deviation o

# Overnight Gap Risk - The risk stops cannot cover
*Category: Volatility | Difficulty: intermediate | Window: separate window below the chart | Markets: Stocks | Suggested timeframes: H1, H4, D1*
## Short description
> Splits each bar change into gap and intra-bar movement, and reports the share of risk attributable to gaps, the part no stop can protect against.
### Overview
The risk of a position held past the close is not the same as that of the same position closed intraday, and the dif

# Volatility Breakout Projection - Levels projected from the open
*Category: Volatility | Difficulty: beginner | Window: chart window (overlaid on price) | Markets: Universal (Forex, indices, commodities, crypto, stocks) | Suggested timeframes: M5, M15, M30, H1*
## Short description
> Anchors a reference to each session open and projects two pairs of levels computed as fractions of the average daily range. Levels stay fixed for the whole session.
### Overview
If an instrument covers on ave

# Compression Expansion Detector - Squeeze and release
*Category: Volatility | Difficulty: intermediate | Window: separate window below the chart | Markets: Universal (Forex, indices, commodities, crypto, stocks) | Suggested timeframes: M15, M30, H1, H4, D1*
## Short description
> Measures how far short term volatility has narrowed relative to the reference, counts how many bars the compression has lasted and highlights the bars following the release.
### Overview
Volatility is not stable:

# Intraday Volatility Seasonality - Hourly volatility profile
*Category: Volatility | Difficulty: intermediate | Window: separate window below the chart | Markets: Universal (Forex, indices, commodities, crypto, stocks) | Suggested timeframes: M5, M15, M30, H1*
## Short description
> Builds the instrument average hourly volatility profile and compares it with the actual range of the current bar. It separates normally quiet hours from genuine anomalies.
### Overview
Intraday volatility is n

# Downside Upside Vol Ratio - Risk asymmetry
*Category: Volatility | Difficulty: intermediate | Window: separate window below the chart | Markets: Universal (Forex, indices, commodities, crypto, stocks) | Suggested timeframes: H1, H4, D1*
## Short description
> Computes two separate semi-deviations, one on negative returns only and one on positive ones, and reports their proportion. It measures an asymmetry standard deviation conceals.
### Overview
Standard deviation treats an upward and a

# Volatility Shock Decay - Half-life of post-shock recovery
*Category: Volatility | Difficulty: advanced | Window: separate window below the chart | Markets: Universal (Forex, indices, commodities, crypto, stocks) | Suggested timeframes: H1, H4, D1*
## Short description
> Estimates the persistence coefficient of volatility and derives its half-life, how many bars a deviation from normal needs to halve. It also shows the size of the current shock.
### Overview
When volatility explodes, the

# Volume Price Efficiency - Lo spessore del mercato
*Categoria: Volume | Difficolta: intermedio | Finestra: finestra separata sotto il grafico | Mercati: Universale (Forex, indici, materie prime, crypto, azioni) | Timeframe consigliati: M5, M15, M30, H1, H4*
## Descrizione breve
> Misura quanto prezzo viene spostato da una unita di volume. Valori alti indicano un mercato sottile, in cui pochi ordini muovono molto; valori bassi indicano assorbimento.
### Panoramica
Quanto prezzo serve per a

ZYRON STRUCTURE is an all-in-one MetaTrader 5 market analysis indicator designed to provide a clear view of Fair Value Gaps, market structure, higher-timeframe bias, trading sessions, and multi-timeframe conditions. The indicator combines several analysis tools into one clean chart system, helping traders monitor price structure without loading multiple separate indicators. Main features: Bullish and Bearish Fair Value Gap detection Historical FVG zones Active and mitigated FVG tracking Partial-

# Cumulative Delta Proxy - Delta estimated from OHLC and volume
*Category: Volume | Difficulty: intermediate | Window: separate window below the chart | Markets: Universal (Forex, indices, commodities, crypto, stocks) | Suggested timeframes: M5, M15, M30, H1*
## Short description
> Estimates the buyer/seller imbalance from the close position within the range, weighted by volume, accumulating it per session in equivalent imbalance bars.
### Overview
True delta, the difference between volume

# Volume Climax Detector - The signature of absorption
*Category: Volume | Difficulty: intermediate | Window: chart window (overlaid on price) | Markets: Universal (Forex, indices, commodities, crypto, stocks) | Suggested timeframes: M15, M30, H1, H4, D1*
## Short description
> Recognises climax bars: exceptional volume, wide range but small body, that is price pushing far and coming back. It marks the bars with arrows on the chart.
### Overview
A volume spike alone means nothing: it can a

# Volume Weighted Range Profile - Rolling window profile
*Category: Volume | Difficulty: advanced | Window: chart window (overlaid on price) | Markets: Universal (Forex, indices, commodities, crypto, stocks) | Suggested timeframes: M15, M30, H1, H4, D1*
## Short description
> Builds a volume profile on a rolling window and extracts the point of control and value area. Unlike session profiles, it does not reshape itself during the day.
### Overview
The volume profile identifies the levels w

# Smart Money Flow Index - Opening versus rest of the day
*Category: Volume | Difficulty: intermediate | Window: separate window below the chart | Markets: Indices | Suggested timeframes: M5, M15, M30, H1*
## Short description
> Separates money flow between the first session hours and the rest of the day, showing their divergence. A time based convention, not a measure of who is trading.
### Overview
There is a long standing observation in equity market analysis: the first part of a sessio

# Volume Divergence Tracker - Price to volume correlation
*Category: Volume | Difficulty: intermediate | Window: separate window below the chart | Markets: Universal (Forex, indices, commodities, crypto, stocks) | Suggested timeframes: M15, M30, H1, H4, D1*
## Short description
> Measures the rolling correlation between the size of price moves and the change in volume. It recognises when movement loses the support of participation.
### Overview
In a healthy market price and volume move tog

# Effort Versus Result - Four bar categories
*Category: Volume | Difficulty: intermediate | Window: separate window below the chart | Markets: Universal (Forex, indices, commodities, crypto, stocks) | Suggested timeframes: M15, M30, H1, H4, D1*
## Short description
> Classifies every bar by comparing effort, the volume, with result, the range, both as standard scores. Four categories with distinct operational meaning follow.
### Overview
The effort versus result principle is one of the fou

# Accumulation Phase Scanner - Compressed range, high volume
*Category: Volume | Difficulty: intermediate | Window: separate window below the chart | Markets: Universal (Forex, indices, commodities, crypto, stocks) | Suggested timeframes: M15, M30, H1, H4, D1*
## Short description
> Recognises accumulation phases by combining three conditions: range compressed versus normal, volume above average and no net price progress.
### Overview
Accumulation has a recognisable signature: price stays

# Relative Volume Heatmap - Volume relative to its own hour
*Category: Volume | Difficulty: beginner | Window: separate window below the chart | Markets: Universal (Forex, indices, commodities, crypto, stocks) | Suggested timeframes: M5, M15, M30, H1*
## Short description
> Compares the bar volume with the historical average of the same hour band and colours it on four levels. It spots genuine participation anomalies, not clock effects.
### Overview
Absolute volume is nearly useless on int

# Liquidity Vacuum Finder - The empty corridors of price
*Category: Volume | Difficulty: advanced | Window: chart window (overlaid on price) | Markets: Universal (Forex, indices, commodities, crypto, stocks) | Suggested timeframes: M15, M30, H1, H4, D1*
## Short description
> Identifies price bands crossed on low volume, where nothing will slow price on its return. It draws the nearest vacuum above and below current price.
### Overview
The concept is the exact complement of the volume prof

# Percentile Rank Oscillator - Thresholds that are frequencies
*Category: Oscillators | Difficulty: beginner | Window: separate window below the chart | Markets: Universal (Forex, indices, commodities, crypto, stocks) | Suggested timeframes: M15, M30, H1, H4, D1*
## Short description
> An oscillator based on the percentile rank of price within its own recent distribution. A value of 90 always and everywhere means price is higher than ninety per cent of observations.
## Full description
###

# Adaptive Stochastic Bands - Soglie che si muovono
*Categoria: Oscillatori | Difficolta: intermedio | Finestra: finestra separata sotto il grafico | Mercati: Universale (Forex, indici, materie prime, crypto, azioni) | Timeframe consigliati: M15, M30, H1, H4, D1*
## Descrizione breve
> Oscillatore con bande calcolate sulla propria distribuzione recente invece che con soglie fisse. In un trend forte le bande si alzano e i falsi segnali contrari spariscono.
## Descrizione lunga
### Panoramic

# Mean Reversion Pressure - Deviation that actually pays
*Category: Oscillators | Difficulty: advanced | Window: separate window below the chart | Markets: Universal (Forex, indices, commodities, crypto, stocks) | Suggested timeframes: M30, H1, H4, D1*
## Short description
> Measures price deviation from the mean and weights it by the market actual tendency to revert, estimated on recent data. It signals only when the deviation is exploitable.
## Full description
### Overview
It is not en

# Cycle Phase Oscillator - Cycle position in degrees
*Category: Oscillators | Difficulty: advanced | Window: separate window below the chart | Markets: Universal (Forex, indices, commodities, crypto, stocks) | Suggested timeframes: M30, H1, H4, D1*
## Short description
> Expresses the market position in its own cycle as a phase angle from minus one hundred eighty to plus one hundred eighty degrees, with an amplitude measure indicating how reliable the phase is.
## Full description
### Over

# Dual Range Oscillator - Two ranges compared
*Category: Oscillators | Difficulty: beginner | Window: separate window below the chart | Markets: Universal (Forex, indices, commodities, crypto, stocks) | Suggested timeframes: M15, M30, H1, H4, D1*
## Short description
> Measures the price position within two ranges of very different length and shows their difference. It separates a move just started from one already mature on every scale.
## Full description
### Overview
Price can sit at t
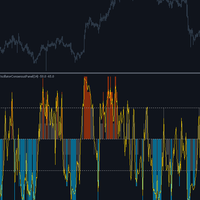
# Oscillator Consensus Panel - Four comparable oscillators
*Category: Oscillators | Difficulty: intermediate | Window: separate window below the chart | Markets: Universal (Forex, indices, commodities, crypto, stocks) | Suggested timeframes: M15, M30, H1, H4, D1*
## Short description
> Computes four oscillators built on different principles and makes them comparable by converting them into percentile ranks, before aggregating them into a consensus measure.
## Full description
### Overview

# Extreme Reading Frequency - How rare is this extreme
*Category: Oscillators | Difficulty: intermediate | Window: separate window below the chart | Markets: Universal (Forex, indices, commodities, crypto, stocks) | Suggested timeframes: M15, M30, H1, H4, D1*
## Short description
> Measures how frequently the oscillator has crossed the thresholds over recent bars. A rare extreme is informative, a frequent one is simply that market norm.
## Full description
### Overview
When an oscillator

# Volatility Scaled RSI - Strength separated from volatility
*Category: Oscillators | Difficulty: intermediate | Window: separate window below the chart | Markets: Universal (Forex, indices, commodities, crypto, stocks) | Suggested timeframes: M15, M30, H1, H4, D1*
## Short description
> A relative strength index where every change is normalised by the volatility of its own moment. It measures pure direction instead of a blend of direction and volatility.
## Full description
### Overview

# Overbought Duration Tracker - How long the extreme has lasted
*Category: Oscillators | Difficulty: intermediate | Window: separate window below the chart | Markets: Universal (Forex, indices, commodities, crypto, stocks) | Suggested timeframes: M15, M30, H1, H4, D1*
## Short description
> Measures how many bars the oscillator has spent in the extreme zone and compares it with the average duration of past stays. It avoids the error of selling on the first overbought touch.
## Full descript

# Reversal Probability Gauge - Historical frequency by analogy
*Category: Oscillators | Difficulty: advanced | Window: separate window below the chart | Markets: Universal (Forex, indices, commodities, crypto, stocks) | Suggested timeframes: M30, H1, H4, D1*
## Short description
> Searches history for bars with a state similar to the current one and counts in what percentage of those cases price then moved the opposite way. It is an observed frequency, not a forecast.
## Full description
#

is a versatile analytical tool designed for both advanced traders and beginners. It combines classic trend line analysis with automatic Fibonacci level plotting to deliver precise market entries and structural clarity. Built as an intuitive and clean on-screen dashboard, this indicator simplifies multi-timeframe analysis without cluttering your main workspace. Technical Analysis and Entry Points The indicator automates the most critical aspects of price action and structural trading: Trend L
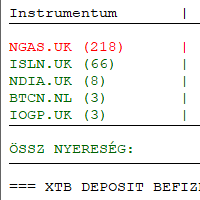
Introducing my indicator in Meta Trader 5. XTB export analysis and charting and export of currency conversion to csv for tax return. This indicator is an independent development and has no official connection with XTB S.A. https://youtu.be/z9JVhqKdKns
Hungary: Meta Trader 5 ben indikátorom bemutatása. XTB export elemzése és chartra kiíratása és adóbevalláshoz deviza konverzió csv.-be exportálása. Ez az indikátor egy független fejlesztés, és semmilyen hivatalos kapcsolatban nem áll az XTB S.A. v

QUANTUM OCEAN SIGNALS MT5
Quantum Ocean Signals MT5 is a multi-filter decision-support indicator for MetaTrader 5. It evaluates trend direction, momentum, directional strength, volatility and candle confirmation to display structured BUY and SELL setups after a candle has closed.
The indicator does not open or manage trades. It gives manual traders a clear trade plan consisting of a signal, an adaptive Stop Loss and three optional Take Profit reference levels.
MAIN FEATURES
• Closed-candle

Level Alert Utility is an essential workflow tool for MetaTrader 5 designed to eliminate constant screen fatigue. Effortlessly drag the interactive level line directly on your chart—the indicator instantly configures trigger rules and delivers real-time notifications via customizable sound repeats, popup alerts, mobile Push notifications, and email. Equipped with high-speed millisecond monitoring, gap and impulse protection, quick-action chart buttons, hotkey support, and state persistence acros

SMC SYNTHRIDERS — Smart Money, Liquidity and Market Phase Trading Indicator SMC SYNTHRIDERS is a MetaTrader 5 market-analysis and signal indicator developed by MohSOLUTIONS . It is designed for traders who analyse price through market structure, liquidity behaviour, Smart Money Concepts, multi-timeframe context and market phases . Rather than generating signals from a single condition, SMC SYNTHRIDERS combines multiple layers of market information to identify conditions where a structured tradin

MACandleApproxPro — 高阶均线蜡烛重构与多维度市场结构指标 产品概述 MACandleApproxPro 是一款专为专业交易者设计的综合性技术分析工具。它突破了传统均线的局限,通过复杂的算法将移动平均线重构为 “MA 蜡烛”形态 。这种独特的可视化方式,让您能够过滤市场噪音,以更直观的视角审视价格趋势、动量变化以及关键的市场结构。 本指标集成了多时间框架(MTF)分析、ADX 趋势强度过滤、流动性扫荡(Liquidity Sweep)检测以及多品种扫描器,为您提供一站式的价格行为分析解决方案。 核心功能亮点 1. 三组独立的 MA 蜡烛系统 指标支持同时运行 3 组独立的均线蜡烛(Candle 1, 2, 3)。 每组均可独立配置周期、均线类型及涨跌颜色。 Candle 1 默认作为基础层,支持多时间框架(MTF)叠加,帮助您在主图表上直接观察更高周期的趋势结构。 2. 六种高级均线算法 支持 SMA, EMA, WMA, VWMA, HMA, RMA 六种算法。 独特的递归计算逻辑(Recursive Calculation)确保了 EMA

# Level Strength Ranker - Only the two levels that matter
*Category: Support and Resistance | Difficulty: intermediate | Window: chart window (overlaid on price) | Markets: Universal (Forex, indices, commodities, crypto, stocks) | Suggested timeframes: M30, H1, H4, D1*
## Short description
> Scores every level by number of touches, size of reactions and recency, drawing only the strongest one above and below price.
## Full description
### Overview
Not all levels are equal. A level touched

# Round Number Magnet - Do round numbers really matter?
*Category: Support and Resistance | Difficulty: beginner | Window: chart window (overlaid on price) | Markets: Universal (Forex, indices, commodities, crypto, stocks) | Suggested timeframes: M15, M30, H1, H4, D1*
## Short description
> Draws round levels with an automatically computed step and measures how much price actually reacts to them on this specific instrument.
## Full description
### Overview
Round numbers attract orders: st

# Break Retest Detector - The full sequence, not just the break
*Category: Support and Resistance | Difficulty: intermediate | Window: chart window (overlaid on price) | Markets: Universal (Forex, indices, commodities, crypto, stocks) | Suggested timeframes: M15, M30, H1, H4, D1*
## Short description
> Recognises the full sequence of break, return to the level and reaction. It signals only when all three conditions occur in the correct order.
## Full description
### Overview
Breaking a le

Multi-Symbol MTF Scanner
形态完成的瞬间,即刻捕捉入场机会 Multi-Symbol MTF Scanner 可在多个时间周期上同时监控您的整个自选品种列表,并在某个市场完成多阶段波段形态的确切时刻向您发出提示。它专为遵循多周期、多品种交易流程的交易者打造,让您无需逐一点开数十张图表,去寻找那唯一一个已经就绪的入场机会。 整个形态均由工具内部原生逐阶段计算,因此无需额外安装任何组件。每一个单元格都会以「X / Y 阶段」的形式显示形态已形成到何种程度,并在最后一个阶段触发的瞬间变为绿色 BUY 或红色 SELL,同时弹出提示、播放声音,并向您的手机推送通知。它仅标示入场点;离场则始终完全由您自己掌控。
兼容 MetaTrader 4 与 MetaTrader 5,在 Market 上作为两个独立产品分别销售。 扫描器将原始价格解析为从快到慢的四个波段深度,然后检验一个完整的形态:波段结构是否对齐、波段数量是否正确、动能的最后一次推进,以及作为触发条件的快速与慢速 EMA 交叉,同时要求价格位于当日开盘价的正确一侧。它原生复现了广为人知的 Xard 波段圆点法(

# Dynamic Pivot Zones - Pivots as zones, not lines
*Category: Support and Resistance | Difficulty: beginner | Window: chart window (overlaid on price) | Markets: Universal (Forex, indices, commodities, crypto, stocks) | Suggested timeframes: M5, M15, M30, H1*
## Short description
> Turns pivots into zones whose width depends on the previous period volatility. The levels stay fixed for the whole session, with no recalculation.
## Full description
### Overview
Classic pivots are infinitely

# Supply Demand Zone Mapper - Compressed base and decisive departure
*Category: Support and Resistance | Difficulty: intermediate | Window: chart window (overlaid on price) | Markets: Universal (Forex, indices, commodities, crypto, stocks) | Suggested timeframes: M15, M30, H1, H4, D1*
## Short description
> Recognises consolidation bases followed by a decisive move and draws them as zones, which remain until price crosses them fully.
## Full description
### Overview
A demand zone forms wh

# Untested Level Finder - The levels still intact
*Category: Support and Resistance | Difficulty: beginner | Window: chart window (overlaid on price) | Markets: Universal (Forex, indices, commodities, crypto, stocks) | Suggested timeframes: M15, M30, H1, H4, D1*
## Short description
> Draws only the swing levels price has never retested since they formed. A level stops being drawn the moment it is tested.
## Full description
### Overview
A level that has already rejected price three times

# Confluence Score Map - Where several references converge
*Category: Support and Resistance | Difficulty: advanced | Window: chart window (overlaid on price) | Markets: Universal (Forex, indices, commodities, crypto, stocks) | Suggested timeframes: M30, H1, H4, D1*
## Short description
> Computes four independent families of levels and draws only the price bands where at least the required minimum number of references converges.
## Full description
### Overview
A level where several inde

# False Breakout Filter - The failed break as a signal
*Category: Support and Resistance | Difficulty: intermediate | Window: chart window (overlaid on price) | Markets: Universal (Forex, indices, commodities, crypto, stocks) | Suggested timeframes: M15, M30, H1, H4, D1*
## Short description
> Watches every break for a fixed number of bars and classifies it only afterwards. A failed break produces an arrow the opposite way, because it is itself a signal.
## Full description
### Overview
E

# Range Boundary Tracker - Edges that do not follow price
*Category: Support and Resistance | Difficulty: intermediate | Window: chart window (overlaid on price) | Markets: Universal (Forex, indices, commodities, crypto, stocks) | Suggested timeframes: M15, M30, H1, H4, D1*
## Short description
> Recognises when the market enters a range, fixes its two extremes and holds them still while the range lasts, as a trader would draw them.
## Full description
### Overview
A channel that follows

# Level Decay Model - A level that wears out
*Category: Support and Resistance | Difficulty: advanced | Window: chart window (overlaid on price) | Markets: Universal (Forex, indices, commodities, crypto, stocks) | Suggested timeframes: M30, H1, H4, D1*
## Short description
> Assigns each level a strength that decays over time and with every test it undergoes. The level is abandoned once residual strength falls below the threshold.
## Full description
### Overview
A level does not have unl

适用于MT5平台的“吊颈线和倒锤线形态”加密货币外汇指标,无重绘,无延迟。 - “吊颈线和倒锤线形态”指标是一款功能强大的价格行为交易指标。 - 该指标可检测图表上的看涨倒锤线形态和看跌吊颈线形态: - 看涨倒锤线形态:图表上显示蓝色箭头信号(见图)。 - 看跌吊颈线形态:图表上显示红色箭头信号(见图)。 - 支持电脑端和移动端通知。 - 提供4种不同的信号箭头样式。 - “吊颈线和倒锤线形态”指标非常适合与支撑/阻力位和挂单结合使用。 点击此处查看更多优质交易机器人和指标! 本产品为原创产品,仅在MQL5网站独家销售。 ......................................................

Makito AD is a volume-based market analysis indicator designed to identify market trends and changes in market direction by analyzing the relationship between price action and volume . The indicator uses a dynamic line that changes color based on the current market condition , making it easier to visually identify whether market pressure is becoming bullish, bearish, or showing potential divergence. Key Features Volume-Based Analysis — Uses volume and price action to assess market direction. Dyn

Probability Cone MT5 — Statistical Price Projection Indicator Probability Cone MT5 is a technical analysis tool that projects statistically grounded price ranges forward on the chart. Using a log-normal volatility model — the same mathematical approach behind option pricing and quantitative risk tools — the indicator calculates where price is statistically likely to travel over a chosen time horizon. Statistical Price Projection Instead of eyeballing support, resistance, or a breakout target, Pr

Footprint Visual Order flow footprint chart, drawn directly in the main window, sharing the real price scale of your candles. Short description (for the Market listing) Footprint Visual draws a real bid/ask footprint — buy and sell volume per price level, POC, Value Area and net delta — for each of the most recent bars, right next to your candles. Built on genuine volume_real tick data (not tick-count approximations), it works on any symbol whose broker feed reports real trade volume, and is tun

标记自定义交易时段的高低点区间,并在插针突破该区间时,通过内置的自适应 Supertrend 过滤后发出买卖信号,可选高周期趋势确认和 ADX 过滤,并自动绘制止盈止损参考线。
主要功能 时段区间框 — 自动跟踪并绘制任意自定义时段(例如您自己的 SAST 交易时段、亚洲时段或伦敦开盘)的高低点,实时更新,时段结束后锁定。 内置 Supertrend 趋势过滤器 — 独立运行的 Supertrend 引擎,具备: 自适应系数选项,根据 ATR 在回看周期内的百分位排名动态调整倍数,随波动率自动收紧或放宽; 可选的高周期(HTF)趋势确认——只有当高周期 Supertrend 方向与当前周期一致时,信号才被计入; 可选的 ADX 过滤器,避免在弱趋势/震荡行情中产生信号。 突破信号 — 每个时段/每天最多一个买入箭头和一个卖出箭头,当K线插针突破区间高点或低点,且 Supertrend 过滤器确认时触发。 止盈/止损参考线 — 信号触发时自动绘制入场、止损、止盈射线,其距离按当日时段区间的百分比计算,并在 SAST 午夜自动截止。 完全可配置 — 时段时间、时区偏移、Supertre

Stop Watching Key Price Levels. Get Alerted. Horizontal Line Alert automatically monitors a price level and alerts you when price closes above, closes below, or touches the line . Go beyond a basic horizontal-line alert with candle confirmation, candle-size filtering, and price-action conditions . KEY FEATURES Close Above
Detect qualifying bullish candles closing above your horizontal level. Close Below
Detect qualifying bearish candles closing below your level. Close Above / Bel
MetaTrader市场是一个简单方便的网站,在这里开发者可以出售自己的交易应用程序。
我们将帮助您发布您的产品,并向您解释如何为市场准备您的产品描述。市场上所有的应用程序都是加密保护并且只能在买家的电脑上运行。非法拷贝是不可能的。
