 MetaTrader 5
 专家
专家
 指标
指标
 程序库
程序库
 实用工具
实用工具
 窗口小部件
窗口小部件
 规则
规则
适用于MetaTrader 5的技术指标 - 199
 技术指标的信号外汇和股票市场的开仓交易和平仓交易起着至关重要的作用。指标的本质就是一种交易品种的数学转换,旨在预测未来的价格变化。
测试技术指标可以更有利于预测市场行为并从中获利。
技术指标的信号外汇和股票市场的开仓交易和平仓交易起着至关重要的作用。指标的本质就是一种交易品种的数学转换,旨在预测未来的价格变化。
测试技术指标可以更有利于预测市场行为并从中获利。 
Market Direction Pro is a professional indicator for MetaTrader 5 that transforms complex market behavior into clear, confirmed direction.The indicator does not redraw signal arrows. Built around a proprietary multi-stage analytical process, it helps traders filter intrabar noise and focus on signals that remain stable after confirmation. Bullish and bearish arrows appear directly on the main price chart, while the dedicated visual interface presents direction, turning points and signal context

CRT & CCT Scanner Dashboard (MT5) The CRT & CCT Scanner Dashboard is a professional, multi-functional MetaTrader 5 indicator designed to automate and optimize multi-asset technical analysis. It scans your entire Market Watch window in real-time to instantly detect price setups based on CRT and CCT methodologies. Key Features: Automated Market Watch Scanning: No more manual chart flipping. The dashboard processes up to 50 symbols simultaneously. Standard & Custom Timeframes: Supports standard tim

# Noise Gate Trend System
**Noise Gate Trend System** does exactly what its name says: it gates out market noise and only lets the real swings through. Around that gate it builds a complete, self-contained trading workstation — it tells you three things at a glance: *what the trend is* , *when to enter* , and *where your stop and targets are* — without a single extra indicator on the chart.
The gate itself is a **twin adaptive volatility range filter** . Price has to travel further than the m

Description: Stay ahead of the market with a clean, professional, and highly optimized Economic News Indicator directly on your MT5 chart. Designed specifically for traders who need real-time news visibility without the chart clutter. Key Features: Customizable Currency Selection: Easy dropdown menu to select up to two currencies (USD, EUR, GBP, JPY, AUD, NZD, CAD, CHF, CNY) to match your trading pairs perfectly. Impact Filters: Display only what matters to you by toggling High, Medium, or Low i

# Premium Signal Toolkit — All-in-One Trend, Signal and Reversal System
**Ten proven analysis engines on one chart, condensed into one arrow and one line you can actually trade.**
Most "all-in-one" indicators fail for the same reason: they draw everything at once and leave you staring at a wall of colour. Premium Signal Toolkit runs ten independent engines in the background, but shows you only what you asked for — and reports the state of everything else in a compact panel in the corner of yo

Overview Overnight Range Box is a visual session indicator for MetaTrader 5. It marks the high and low of a configurable overnight or intraday trading session directly on the chart. The indicator can display completed historical sessions as well as the currently developing range. Session times, colors, labels and extensions can be adjusted to suit different markets, brokers and trading routines. The product is intended for traders who use session structure, overnight highs and lows, range breako

趨勢預言 (Trend Oracle) & ZeroMax 系統:革命性的脈衝行情預測演算法
您是否夢想在價格強勁爆發前搶先一步,而不是追逐即將離去的列車?
隆重推出趨勢預言 (Trend Oracle),這是一款高度精準的動量預測指標,整合於專業的 ZeroMax 交易系統中。這款新一代工具專為交易高波動性金融工具(尤其是黃金 (XAUUSD))時需要絕對清晰的交易者而設計。
趨勢預言 (Trend Oracle) 的秘密是什麼?
趨勢預言 (Trend Oracle) 的主要獨特之處在於它能夠辨識隱藏的累積盤整階段。當演算法將市場數據壓縮到單一的收斂點時,它預示著即將發生巨大的能量爆發。
您將在脈衝形態的零點收到入場訊號-最小的停損和最大的獲利潛力!
ZeroMax 三重奏:三大指標的協同作用
ZeroMax 不僅僅是一個獨立的訊號;它是一個完整、自給自足的生態系統。三個指標完美協同運作,徹底消除人為誤差和市場噪音。即使完全關閉K線圖,您也能精準預測價格的走勢!
趨勢預言者(主入場觸發指標):
作用:動量出現前的入場點。
機制:記錄波動

Quantum Delta VWAP — Профессиональный Анализ Объемов и Order Flow Quantum Delta VWAP — это мощный индикатор нового поколения для MetaTrader 5, разработанный для интрадей-скальпинга и систем Smart Money (SMC/ICT). Благодаря скоростному движку Canvas с двойным шлюзом кэширования, он выводит объемы на экран в реальном времени без задержек, лагов и мерцания . Индикатор идеально подходит для торговли золотом (XAUUSD), валютами, индексами и криптой, позволяя наглядно видеть действия крупных игроко

Omega Matrix Pro Advanced Multi-Indicator Confirmation System for MetaTrader 5 Omega Matrix Pro is a professional MT5 indicator designed to help traders identify high-probability BUY and SELL opportunities by combining confirmations from multiple technical indicators into a single intelligent decision. Instead of relying on one indicator, Omega Matrix Pro analyzes market conditions using a complete confirmation matrix, providing a clear visual dashboard, entry arrows, confidence score, and insta

三单同时开,三单同时亏。这通常不是运气差。
如果你开的几个品种平时就是一起涨、一起跌,那它们本来就会一起亏。看上去是分散了风险,实际上是同一笔交易下了三次。
分散的意义在于:一个亏的时候,另一个有机会赚。品种如果同向,这个机会根本不存在。
这个面板做一件事:把你现在开着的单子,算成几笔真正不同的交易。
EFFECTIVE POSITIONS 1.2 of 3
开了 3 单,实际只相当于 1.2 单。另外那 1.8 单没有分散任何东西,只是把仓位加大了。
什么时候用
下单前:想再加一单,先看该挑哪个品种,才算真的多了一笔交易。 持仓中:看看手上这几单是不是同一个风险,要不要减一减。 复盘时:这次为什么亏得比预想的多,答案常常在这里。
一个完整的例子
假设你买了 GBPUSD,现在想再开一单。
面板的 RISK BLOCKS 区把品种分了组:
B1 USDCHF same USDCAD opposite GBPUSD XAUUSD EURUSD AUDUSD NZDUSD independent USD

WHALETRADES PRO - Complete Strategy Guide
Understanding Your Trading Arsenal
WhalesTrade Pro is your window into the institutional side of the market. It combines three powerful trading systems into one comprehensive tool that reveals what's really happening beneath price action.
The numbers changing on your chart are not random. Each one tells a specific story about market participants, their conviction, their fear, and their greed. Learning to read these numbers transforms you from a gambl

Kito AutoTrendline Pro is an automatic trendline intelligence indicator for MetaTrader 5. Instead of drawing every possible line, it evaluates confirmed swing anchors, validates each candidate against price action, measures independent touches and reactions, suppresses duplicate structures and ranks the remaining trendlines with a 0–100 strength score. Only the strongest support and resistance structures are displayed, helping traders read market geometry without manually drawing and constantly

Advanced Market Sessions is a professional, all-in-one market session tracker designed for serious day traders and swing traders. It accurately tracks the Sydney, Tokyo, London, and New York sessions with bulletproof precision — ensuring your session times are always mathematically correct, even if your PC clock is wrong, out of sync, or you travel between timezones.
WHY TRADERS CHOOSE THIS INDICATOR:
BULLETPROOF TIME ACCURACY Sessions always open and close at the exact correct real-world

Fractal Pattern Reader is an advanced multi-timeframe indicator that detects fractal alignments, divergences, and confluence zones across 5 timeframes simultaneously. It automatically calculates Entry, SL, and TP levels to spot high-probability setups.
Key Features Multi-Timeframe Tracking: Simultaneously analyzes 5 distinct timeframes: Higher Timeframe 1 (Main Bias), Higher Timeframe 2 (Trend Confirmation), MTF (Supply/Demand Zone), and two Lower Timeframes (Trigger and Execution) . Smart Patt

Step RSI Stochastic Signal Scanner Step RSI Stochastic Signal Scanner is an analytical indicator for MetaTrader 5 designed specifically for the analysis of Step Index and Step 200 Index . The indicator monitors Relative Strength Index (RSI) and Stochastic Oscillator conditions across multiple timeframes from a single panel. Its signal methodology evaluates oscillator levels, recent level crossings, and the relationship between RSI and Stochastic. According to the configured rules, each timeframe

QUANTUM SPIKE B&C QUANTUM SPIKE B&C is an advanced MQL5 trading system designed for MetaTrader 5. It combines volatility-based signal logic with an Auto-Adaptive Scaling Engine , a Multi-Timeframe EMA Strength Matrix , a Dynamic Risk-to-Reward (RRR) Box Tool , and an On-Chart Trend Filter . It is optimized for both currency pairs and Synthetic Volatility Indices (including Boom & Crash ). Key Features (In Short) Auto-Adaptive Pair Scaling Engine Automatically calculates candle volati

GOLD , XAUUSD Trading Signal
Position Management & Trading Rules Position Management
Important ( You must be Follow this) use only 15m Time frame Chart Gold Small Position Take Profit (TP): 2400 Points Stop Loss (SL): 1450 Points Big Position Take Profit (TP): 4000 Points Stop Loss (SL): 1650 Points Entry Rules When the main indicator generates a Buy signal, enter the trade at the closing price of the same candle that produced the signal. The same rule applies to Sell signals. Enter the Se

True Trendline for MT5 — A complete, from‑scratch reconstruction of the legendary MT4 trendline logic, optimized exclusively for MetaTrader 5 — Overview “TrueTL” was one of the most trusted and widely used trendline indicators in the MT4 era. Inspired by its philosophy, True Trendline for MT5 has been fully redesigned from the ground up to fit the architecture and performance model of MetaTrader 5. This is not a simple port. It is a pixel‑perfect reproduction combined with an ultra‑fast MT5‑op

CapitalSol Market Brief Pro
概述
CapitalSol Market Brief Pro 是一款用于 MetaTrader 5 的市场分析指标。它将趋势、动量、交易时段、价格位置、流动性、日内波动范围和点差信息集中在一个紧凑的仪表盘中。
该指标用于结构化市场分析,不会开仓、平仓或管理交易。
仪表盘信息
仪表盘显示: - Market Bias - Trading Session - Premium / Discount Zone - Liquidity Location - Daily Range Status - Spread Status
底部还显示当前交易品种、图表周期以及 MetaTrader Trade Server Time。
MARKET BIAS
Market Bias 结合 Fast EMA、Slow EMA 和 RSI。
BULLISH: Fast EMA 高于 Slow EMA,并且 RSI 高于 55。
BEARISH: Fast EMA 低于 Slow EMA,并且 RSI 低于 45。
NEUTRAL: 其

Auto Trade Journal with Screenshots
在准确的那一刻自动截图,记录每一笔交易 交易日志是每位导师都会推荐、却几乎没人能坚持的习惯,因为手动记录费时又容易被跳过。文字日记可以记下数字,却永远无法呈现你入场或出场那一刻图表的真实模样,而经验教训恰恰就藏在那里。 Auto Trade Journal with Screenshots 会自动为整个账户完成这项工作。每当交易开仓、平仓、部分平仓,或止损、止盈被修改时,它都会在那一刻为图表截图,并将完整细节和图片路径写入一行CSV记录。无论是手动交易还是任何智能交易系统的交易,都能一并记录。
兼容 MetaTrader 4 和 MetaTrader 5,在市场中作为独立产品分别销售,请选择与你的终端匹配的版本。适用于任何品种和任何时间周期。 为了在任意品种上截取到合适的图表,它会重复使用你已打开的图表,或临时打开一个新图表,完成截图后再关闭,绝不会影响你自己的图表。它还可以同时在多个时间周期上捕捉同一时刻的画面。CSV文件可直接在Excel、Google表格或任何日志工具中打开,分隔符可自由选择。它绝不会开仓或

Professional Volume Profile, POC, Value Area, HVN/LVN & Naked POC Analysis Auction Matrix Pro is an advanced market profile and auction market theory indicator designed for traders who want a deeper understanding of price acceptance, price rejection, volume concentration, and market structure. The indicator automatically builds a dynamic Daily Volume Profile and provides real-time visualization of: Point of Control (POC) Value Area High (VAH) Value Area Low (VAL) Developing POC High Volume Node

KS H4 Synthetic Candle Pro 是一款 MetaTrader 5 指标,它利用成对的、已完全收盘的 H2(2小时)K线,构建出独立于经纪商设置的合成 4小时 K线。
核心理念
该指标不依赖经纪商原生的 H4 时间周期(该周期可能因服务器的小时偏移设置而异),而是采取以下方式:
在 H2 图表上运行。
完全忽略当前正在形成的 H2 K线(即 Shift 0)。
选取最近收盘的两根 H2 K线,将其合并为一根合成 4小时 K线:
开盘价 (Open) = 较早那根 H2 K线的开盘价
收盘价 (Close) = 较晚那根 H2 K线的收盘价
最高价 (High) = 两根 K线最高价中的最大值
最低价 (Low) = 两根 K线最低价中的最小值
对更早期的 K线对重复上述过程,以绘制多根合成 K线。
仅在新的 H2 K线收盘时更新,因此合成 K线绝不会处于“实时变动”或“部分形成”的状态。
由于配对完全基于 K线数量(而非服务器时钟),无论经纪商的 H4 对齐方式如何,生成的 K线形态都保持一致。
视觉呈现
合成 K线通过图表对象绘制:

AKILLI ALTIN GİRİŞ YARDIMCISI v7.0 Teknik ve eğitim göstergesi 1 AKILLI ALTIN GİRİŞ YARDIMCISI v7.0 MT5 Altın Analizi ve İşlem Giriş göstergesi AKILLI ALTIN GİRİŞ YARDIMCISI v7.0, MetaTrader 5 kullanıcılarının XAUUSD (ALTIN) piyasadaki ve potansiyel işlem yüklemelerini bir şekilde değerlendirmelerine yardımcı olmak için belirlenen analiz zaman aralığı analiz göstergesidir. Gösterge, yalnızca AL veya SAT göstermek yerine, ana trend, piyasada mevcut, önemli fiyat bölgelerini, mome

VP Quant Algo Indicator - Professional Trading Guide
What This Indicator Does For You
This is not just another indicator - it's a complete trading cockpit that combines institutional volume analysis, order flow intelligence, and quantitative signal confluence into one powerful tool. Let me break down exactly what each piece does and how you can use it to trade with an edge.
---
The Five Core Systems
Smart Money Volume Index - The Lower Window
What it shows:
· Buy Interest (aqua line) - S

WHAT IS PRIME ZONES? Prime Zones is a professional market structure indicator designed to automatically identify key Support and Resistance Zones , monitor how price interacts with them, and provide additional trend context through a Dual Regression Channel system . Instead of filling the chart with dozens of horizontal lines, Prime Zones displays clean and visually defined price areas where the market has previously shown meaningful reactions. The indicator combines four main concepts in a sing

Substantial Arrows — 看清方向,识别动能,专注信号 Substantial Arrows 是一款面向 MetaTrader 5 的专业交易指标,适合希望以更清晰、更结构化的方式观察市场方向和潜在交易机会的交易者。 它并不仅仅显示单独的箭头,而是将 多周期市场趋势、Trend Candles 和自适应箭头信号 集成在同一个图表环境中。 多周期 Market Trend Market Trend 面板可以同时监控: MN1 • W1 • D1 • H4 • H1 • M30 • M15 • M5 • M1 趋势状态以简单直观的方式显示: BUY • SELL • NEUTRAL 这让交易者无需频繁切换图表,也能快速比较不同周期的市场方向。 Trend Candles Trend Candles 使用视觉方式区分多头和空头市场状态。 该功能可以独立开启或关闭。关闭 Trend Candles 只会隐藏其视觉效果,不会关闭其他指标功能。 Main Arrows Main Arrows 是 Substantial Arrows 的核心信号系统。 当指标条件得到确认后,BUY

GoldScalp Signal Pro GoldScalp Signal Pro is a technical trading indicator designed primarily for XAUUSD (Gold). It combines EMA trend analysis, RSI momentum confirmation, and ADX trend-strength filtering to help traders identify potential BUY and SELL opportunities. Key Features - BUY and SELL signals displayed directly on the chart - EMA 10 / EMA 20 trend filter - RSI momentum confirmation - ADX trend-strength filter - Fully customizable indicator parameters - Designed primarily for XAUUSD - S

“KS Master Tool 12 in 1 Trade with Me”是一款单文件 MetaTrader 5 (MT5) 自定义指标,它将多种交易工具整合为单一的图表窗口叠加层。
该工具的设计允许通过主开关完全启用或禁用各个模块。当某个模块处于关闭状态时,系统会彻底跳过该模块的计算、绘图、计时器运行及图表事件处理(即禁用的模块不会产生额外的 CPU 占用)。 模块功能
SMC / 斐波那契 / 结构突破 (Structure Break) / FVG / CPR / IB (结合 SMC 的图表形态)
公平价值缺口 (FVG):支持可选标签、缓解 (mitigation) 缩减显示及历史记录限制
结构突破 (BOS / CHoCH):包含历史记录、当前结构高亮显示、实体或影线突破选项
斐波那契水平:5 个可配置水平(支持显示/隐藏)
中心枢轴区间 (CPR):包含 Pivot、BC、TC 及区间填充 (cloud fill)
前一日高点/低点 (PDH/PDL)
初始平衡区间 (IB):高点/低点/中点 + 区间填充(可配置时段窗口)
可选图表形态识别 (Ell

LiquidityLabs FVG Pro is a multi-timeframe Fair Value Gap and liquidity-based trade setup indicator for MetaTrader 5, designed to identify higher-quality directional opportunities and display a complete trade plan directly on the chart. The indicator analyzes market structure, liquidity behavior, Fair Value Gaps and lower-timeframe confirmation to locate potential entries while maintaining the larger market context. Once a valid setup is confirmed, the indicator displays the entry level together

适用于MT5平台的“回测柱状图”加密货币外汇指标,无重绘。 - “回测柱状图”指标可用于在强支撑/阻力位回测后寻找进入主要趋势方向的入场信号。 - “回测柱状图”有两种颜色:红色代表下跌趋势,绿色代表上涨趋势。 - 当您看到连续稳定的同色柱状图时,意味着新的趋势正在形成。 - 回测信号表现为柱状图中第一列颜色与当前趋势相反,第二列颜色与当前趋势一致(参见图片)。 - 该指标内置移动端和PC端提醒功能。 指标使用方法: - 买入信号:持续稳定的绿色柱状图(上涨趋势)+ 一列红色柱状图(回测)+ 一列绿色柱状图(在此处开立多头头寸)。 - 卖出信号:持续稳定的红色柱状图(下跌趋势),柱状图上出现一根绿色柱(回测),再出现一根红色柱(在此处开立空头头寸)。 Click here to see high quality Trading Robots and Indicators! 这是仅在 MQL5 网站上提供的原创产品。

Angle Iindicator MT5 - 种用于识别方向变化和确认趋势的指标。
它分析价格行为并识别反转点,识别图表上的峰值和谷值。
它支持趋势方向判断。
适用于任何金融工具和时间周期。
内部参数已配置完毕;您只需将指标放置在图表上,并设置“乘数”参数以获得所需结果即可。
该指标会在当前K线图上生成箭头。有时,箭头在K线形成过程中可能会闪烁。K线收盘后,箭头不会在之前的历史K线上重绘。
该指标会在方向变化时发出警报。
可以单独使用,也可以与您的交易系统结合使用。
要正确使用该指标,您必须配置“乘数”参数。
指标的结果取决于反转角度在图表上的生成方式。
“乘数”参数用于构建连续的K线图,从而确定反转点的频率。 0.1 到 100 的取值范围允许您针对任何选定的交易品种或时间周期自定义生成参数。
增加该数值会生成更早的反转信号,这更适合较高的时间周期(M30-H1)或在 M1-M5-M15 周期寻找入场点。
减小该数值会平滑反转和方向信号,使该指标更适合识别趋势。
绿色箭头表示向下方向,蓝色箭头表示向上方向。

Separated tick volume moving averages:
This tool makes it is easier to track the volume behind the moves. It will separate tick volume into bullish and bearish volumes with two separate moving averages. Tracking volume versus price in an easy way is now accessable to any trader. It will put you on track with the market makers and those who move the price. Volume is not the only thing which moves the price but its an important factor behind it. Hence it has a predictive power.
How tick volume w

Sniper Channels Base 是一款专为 MetaTrader 5 设计的高精度自适应趋势跟踪指标。它能动态计算通道和平滑均线,精准捕捉趋势反转,并在图表上直接生成高概率的买入/卖出信号箭头。 无论您从事剥头皮、日内交易还是波段交易, Sniper Channels Base 都能有效过滤市场噪音,提供清晰无延迟的直观方向指引。 主要特点: 自适应趋势检测: 变色均线清晰区分看涨(浅蓝)与看跌(红色)动能。 精准买卖箭头: 当趋势颜色发生转变时自动标注信号箭头,并根据 ATR 动态调整与蜡烛图的距离。 可选上下通道线: 可根据个人交易习惯轻松开启或关闭上下通道边界。 全方位提醒功能: 支持弹窗提醒、声音提示、邮件通知及手机 Push 推送,绝不错过任何交易机会。 多种价格类型: 支持收盘价、开盘价、最高价、最低价、中位价、典型价及加权价等多种计算方式。 高效代码优化: 轻量化算法设计,多图表及多周期运行流畅不卡顿。 输入参数: 通道设置 (Channel Settings): Channel Length (默认:50)- 用于动态通道计算的周期数。 Applied Pri

GTI Buy/Sell v2 PRO Two SuperTrends. Six filters. Three signal grades. One clean chart. Most arrow indicators show you a signal and leave you guessing how much it is worth. GTI Buy/Sell v2 PRO scores every single signal from 0 to 5, sorts it into three quality grades, and then draws the complete trade plan — entry, stop loss and up to three targets — directly on your chart. You stop asking "should I take this one?" and start reading how much confirmation is actually behind it. THE SIGNAL ENGINE

IQAlgo Pro MT5 Indicator - Comprehensive Overview
Introduction
IQAlgo Pro is a revolutionary all-in-one trading indicator that consolidates seven powerful analytical systems into a single, cohesive tool. Designed for serious traders who demand institutional-grade analysis, this indicator transforms your MetaTrader 5 chart into a complete trading command center. Rather than juggling multiple indicators and trying to reconcile conflicting signals, IQAlgo Pro presents a unified view of market st

Wave X Pro AI Agents Indicator Wave X Pro is a signal-analysis indicator developed for MetaTrader 5 and designed for short-duration binary trading workflows. It operates on the M1 chart and presents directional signals with a five-minute evaluation period. The indicator combines several specialized analytical modules in one coordinated workflow. Each module examines a different aspect of price behavior before the system presents its final signal. Wave X Pro is an analytical tool. It does not exe

拒绝盲目交易。终极共振系统现已登场。 您是否厌倦了那些在历史图表上看起来很完美,却在实盘中毁掉您账户的重绘指标?是的,我也曾经历过。市场——尤其是像 XAUUSD 这样凶猛的野兽——根本不在乎您的感受。它只尊崇冷酷、硬核的数据。 这正是 SmartConfluenceDashboardPro 诞生的原因。这不仅仅是另一个华而不实的散户工具;它是一个专为 MetaTrader 5 打造的完整、多合一的机构级交易生态系统。我设计它的初衷,是将所有关键的市场数据直接呈现在您眼前,从而彻底消除情绪化交易。是时候停止猜测,开始从市场中提取资本了。 为什么这是您唯一需要的指标 大多数交易者失败,是因为他们缺乏共振。他们根据 15 分钟的信号进行交易,而 4 小时图表的趋势却与他们完全背道而驰。SmartConfluenceDashboardPro 通过将顶级的技术分析融合到一个无缝界面中,迫使您与“聪明钱”并肩作战。 以下是这头野兽为您图表带来的确切优势: 坚不可摧的趋势引擎: 由自适应 ATR 驱动的动态 SuperTrend(超级趋势)引擎,精准计算真实的行情方向。我们将其与严格的“趋势着色

亚洲区间人人都画。Session Liquidity Sweep Stats 告诉你它通常 会怎样 。 每个交易时段的高低点在时段结束后即被追踪,每一次触碰都会在你自行固定的判定周期上得出三种答案之一:该水平被 扫荡(swept) 且价格反转、被 突破(broken) 且价格继续、或仅被触碰而当日未决。 功能 亚洲时段收盘后,其高低点绘制在图表上。伦敦时段收盘后,伦敦高低点加入。此后逐根K线监控每个水平,价格触碰的那一刻问题开启:守住还是走掉? 从触碰K线取两个参照并让它们竞速。收盘价越过该K线的 影线尖端 即为 突破 ——走势延续。收盘价回到触碰前最后一根反向K线的 开盘价 之外即为 扫荡 ——流动性被取走且价格反转。先发生者胜出。若某根K线刺穿水平并直接收于其外,则立即判定为突破。 同样的规则应用于历史数据,因此面板可显示该水平以往的表现。两个独立样本窗口并排显示——近期与更长的基准——让你看出当前市场状态是否偏离常态。 选择理由 数字与名称相符。 这里的扫荡是被收回的影线,而不只是被触及的水平 判定周期固定。 突破与扫荡都是基于收盘的判定,答案取决于所用周期。本工具在你设定的周期

十五个品种、三个周期、一张网格。绿色表示该品种刚刚形成 CRT 多头形态,红色表示空头。点击单元格即可切换到该品种、该周期的图表。 信号为什么会出现 条件很严格,只用两根K线。第一根定义一个区间。第二根取走该区间的一侧——做多取低点,做空取高点——然后 收盘回到区间内部 。那一侧的流动性已被取走,而价格拒绝停留在那里。区间的另一端仍未被消耗,那正是该形态所指向的位置。 规则仅此而已。没有均线,没有振荡指标,没有拟合。正因为规则如此狭窄,你可以打开任何一个亮起的单元格,用自己的眼睛判断它是否成立。 你会得到什么 每隔几秒重新检查每个品种/周期组合的最近两根已收盘K线并更新网格:绿色 BUY、红色 SELL,或安静的横线。每个新信号仅触发一次提醒(弹窗、声音、推送、邮件,可分别开关)。重新加载、重启或切换图表都不会重播旧提醒。 亮起的单元格会在形态失效的瞬间熄灭。若形成中的K线在你行动前突破了扫荡极值,单元格立即恢复为横线,而不是保留过期信号直到收盘。 选择理由 不重绘 — 信号仅基于已收盘K线。实时网格只会提前 熄灭 ,绝不会提前点亮 自动解析经纪商品种名 — EURUSD 可找到 EU

FAVERO RETURN SYSTEM Reversal Probability System The system was developed to identify market regions where price shows signs of potential exhaustion , combining overbought and oversold conditions with support and resistance levels from higher timeframes . The objective is not to claim that a reversal will necessarily occur, but rather to identify areas where the probability of a change in market direction may be increasing . How It Works The indicator primarily analyzes the following timefra

LiquidityLabs FVG Pro Intraday LiquidityLabs FVG Pro Intraday is a professional Fair Value Gap and liquidity-analysis indicator designed for shorter-duration intraday opportunities. The indicator continuously analyzes market structure, liquidity behavior, directional conditions and Fair Value Gap activity to identify potential intraday setups and display a complete trade plan directly on the MetaTrader 5 chart. Rather than simply marking every Fair Value Gap, LiquidityLabs FVG Pro Intraday filte

Gold Power G.P — Read Gold Price Action with Clarity Gold Power G.P is a specialized indicator designed exclusively for XAU (Gold) , providing a clear and dynamic visual representation of market movement and helping you understand changes in momentum and price behavior without overwhelming your chart with unnecessary complexity. The indicator displays market movement in a dedicated window with an intuitive visual presentation, allowing you to choose the display style that best suits your analys

这个量价结构指标是一款适用于 MetaTrader 4 和 MetaTrader 5 的图表分析指标,集量价结构、成交量分布、市场情绪、波动提示和关键价格区域展示于一体。指标直接运行在主图窗口,可帮助交易者快速观察市场的重要价格位置与活跃程度。 主要功能 1. 量价结构支撑与阻力 自动标记连续量价结构形成的潜在支撑位和阻力位,辅助识别价格可能出现停顿、反应或突破的位置。 支持两种分析模式: 成交量结构 价格结构 线条颜色、宽度和样式均可自定义。 2. 成交量尖峰提示 当市场成交量显著放大时,在图表中显示醒目标记,帮助发现异常活跃、加速、衰竭或可能发生方向变化的行情。 可选功能包括: 尖峰图标提示 尖峰价格水平线 高点、低点、收盘价或组合价位显示 自定义成交量阈值 3. 高波动行情提示 自动标记波动明显扩张的 K 线,方便交易者及时发现突破、加速和快速行情。 支持: 高波动图标 关键价格水平线 自定义检测周期与敏感度 自定义线条颜色、宽度和样式 4. 成交量分布 在图表右侧显示指定范围内的成交量分布,直观呈现不同价格区域的交易活跃程度。 主要显示内容包括: 高成交量节点 低成交量

Sniper Channels MTF 是一款专为 MetaTrader 5 设计的高级多周期趋势通道指标。它能实时计算大周期(HTF)的动态支撑/阻力通道与趋势切线,并无延迟、不重绘地投影到您当前的时间帧图表上。 无论您是从事外汇、股指、大宗商品还是加密货币的剥头皮、日内交易还是波段交易, Sniper Channels MTF 都能帮助您快速识别大周期趋势方向及高概率反转区域。 核心特点 多周期引擎: 无需切换窗口,直接在 M5、M15 或 M30 图表上无缝显示 H1、H4 或日线通道。 变色趋势中轨: 趋势斜率确认后立即变色(浅绿 = 看涨 / 洋红 = 看跌)。 视觉入场信号菱形: 实时在图表上标记大周期趋势的转变点。 图表 BUY / SELL 文字标签: 信号点旁提供清晰直观的买卖文字提示。 基于 ATR 的动态间距: 信号图标根据市场波动率自动调整与 K 线的距离。 全方位提醒套件: 支持 MT5 弹窗提醒、声音警报、电子邮件及手机 Push 推送。 无重绘与高度优化: 已关闭的 K 线保证 100% 不重绘,CPU 资源占用极低。 输入参数说明 === MTF Cha

Support Resistance 90 Support Resistance 90 draws clean pivot-based support and resistance bands and adds a trend layer on top: once price breaks a level, only the side that matters stays on the chart. Break above resistance and the support band leads the move; break below support and the resistance band takes over. The result is a chart that shows one clear side at a time instead of a screen full of crossing lines. A built-in dashboard tracks how the signals would have performed — last result,

Sniper Channels Base with MTF 是一款专为 MetaTrader 5 设计的高级多合一趋势通道指标。它结合了当前时间帧通道动态与大周期(HTF)趋势过滤及多周期信号生成功能,完全无延迟、不重绘地直接投影到您的图表上。 专为外汇、股指、大宗商品和加密货币打造, Sniper Channels Base with MTF 允许交易者将小周期的入场信号与大周期的市场方向相结合,以获得更高的胜率和更小的回撤。 核心特点 双通道引擎: 在单个图表上同时计算并绘制当前周期通道和大周期(HTF)通道。 MTF 趋势过滤: 自动过滤掉与大周期趋势冲突的低概率当前周期信号。 动态变色趋势线: 中轨在趋势确认后立即变色(青色/浅绿 = 看涨,红色/洋红 = 看跌)。 图表信号箭头与 MTF 菱形: 清楚标注当前周期的入场箭头以及 MTF 趋势转变的高影响力菱形标记。 图表 BUY / SELL 文字标签: 在 MTF 信号点处显示清晰的买卖文字指示。 基于 ATR 的动态间距: 信号与文字位置根据 ATR 自动调整,避免图表重叠拥挤。 全方位提醒套件: 支持当前周期及 MTF

Indicator Description Opportunity Identification Indicator — Smart Money This indicator was developed to assist in identifying moments when prices may be reaching areas of greater interest , seeking possible signals in market behavior associated with the concept of “smart money” (Smart Money) , widely discussed in financial literature and market studies. The proposal is to create a bridge between technical analysis and fundamental analysis . The indicator uses technical analysis and price behavi

SMC Ultimate Pro Suite — 面向 MT5 的 8 合 1 智能资金概念(Smart Money Concept)指标
用一个强大的指标获得八套完整的交易系统。省钱,同时保持图表整洁。专为 XAUUSD(黄金)和外汇优化。无重绘——每个信号都在已收盘 K 线上确认。
您将获得:
1) 智能资金概念 — 进阶版
• 基于摆动拐点的供需区、ATR 缩放宽度、居中的 SUPPLY/DEMAND 文字 + POI 中线、重叠排除(ATR × 2)、5 区环形历史
• 价格突破水平后自动将区域转换为 BOS 线
• 市场结构:BoS / CHoCH / I-BoS / I-CHoCH(虚线 + 标签;内部 3-5-8 / 外部 10-25-50)
• 公允价值缺口(FVG)— closeOnly 模式(仅最近 FVG 着色)、收缩与突破处理
• 滚动 4H/1D 高低点 + 成交量活跃度分类
• NY / Asia / London 时段背景(纽约时间,支持夏令时)+ 时段倒计时面板
• 可选:ZigZag、关注区域(AOE

鬼变脸指标是一种结合了宝塔线(TOWER)与平均K线(Heikin-Ashi)过滤思想的趋势跟踪型技术指标。它通过对比价格对前期关键高低点的突破情况动态改变柱体颜色(即“变脸”),有效过滤盘中无序噪音,帮助交易者把握主升浪与主降浪。
核心逻辑与机制
动态变色:不以单根K线的收盘价与开盘价关系决定颜色,而是对比近N根K线(常见为3根)的极值。收盘价突破前高边界时由绿(或蓝)变红,跌破前低边界时由红变绿。
趋势锁定:只要价格未打破关键支撑或阻力,柱体便保持原色,避免交易者因盘中微幅回调被误导提前离场。
四大核心形态与买卖信号
形态类型图表特征交易含义绿/黑翻红连续绿柱后首次出现红柱,收盘突破前高买入/做多:多头趋势确认启动红翻绿/黑连续红柱后首次出现绿柱,收盘跌破前低卖出/做空/平仓:空头趋势确认确立三平底翻红连续三根柱体底部平齐且未破新低后转红强买入信号:底部坚实,反转成功率极高三平顶翻绿连续三根柱体顶部平齐且未创新高后转绿强卖出信号:顶部滞涨,见顶回落概率极大 实战使用技巧
顺势过滤(结合均线):引入一条中长期均线(如 20MA 或 60MA)。价格位于均线上方时,仅执行

PROMO-SALE RUNNING
Pre-Wick Retrace Indicator for MT5 Pre-Wick is a Meta Trader 5 price-action indicator designed to help traders identify potential retracement setups before price reaches the proposed entry area. The indicator analyzes price movement, wick rejection, market structure and trend conditions to identify potential setup areas on the chart. When a setup is confirmed on a closed candle, Pre-Wick can display: Entry Zone
Limit Entry
Stop Loss
Take Profit This allows traders to plan

Stryker Levels — Precision Daily Breakout Detection with Live TP/SL Projection Every institutional trading desk watches the same two numbers each session: yesterday's high and yesterday's low. These levels are where liquidity pools, where stop hunts happen, and where the highest-probability breakout and reversal setups form. Stryker Levels turns this concept into a fully automated, non-repainting detection engine that works silently in the background so you never miss the moment price commits to

# SessionLevels PRO MT5 – Smart Session High & Low Indicator
## Professional Trading Sessions Indicator for MetaTrader 5
SessionLevels PRO is a powerful MT5 indicator designed to automatically plot the most important trading session levels directly on your chart.
Perfect for Smart Money Concepts (SMC), ICT traders, price action traders, and anyone who relies on institutional market structure.
### Features
Asia Session High & Low
London Session High & Low
New York Session High & Low

将市场的倾斜度转化为您最大的交易优势! 厌倦了滞后且主观的指标? AngleMeter Pro 旨在彻底改变您在 MetaTrader 5 中的图表分析体验。基于高级三角学与统计线性回归,它通过具有连续色彩渐变的精美可视化量角器,实时测量趋势的精确角度。 结合用于宏观大局分析的双时间框架支持、动态平分通道、内置标准化迷你图表以及多语言交互面板,AngleMeter Pro 为识别趋势反转、突破和完美盘整区提供精准切入点。立即提升您的交易一致性! 指标概述 AngleMeter Pro 是一款专为 MetaTrader 5 (MT5) 开发的高级专业指标,旨在精确分析趋势、价格通道和市场背景。它融合了高级三角学、线性回归、量角器实时图形反馈(带连续渐变色彩)、标准化迷你图表和动态双语切换(葡萄牙语/英语),全面提升外汇、股票、股指和加密货币交易者的分析能力。 核心功能与技术细节 高级角度计算系统(三种模式): 模式 0(极值 Max/Min): 利用所选锚定周期内的最高价和最低价计算角度。 模式 1(开盘 → 收盘): 专注于分析周期内初始开盘价与最终收盘价之间的纯方向性变化。 模式 2

3个图表,1个画面,只需 USD 30! 还在不断切换月线、周线、日线、H4、H1 等不同周期,只为了看清市场的大趋势吗? Triple Mini Charts for MT5(三合一迷你图表) 让您直接在一个 MT5 交易画面中,同时显示 3 个独立迷你图表 。 无需频繁切换图表,即可快速掌握不同周期、不同交易品种的市场走势。 自由设置不同时间周期
支持不同交易品种 / Symbol
可选 MA200 移动平均线
每个图表独立缩放
自由显示 / 隐藏价格与日期
不需要时可收起单个图表
自动记忆您选择的时间周期 非常适合: 多周期分析|趋势交易|波段交易|日内交易|价格行为分析 例如,您可以同时查看: 月线 MN1 → 周线 W1 → 日线 D1 或者: 日线 D1 → 4小时 H4 → 1小时 H1 让您在一个画面中同时观察 大趋势、中期趋势和短期走势 。 只需 USD 30! 不用再来回切换不同周期。 一个画面,三个视角。
看清大趋势,把握市场全局。 Triple Mini Charts for MT5
让多周期分析变得更简单、更快速、更
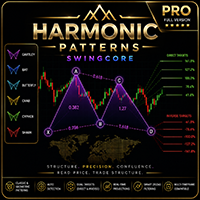
Harmonic Patterns SwingCore Pro | For MetaTrader 5 (MT5)
Technical analysis indicator for detecting and visualizing harmonic patterns on the chart, with Fibonacci level projection and configurable alert system.
================================================================================
WHAT THIS INDICATOR IS
It is a visual analysis tool. Its function is to identify structures on the chart that satisfy the geometric relationships of six classic harmonic patterns: Gartley, Bat, Butterfly

MA Distance Reversion Zones(均线偏离回归区域指标) 适用于 MetaTrader 5 的均值回归指标 — 可用于任何交易品种和任何时间周期。 该指标测量每根K线上价格偏离移动平均线的距离,并通过统计计算(Z分数)来识别行情动能耗尽的区域 — 即价格趋于回归均线的区域。因此,该指标有助于发现市场的顶部和底部,标记出动能减弱、更有可能发生反转的位置。 主要功能: 可自定义移动平均线 — 可选择周期、计算方法(SMA、EMA、SMMA、LWMA)及应用价格。 动态极值区间 — 基于偏离距离的标准差计算,自动适应品种的波动性。不是固定的通道,不会只适用于某一个特定市场。 逐K线偏离标记 — 每根K线都会显示彩色标记(正常 / 偏离扩大 / 极端偏离),实时直观显示价格偏离程度。 顶部与底部识别 — 信号箭头精确标记出价格在达到极端值(顶部或底部)后开始向均线回归的位置。 ️ 完全可调参数 — 可调整灵敏度阈值,将指标校准适用于任何品种(股票、指数、外汇、加密货币)及任何时间周期(从M1到月线)。 可选提醒功能 ,确保不错过任何信号

AQUA 是一款分析型指标,展示六个周期上三根K线形态出现之后价格行为的统计。 用途 AQUA 研究短小K线组合的重复情况,并展示历史上类似情形在统计上是如何收场的。它的任务是给交易者一幅客观的统计图景,说明该品种对某个具体三根K线图形的反应;交易决定仍由用户自己作出。 每出现一根新K线,指标便在六个周期上并行地把最近三根已收盘K线编码为 48 种形态之一,在每个尺度上扫描多达数千根历史K线,找出全部相同的组合,计算其结果分布,评估统计显著性并重绘图形。同样的工作若用手工完成——翻查历史、标出相似图形、统计结果比例并在每个周期上判断显著性——需要数小时,而且容易数错。AQUA 在几分之一秒内完成,并在每根K线上重复一次。 当前形态在图表上被框出,历史上找到的相同组合也在整段历史中各自加框。这样交易者可以迅速跳到任一匹配处,查看它出现时的背景。 方法 形态由两个彼此独立的特征构成。第一是三根K线的方向,给出八种组合。第二是它们 high-low 振幅的次序,再给出六种。合计 48 种形态,每一种都有自己的名称,因此一个组合可以用一个词来称呼,而不必描述。 对每一个历史匹配,都会记录其后一

GOLD SNIPER VISION
If you trade Gold, this indicator was built for you.
GOLD SNIPER VISION is a professional XAUUSD trading indicator for MetaTrader 5, designed to identify high-quality trading opportunities through multi-timeframe market analysis.
KEY FEATURES
• Clear BUY & SELL signals • Entry, Stop Loss & Take Profit levels • Multi-Timeframe market analysis • Multiple Scalping & Swing modes • Automatic market analysis • Professional dashboard • Designed specifically for Gold (XAUUSD)
TR

NeckLine Sentinel — AI-Scored Multi-Timeframe Head & Shoulders Scanner NeckLine Sentinel is a professional-grade pattern recognition engine built for traders who rely on classic chart formations but are tired of manually scanning charts for hours. Instead of watching one timeframe at a time, NeckLine Sentinel simultaneously monitors M15, M30, H1, H4, and D1 for both Head & Shoulders (bearish reversal) and Inverse Head & Shoulders (bullish reversal) patterns — and does it with a scoring system th

Cumulative Volume Delta Divergence
Cumulative Volume Delta Divergence is a volume-pressure analysis indicator for MetaTrader 5.
It combines estimated cumulative volume delta with regular and hidden divergence detection, higher-timeframe context, absorption analysis, exhaustion zones, configurable signal scoring, alerts, and historical target/stop outcome tracking.
The indicator is designed to help traders identify situations where price structure and estimated volume pressure are behaving di

Master-level overview of the UltraAlgo Multiple Confirmation (MC) Sniper Entry Pro Indicator, designed to be a comprehensive guide for traders seeking to dominate the markets.
The Architecture of Precision: Deconstructing the UltraAlgo MC Sniper Entry Pro The UltraAlgo Multiple Confirmation (MC) Sniper Entry Pro is not merely an indicator; it is a sophisticated, multi-layered trading ecosystem. It represents the pinnacle of confluence-based trading, moving far beyond the simplicity of a single

TriStrike Vanguard — Professional Three Line Strike Reversal Detector for MT5 Most reversal indicators flood your chart with false signals. TriStrike Vanguard was built to do the opposite: find the rare, high-conviction Three Line Strike formation — a proven four-candle reversal pattern institutional traders watch for — and confirm it through multiple layers of validation before it ever alerts you. What is the Three Line Strike pattern?
It's a four-candle reversal setup: three consecutive candl

Tired of entering a "trend" that turns out to be chop and stops you out? This filter shows real trends from noise at a glance. Any pair, any timeframe. No repaint. Free trial in the Strategy Tester.
THE PROBLEM Chop is expensive. It fakes a trend just long enough to trap you, then stops you out and moves on. You enter a "breakout" and it dies. You skip a real move after three fake trends. You read three indicators just to guess the market's state. The hard part isn't seeing that price m

系统初始化序列... 市场结构扫描器... 正常
三角形与楔形... 正常
旗形与三角旗形... 正常
通道与震荡区间... 正常
双重及三重顶底形态... 正常
突破确认过滤器... 正常
ENTRY / TP / SL 计算模块... 正常
交互式信息面板... 正常
状态: 已准备就绪。 “您好,操作者。我是 GC Figures。 我的任务是在黄金图表上识别技术形态、确认突破,并提供计算后的入场价、止盈和止损水平。” 指标工作原理 GC Figures 是专为 MetaTrader 5 开发的图表形态指标,主要用于分析 M15 和 M30 周期的 XAUUSD。 系统分析已经确认的局部高点和低点,检查形态几何结构,跟踪当前形成状态,并等待有效突破。 指标不会自动开仓、平仓或管理订单。最终交易决定始终由交易者作出。 支持的图表形态 对称三角形、上升三角形和下降三角形; 看涨下降楔形和看跌上升楔形; 看涨及看跌旗形; 看涨及看跌三角旗形; 上升通道和下降通道; 矩形整理及震荡区间; 双重顶、三重顶; 双重底、三重底。 信号逻辑 扫描: 分析已经确认的市场摆动高点和低

Momentum Alchemist — Dual-Engine Confluence Indicator Two independent detection systems. One confirmed signal. Momentum Alchemist fuses two complementary engines into a single, non-repainting confluence tool for MetaTrader 5: Force Trend System — a pressure/trend-state engine built on a volume-weighted moving structure and an ATR-based Supertrend filter. It reacts fast to shifts in buying and selling pressure. Pattern Recognition Engine — a historical pattern-matching module that scans thousands

CONFLUENCE AND PROBABILITY INDICATOR Volume • Fibonacci • Pullback • Technical Analysis This indicator was developed with an approach focused on identifying areas of interest in the market , combining different concepts widely used in technical analysis and trading studies. Its purpose is to assist traders in interpreting price behavior through the confluence of information , allowing each user to integrate the indicator into their own analysis system and personal strategies. KEY CONCEPTS ANALYZ

Half Trend Signal filters out minor market noise to deliver definitive, non-repainting long and short entry signals based on asset volatility and structural swing pivots. Instead of displaying standard lag-heavy moving averages, this system uses an adaptive directional engine to lock onto clean trend lines and overlay automatic risk-management matrices directly onto your chart. How It Works Trading Long Breakouts: When the system transitions from a bearish regime into a bullish regime, a Green

FluidTrades SMC — Liquidity Sweeps, Structure & Multi-Timeframe Trend in One Preset Sixteen Smart Money tools in one indicator — and a preset switch so you only ever see the three or four that matter for the trade in front of you. Most "all-in-one" indicators fail the same way: they turn everything on at once and hand you a chart you cannot read. FluidTrades SMC ships the full toolkit, but it opens on a Signal preset that draws only what you act on — structure, swings, the liquidity sweep, t

产品名称 :突破追踪交易系统(Breakthrough Tracker Trading System) 核心定位
本系统脱胎于多年实盘交易经验,历经不同市场环境的检验与优化,旨在彻底解决交易者在无序震荡行情中频繁损耗账户资金的痛点。其核心逻辑可概括为—— 只做突破,不参与震荡 。我们摒弃复杂的技术堆砌,将交易决策流程极简化、规则化、可复制化,帮助您在任何市场环境下都能保持清晰的交易视角。 适用品种与周期
系统当前针对 现货黄金(XAUUSD) 及主流外汇货币对( EURUSD、GBPUSD、USDJPY 等)进行深度优化,同时兼容多时间框架: 日内短线交易者,推荐使用 5分钟 周期; 波段趋势交易者,推荐使用 1小时 周期。
您也可根据自身交易风格,灵活调整至任意适配周期。 核心功能与使用规则 轨道识别系统
加载指标后,屏幕将显示三条颜色分明的动态轨道: 绿色上轨 —— 阻力边界 红色下轨 —— 支撑边界 蓝色中轨 —— 多空分水岭
重要原则 :当价格运行于轨道内部时,视为无序震荡阶段, 严禁开仓操作 。 入场信号(突破确立即入场) 当K线有效

Auto Trendline Pro: Smart Market Structure & Breakout Indicator (自动趋势线专业版:智能市场结构与突破指标) 停止绘制主观的趋势线,让算法为您完成繁重的工作。 Auto Trendline Pro 是一款先进的价格行为 (Price Action) 指标,通过自动将有效的更高的高点 (HH) 连接到更低的高点 (LH),以及将更低的低点 (LL) 连接到更高的低点 (HL),来识别高度准确的市场结构。该工具专为精度而构建,消除了人为错误,并提供了可适应实时市场流向的客观、实时的趋势线绘制功能。 无论您是日内交易者、剥头皮交易者还是波段交易者,该指标都能通过以最大精度精确定位高概率突破区,为您提供巨大的优势。 为什么要使用趋势线进行交易? 趋势线交易是最纯粹的价格行为形式之一。通过顺应市场的自然流动进行交易,您可以使自己与机构动能保持一致。 高概率设置: 趋势线充当动态支撑和阻力。当一条有效的趋势线被突破时,它预示着市场动能将发生高概率的转变。 极小风险,最大回报: 交易趋势线突破允许设置极紧的止损 (Stop Loss)。
MetaTrader市场是独有的自动交易和技术指标商店。
阅读MQL5.community用户备忘更多地了解我们提供给交易者的独特的服务:复制交易信号,自由职业者开发的自定义应用程序,通过支付系统完成的自动付款和MQL5云网络。
