 MetaTrader 5
 专家
专家 指标
指标 程序库
程序库 实用工具
实用工具 窗口小部件
窗口小部件 规则
规则适用于MetaTrader 4的EA交易和指标 - 24
 EA交易自动执行市场交易,而指标可使您更准确地分析报价并预测价格行为。
通过这些应用程序,您将能够更明智地在MetaTrader 4执行交易,抓住更多的交易机会。
EA交易自动执行市场交易,而指标可使您更准确地分析报价并预测价格行为。
通过这些应用程序,您将能够更明智地在MetaTrader 4执行交易,抓住更多的交易机会。 
Drawdown Manager MT4 是一个为使用 MetaTrader 4 的交易者设计的重要工具,旨在通过主动管理回撤和保护您的投资来保护您的交易权益。非常适合个人交易者和专有交易公司,这个工具为维护您的交易策略的完整性和资本安全提供了强有力的解决方案。 凭借实时警报和可定制风险参数等高级功能,Drawdown Manager MT4 确保您能够有效监控和控制您的交易活动。无论您是希望平仓亏损交易还是接收即时通知,这个工具都旨在提升您的交易表现并最小化潜在损失。 MQL 产品安装指南 | 在 MT4/MT5 上更新已购买的 MQL 产品 | 常见故障排除指南 | 指标设置 / 指南 主要特点 弹出警报:在信号事件上触发 MetaTrader 警报弹窗,让您不会错过任何交易机会。 推送通知:将实时推送通知发送到您的 MetaTrader 移动应用,方便随时监控。 电子邮件警报:在信号事件上发送电子邮件通知,以便在远离终端时进行远程监控。 图表上的仪表板:直接在图表上显示实时信息面板,以便即时状态概览。 安全交易配置:设置最大开放交易限额、回撤百分比和交易频率,以有效管理风险。 可

Apex Break PRO 是一款用于 MetaTrader 4 的不重绘枢轴趋势线突破指标。它能识别枢轴高点和枢轴低点,在连续枢轴之间绘制动态斜向趋势线,并在价格于确认K线收盘时突破这些趋势线时生成买入和卖出信号。每个信号通过多达四个独立的共振过滤层进行筛选——EMA趋势、RSI边界、成交量突增检测和ADX趋势强度——并以星级系统进行评分,让交易者立即了解有多少条件同时满足。基于ATR的止损和三个止盈级别为每个信号提供结构化的风险管理,而实时仪表盘则显示方向、过滤器状态以及带有触达标记的交易级别追踪。 MT5版本请访问: Apex Break PRO MT5 更多产品请访问: 所有产 品 如需查看实时示例和新工具,请访问我的主页并发送好友请求,以免错过任何更新! 工作原理 枢轴趋势线引擎 该指标使用可配置的回溯窗口(默认:左侧20根K线,右侧20根K线)扫描图表中的枢轴高点和枢轴低点。当发现两个或更多连续的枢轴高点时,将在它们之间绘制一条斜向阻力趋势线,并向前延伸最多500根K线。相同的过程从连续枢轴低点创建支撑趋势线。最多可同时显示五条阻力线和五条支撑线,随着新枢轴的形成,

MetaTrader 4 实时 Renko 图表 KT Renko Live Chart 会根据您加载它的品种,在 MetaTrader 4 中生成实时 Renko 图表。砖块写入离线图表,该图表随新报价更新,并支持自定义指标和智能交易系统。 设置步骤 将工具加载到需要转换的品种图表上,并保持该图表打开。M1 图表可提供最详细的历史。 通过“文件”中的“打开离线图表”打开 Renko 图表,选择对应 Offline Time-Frame 的品种,例如 EURUSD,M2。 如需在 Renko 图表上运行智能交易系统,请打开图表属性(F8)并取消勾选“离线图表”,使 EA 能接收新报价。 参数 Renko Box Size in Pips: 砖块大小。在五位报价和三位 JPY 报价上,一个 pip 等于十个点。 Offline Time-Frame for Renko Chart: 离线 Renko 图表的周期,默认值为 2。不使用 M1 或 M5 等标准周期。 Show Wicks: 显示或隐藏 Renko 影线。 Limit Bars: 限制转换的源图表K线数量,从而降低终端负载。设

Gold Label is an Expert Advisor designed specifically for trading gold. This EA is specifically designed for XAUUSD with low risk and can grow your account from small capital. It is based on machine learning cluster analysis and genetic algorithms. EA contains self-adaptive market algorithm, which uses price action patterns and standard trading indicators. Expert showed stable results on XAU in 2011-2020 period. No dangerous methods of money managment used. Suitable for any broker conditi
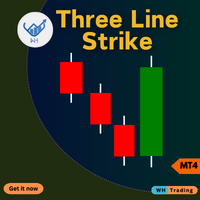
三线打击指标 适用于 MetaTrader 4 (MT4)。这款先进的工具旨在帮助您精准、轻松地识别市场中潜在的逆转。
无论您是初学者还是经验丰富的交易者,该指标都可以增强您的交易决策并最大化您的利润。 Contact me after purchase for guidance 主要特点: 准确的反转信号 :根据三线打击模式(技术分析中经过验证的烛台形态)检测潜在的趋势反转。 多符号和多时间范围 :通过仪表板/扫描仪(GUI)访问多符号和时间范围。 可自定义的设置 :使用可调节的参数(例如,打击模式、时间范围和视觉偏好)来根据您的交易风格定制指标。 实时警报 :当三线打击模式形成时接收即时通知,这样您就不会错过重要的市场机会。 用户友好界面 :直观的设计可以轻松解释信号并将其集成到您的交易策略中。 兼容性 :与您现有的 MT4 设置无缝集成,以获得流畅、高效的交易体验。 为什么选择三线走势指标? 提高您的交易绩效 :通过可靠且及时的反转信号增强您的决策能力。 节省时间和精力 :自动化您的分析并专注于执行有利可图的交易。 适合所有交易者 :无论您是日内交易者、波段交易者还是长期投

跟踪平滑 Heiken Ashi 状态 KT Heiken Ashi Smoothed 将价格走势显示为平滑的蓝色和红色蜡烛。当状态从看跌转为看涨时,它会绘制蓝色向上箭头;当状态从看涨转为看跌时,它会绘制红色向下箭头,让图表上的方向转换清晰可见。 平滑周期和平滑方法决定蜡烛的平滑程度。与标准 Heiken Ashi 相比,它提供更稳定的走势视图,同时可根据图表选择合适的响应速度。 蓝色蜡烛: 表示看涨状态。 红色蜡烛: 表示看跌状态。 蓝色向上箭头: 标记从看跌转为看涨。 红色向下箭头: 标记从看涨转为看跌。 一眼比较多个时间周期 紧凑的 MTF Scanner 显示从 M1 到 Monthly 各时间周期的看涨或看跌状态。无需切换图表,即可将当前图表与更短和更长的时间周期进行比较。 解读蜡烛形态并调整显示 没有下影线的蓝色蜡烛 可能伴随强劲的看涨走势,而 没有上影线的红色蜡烛 可能伴随强劲的看跌走势。带有上下影线的小实体蜡烛可能出现在方向变化时。 您可以调整平滑周期和平滑方法,也可以设置看涨和看跌箭头的颜色、大小及符号代码,使其符合您的图表布局。 在方向变化时接收提醒 可选择适合您工

該指標計算最可能的趨勢止損/逆轉區域,有信心的趨勢運動區域。
計算考慮:
價格變動率; 圖表的相對偏差角度; 價格變動的平均幅度; 價格離開“舒適區”; ATR 指標的值。 當價格進入止損/反轉區域時,該指標可以生成警報。
設置 Draw the entire length? - 繪製直到圖表末尾的區域; Show Stop UP-trend - 顯示上升趨勢的停止/反轉區域; Show UP-trend - 顯示上升趨勢的區域; Show DOWN-trend - 顯示有信心的下降趨勢區域; Show Stop DOWN-trend - 顯示下降趨勢的停止/反轉區域; Alert in the area change - 當價格進入趨勢止損/變化區域時生成警報; 接下來是每個交易區域的顏色設置。

SMC Structure Gap Monitor Pro 这款 MetaTrader 4 指标适合希望使用更完整 SMC 工作流的交易者,重点关注结构突破、inducement、未触及与已触及的 Fair Value Gaps、流动性 sweep 以及 momentum 背景。 核心思路: 这款版本不仅仅显示孤立的结构标签,而是帮助你理解价格如何累积压力、inducement 在哪里形成、sweep 在何时出现,以及 momentum 在这些区域附近如何增强或减弱。 上市价格: 本产品目前以推广价格发布,未来版本更新后价格可能会调整。 快速概览 产品类型 MetaTrader 4 指标 主要用途 结构流、inducement、Fair Value Gaps、sweeps 和 momentum 背景分析 使用方式 主观图表分析、复盘,以及面向 EA 的缓冲区读取 分析周期 可由用户选择,包括当前图表周期 外部 DLL 不需要 这一版本的不同之处 如果你已经了解免费版 SMC Structure Gap Monitor ,那么这个 Pro 版本是在同一基础上扩展出的更完整结构模型。 免

如果你见过价格创出新高,但随机指标没有同步确认,那么你已经明白为什么交易者会关注背离。KT Stoch Divergence 会把这种价格与指标之间的不一致直接标记在图表上,帮助你发现潜在反转和趋势延续机会,无需手动画出每一条背离线。 该指标识别价格与随机指标之间的常规背离和隐藏背离。它提供的是交易背景,而不是自动下单信号。你仍然需要根据自己的图表判断这个机会是否合理。 交易者如何使用 当价格接近支撑位且卖压可能减弱时,关注常规看涨背离。 当价格接近阻力位且买盘力量可能减弱时,关注常规看跌背离。 利用隐藏背离寻找可能顺着当前趋势继续运行的回调机会。 把背离作为入场过滤条件、离场参考,或自己交易策略的额外确认。 主要功能 标记常规和隐藏的看涨与看跌背离。 适用于反转和趋势延续分析。 过滤不对称背离,让图表更清晰。 包含 MetaTrader 提供的预警方式。 可辅助入场和离场决策。 Expert Advisor 可以读取指标数据,用于自动化策略。 如何理解信号 常规看涨背离: 价格形成更低的低点,而随机指标形成更高的低点。 常规看跌背离: 价格形成更高的高点,而随机指标形成更低的高点。
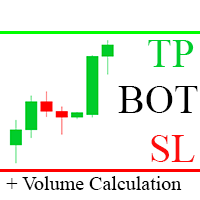
TP SL Bot - 新开立的 订单根据您的指示自动设置止损和止盈的工具。此外,还提供了一个计算器功能,可以计算在给定止损 / 止盈大小下,需要开立交易的数量来达到所需金 额。 有几种 选项来调整大小和参数: 1. 根据用 户指定的百分比来调整止损和止盈金额,作为账户余额的百分比。 2. 根據使用者指定的止盈和停損金額進行調整。 3. 根据开 仓价格的点数( tick )来 调整。 4. 根据开 仓价格的百分比来调整。 特点: 简单易用的界面 适用于市价 订单和挂单 适用于所有品种和 时间周期 多个工作模式 风险管理系统所需正确交易量的计算器 工作原理: !工具在 订单开仓后接收到第一个 tick 时更改订单参数。 模式 1 (存款百分比)。您 设置了存款百分比以计算止损和止盈金额。计算以点数 ( tick ) 为单位进行。 模式 2 ( 金 额 ) 。您设置了期望的止损和止盈金额。工具会自动计算点数 ( tick ) 大小。 注意 ! 前两种模式可能会有小 误差 , 因为指定的金额不一定是最小 tick 值的倍数。 模式 3 ( 点数 ) 。您 设置了止损和止盈的点数 ( tick

Grid Engulfing is a trading strategy that combines grid trading with engulfing patterns. Grid Trading: A grid trading strategy involves placing buy and sell orders at regular intervals (grid size) above and below a set price level. The goal is to profit from small price movements within a range-bound market.
Engulfing Patterns: Engulfing patterns are a type of candlestick pattern that indicates a potential reversal or continuation of a trend. A bullish engulfing pattern occurs when a small
FREE

BIG CANDLE ALERT https://www.mql5.com/en/users/earobotkk/seller#products P/S: If you like this indicator, please rate it with 5 stars in the review section, this will increase its popularity so that other users will be benefited from using it. This indicator draws a bullish and bearish vertical line inside a candle whenever the size of a candle body exceeds the minimum size specified in the input. INPUT Bullish Candle Color: choose the color of your choice. Bearish Candle Color: choose the co
FREE

======================================================== GANN CLUSTERS - INSTITUTIONAL SIGNAL PANEL - MQL5/MT4 MARKET DESCRIPTION (formatting: **bold** = Bold button; lines with • = bullet list; UPPERCASE = heading) ========================================================
OVERVIEW ------------------------------------------------------- **Gann Clusters** finds where three independent Gann systems agree and draws those **confluence clusters** across multiple timeframes, with a signal panel that
FREE
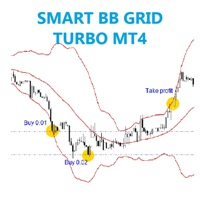
The EA trades on price break out upper or lower BB . Any pair, time frame any broker no limited, recommend minimum deposit 500$
SETTING BB_period - Set BB period. Deviation - Set deviation. Lots - start lot. Multiple_lots - Multiply lot for next order. Max_lots - maximum lot. Grid_boost - Frequency of opening position (Less more order). Grid_minimum_pips - Check distance grid from last order. TP_pips - take profit, in pips. SL_money - Stop loss in money. Number order for DD Reduction Algori
FREE

Master Close via Telegram can help you perform some management tasks on MT4/MT5 remotely via your Telegram by one click, easy to set up & use. Demo here (see more Master Notify Master Control ) ************************************************************************************ LIST OF COMMANDS: info_acc - Get account info info_pen - Get pending orders details info_pos - Get positions details info_pos_sum - Get positions summary
close_pen - Delete all pending orders close_pos_all -

Gooinsta Hedge Plus
Gooinsta Hege Plus is expert advisor major trend calculation EA Fitur : Auto lots and fix lot Auto tp and cut profit Trend follow order position Cover mode when order position loss Send info notification to smartphone button close buy , close sell and close all EA Inputs : Start_Setting = " ------------ Gooinsta Hedge+ ------------ "; EA_Name = "Gooinsta Hedge+"; Logic = 1; Lots = 0.0 --- If Lots=0 Auto Lots aktive Risk = 15.0; mLots = 15.0; Step = 20; Takeprof
FREE

EASY Insight AIO – 全能智能交易一站式解决方案 概述
想象一下,您可以在几秒钟内扫描整个市场——外汇、黄金、加密货币、指数,甚至股票——无需手动筛选图表、繁琐安装或配置指标。
EASY Insight AIO 是您专为 AI 交易打造的即装即用数据导出工具。它将整个市场快照一次性输出为简洁的 CSV 文件,直接支持 ChatGPT、Claude、Gemini、Perplexity 等各类 AI 平台的即时分析。 无需窗口切换,无需图表叠加,也没有任何杂乱。只需纯净、结构化的数据自动导出,让您专注于基于数据的高效决策,无需再盯盘耗时。 为什么选择 EASY Insight AIO? 真正的一体化
• 无需设置,无需安装指标,无图表叠加。只需安装、运行并导出——就是这么简单。 多资产全覆盖
• 扫描分析外汇、金属、加密货币、指数、股票——您的券商所能提供的一切市场。 AI 专属数据导出
• 高度结构化、针对 AI 优化的 CSV 文件,直接适配主流智能工具和平台。 完整导出内容:
• 三个可选周期的货币强度分析
• 净多头头寸变化体现市场情绪
• 成交量变化、
How To Trade
Execute your trades in 3 Easy Steps!
Step 1: Trade Setup Entry Buy in Signal price and TP1 in price indicator, You can use trailing stop in TP1. Entry Sell in Signal price and TP1 in price indicator, You can use trailing stop in TP1. Success Rate ≥ 75% 100:25 Step 2: Set Stop Loss Stop loss BUY ----> You can set stop loss on Line Order SELL. Stop loss SELL ----> You can set stop loss on Line Order BUY. Step 3: Set Take Profit Option 1: Take profit on TP1. Option 2: Partial take pr
FREE

1. 概述
osasFXea Diamond 是一款专为 MT4 黄金(XAUUSD)设计的全自动 EA,兼容美分和标准账户。以多时间框架增益指数(Gain Index)为核心,结合动态风控,无需人工干预,自动捕捉高概率机会并精准执行。 2. 业绩表现(基于 90% tick 数据回测) M5(12个月) :初始 1,000 USC,净利润 5,557 USC,回报率 555%,胜率 84.05%,最大回撤 4%。 M1(1年) :净利润 9,825 USC,回报率 982%,胜率 71.25%,最大回撤 1.96%。 3. 策略核心 增益指数 :同时计算 H1、H4、D1 三个周期的价格变化,仅当三者方向一致时才触发信号,有效过滤噪音。 入场过滤 :MA(5/20)趋势、RSI(30~70)、K线方向,以及 ATR 动态调仓。 出场逻辑 :RSI 超买超卖离场、移动止损、保本止损、ATR 动态止盈。 4. 风险管理 ATR 动态手数(高波动减仓,低波动加仓) 保本保护(盈利达设定点数后止损移至入场价) 移动止损锁定利润 可配置每日最大交易笔数,防止过度交易 5. 推荐设置 参数 推

自适应 ADR 自适应 ADR 是一款用于计算和显示平均每日波动范围 (ADR) 的专业级技术指标,适用于需要精确掌握日内波动结构的交易者。该工具通过多种可调节参数,为不同交易风格提供灵活支持。 计算与方法 四种平滑方式: SMA、EMA、SMMA (Wilder)、LWMA 可根据不同市场环境与波动率模型自由选择 支持多品种、多周期使用,适合趋势与震荡市场 动态日内逻辑 随交易时段开始自动运行 围绕开盘价设置两个对称区间 区间会自适应收窄直到首次触及 ADR 达到 ADR 后区间固定至收盘,提供明确的日内波动边界 有助于识别超出正常波动范围的行情行为 视觉引导 可选开盘价线 可自定义颜色、线型、透明度与可见性 适合深色与浅色主题,便于整合到个人图表布局 应用价值 清晰的日内结构 精准评估每日波动范围 适合突破、均值回归、区间交易与波动率策略 帮助交易者避免过度交易并识别高概率区域

气泡指标 —— 价格减速 + 成交量激增检测 一个简单直观的可视化工具,当价格突然放缓并伴随成交量激增时,会在图表上显示彩色方块。
(包含填充功能与同心气泡效果)
它能帮助交易者更清晰地观察市场节奏,发现潜在的关键转折点。 指标功能: 识别市场在启动前“犹豫”的时刻 显示成交量放大但价格波动不大的区域 帮助提前发现潜在的突破信号 工作原理: 分析比当前图表更小的时间周期 检测异常小的K线(价格放缓) 检测异常高的成交量(成交量激增) 显示绿色(看涨)或红色(看跌)方块 主要设置: 价格敏感度: 数值越低,越敏感 成交量倍数: 数值越高,越严格 气泡大小: 调整显示效果 实用价值: 简单直观 无需复杂计算 发现有趣的市场结构与节奏 完全可自定义 非常适合用于区间交易、突破判断或理解市场动态。

Metavers V2
https://www.nxfx.c
Scalper Base on Many indicator No Grid No Martingale one just open Trade per Day This Expert is not working on all Broker you need low Spread broker with Low Slippage
Broker is Tickmill or TMGM Symbol USD CHF ,EURAUD,EURCAD,USDAUD,USDCAD,EURGBP.AUDCA
FREE
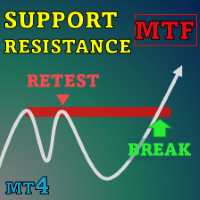
Special offer : ALL TOOLS , just $35 each! New tools will be $30 for the first week or the first 3 purchases ! Trading Tools Channel on MQL5 : Join my MQL5 channel to update the latest news from me 在瞬息万变的金融交易领域,准确识别和分析支撑与阻力位对于做出明智的投资决策至关重要。 SnR Retest and Break Multi-Timeframe 是一个支撑与阻力指标,旨在增强您的交易分析。利用创新的 Timeframe Selector 功能,该工具提供了多个时间框架下的市场动态全面视图,帮助您做出精确的交易选择。 查看更多 MT5 版本请访问: SnR Retest and Break MT5 Multi Timeframe 查看更多产品请访问: All P roducts 主要功能 SnR Retest and Break Multi-Time

The Wave Scalper EA is fully automated scalping system that uses price action to identify good scalping trades and executes them with an invisible trailing stop loss. It also includes a money management feature which calculates lot size based on account size and risk with an option to set a maximum draw down at which the EA will stop trading. This is a long term strategy combined with money management which works well on most pairs, but predominantly GBPUSD, USDCAD, EURUSD, AUDUSD & USDJPY. Plea
FREE
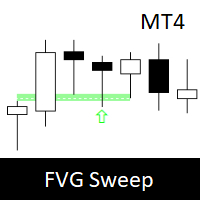
Fair Value Gap Sweep is a unique and powerful indicator that draws fair value gaps on your chart and alerts you when a gap has been swept by the price. A fair value gap is a price gap that occurs when the market opens at a different level than the previous close, creating an imbalance between buyers and sellers. A gap sweep is when the price moves back to fill the gap, indicating a change in market sentiment and a potential trading opportunity.
Fair Value Gap Sweep indicator has the following
FREE

This indicator is based on Guppy's GMMA Strategy. And shows arrows when GMMA lines cross up or down. To have this indicator and get alerts for Multiple Timeframes and multiple Pairs you can check out the demo of this GMMA Trend Scanner indicator: https://www.mql5.com/en/market/product/38747
About GMMA In Brief:
GMMA attempts to identify trends by combining two groups of moving averages with differing time periods: The long-term EMAs (30, 35, 40, 45, 50, and 60) the behaviors of investors that h
FREE

Super trend is one of the best trend indicators in metatrader 4 (MT4). Triple SuperTrend indicator is an indicator that consist of three super trend indicator that can be aranged. This indicator is built by mql4 language and doesn't provided by MT4 platform. Highly recommended using EMA SuperTrend Strategy Indicator if you want to get better result in here:
https://www.mql5.com/en/market/product/91664
This indicator is easy to use, power full and has many benefits, there are: Using three indic
FREE

TCL Trend Radar is a multi-timeframe trend dashboard for MetaTrader 4. It applies a three-condition algorithm (Moving Average cross plus Directional Movement Index plus Average Directional Index gate) to grade the trend on every standard timeframe and displays the result on a single panel. How It Works For each timeframe the indicator computes three things: the relationship between a Fast and a Slow Moving Average, the Directional Movement Index (DMI) for trend direction, and the Average Directi
FREE
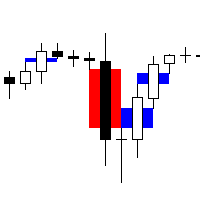
Next Arrival : Flip or Die Trading Arena. Flip a trading account: https://flipordie.com/chapter-1-thirteen-doublings-double-a-trading-account/
Fair Value Gap Scanner 4 is a sophisticated MetaTrader 5 indicator designed to detect fair value gaps (FVGs) in price action and display them as rectangles directly on the chart. This powerful tool empowers traders by providing visual representations of FVGs, enabling them to identify potential trading opportunities with ease and precision. With customi
FREE

MTF High Low indicator displays key price levels across multiple timeframes directly on your chart, so you always know where the market has been and what levels matter most.
The NY Session High/Low Levels automatically plot the highest and lowest prices of the New York trading session on your chart. It provides clear horizontal lines for the Today (TDY) , Yesterday (YTD) , Week (7D) , and Month (30D) sessions, with customizable display options. Inspired by MTF.HighLow
FREE
Automated strategies are commonly used by institutional investors, banks, and hedge funds due to their ability to handle large volumes of trades with greater precision and efficiency. However, they are also increasingly being adopted by individual traders who use trading platforms that offer automated trading capabilities. While a profit of 10 percent may seem small , it can add up over time with consistent trading . It is important to note that trading involves risks, and traders should a
FREE

The Swing High Low Indicator is an essential tool for traders who rely on price action. It automatically marks key reversal points (swing highs in red, swing lows in green), helping you visualize trends, spot breakouts, and draw precise trendlines. By highlighting these critical levels, the indicator reveals market structure shifts—whether the trend is strengthening, reversing, or entering consolidation. Perfect for all timeframes and strategies, it turns raw price data into actionable tradi
FREE

BlueDigitsFx 官方生态系统入口 此免费工具是 BlueDigitsFx 交易基础设施生态系统的一部分。 通过 BlueDigitsFx 官方机器人获取更新、工作流程资源、产品发布信息以及官方生态系统访问权限。 Telegram 生态系统
官方网站
MT5 版本
BlueDigitsFx Open Trades MT4 —— 用于主动交易管理的实时点数监控工具 BlueDigitsFx Open Trades 是一款免费的 MT4 工具,可直接在图表上实时显示所有未平仓交易的总点数结果。 该工具采用清晰的颜色编码显示方式,帮助交易者快速识别盈利和亏损仓位,并监控多个活跃交易及货币对的整体表现。 它专为希望获得更清晰交易视图、更快速仓位监控以及无需频繁切换多个窗口即可管理交易会话的交易者而设计。 通过在图表上持续显示未平仓交易的整体表现,交易者无需频繁打开 MetaTrader 终端窗口即可更快做出反应。
主要功能 实时点数显示 —— 直接在图表上监控所有未平仓交易的总点数结果。 颜色编码交易概览 —— 快速识别正收益和负收益交易表现。 多交易监控 —— 适用于同时
FREE

The Pivot Point indicator automatically calculates and displays the pivot point line and support and resistance levels. Pivot can be calculated according to the Classic, Floor, Fibonacci, Woodie, Camarilla or DeMark formula. It is also possible to select the period for calculating the indicator. A trader can choose from daily, weekly, monthly, or user-defined periods.
Types of pivots Classic Floor Fibonacci Woodie Camarilla DeMark
Main features The indicator shows the current and historic
FREE
Summary of the Expert Advisor This EA will trade using standard MT4 indicators such as Moving Averages, MACD, RSI, Bollinger Bands, and so on. The EA was made so that these indicators can be mixed or matched so a number of possibilities can be traded with. Each indicator can be enabled or disabled and many settings are adjustable for each indicator. There are also other features included like multiple time frame capability and money management. As a result, many different trading strategies can
FREE

# Smart Sweep Sniper MT4 Version What’s New in V.11 : Now with Automated Midnight Open (Broker GMT Sync) The Institutional Edge — Detect Where Smart Money Acts, Enter When It Matters
If you like it, leave a positive review to support its development. If you encounter a bug, let us know before posting a review. When you complete your challenge, share your certificate in the comments. Happy trading! Smart Sweep Sniper is a precision-engineered MetaTrader 4 indicator that identifies high-probabi
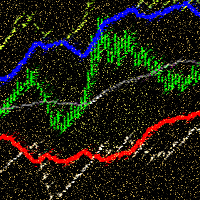
ADX Channel is an indicator that plots the channel depending on the values of the ADX (Average Directional Movement Index) indicator. The resulting channel is a little similar to the Envelopes, but its lines depend on the market volatility. The sell trade is usually executed fast when the price touches and bounces from the upper line of the channel, buy - from the lower. It is recommended to trade when there is no significant news. The recommended timeframes: M5 - H1. The indicator is not design
FREE

产品简介 Liquidity Pool Hunter 是一款专为 MT4 和 MT5 双平台设计的流动性池主图指标。它基于机构订单流理论,通过统计近期高低点构建流动性聚集区域,精准识别市场中的扫荡、假突破与真突破行为。该指标帮助交易者站在机构视角,识别主力资金的猎杀流动性行为,从而在假突破后的反转行情中捕捉高概率的买卖时机,并提供完善的多通道信号提醒。 核心功能 流动性池区域与高流动性提示 系统通过统计指定周期内的最高价、最低价以及 K 线实体的最高和最低点,构建出 空头流动性池(红色边界线) 和 多头流动性池(绿色边界线) 。这些区域代表了市场中止损单和挂单密集聚集的价格带。当价格在近期频繁触及某一区域时(10 根 K 线内触及 3 次及以上),图表右侧会显示 High Liq Zone (高流动性区) 或 Low Liq Zone (低流动性区) 提示,代表该方向存在大量待猎杀的流动性。 MT5 版本额外支持趋势 K 线染色功能 ,让流动性扫荡行为通过颜色变化更加直观。 做多信号 Bull Sweep (多头扫荡) :当价格向下刺穿多头流动性池下边界

Sniper Trend Fusion This indicator is a powerful all-in-one trading tool designed to simplify chart analysis and improve decision-making. It combines multiple proven techniques into a single system, helping traders identify trend direction, volatility, key price levels, and market structure without clutter.
Instead of switching between multiple indicators, everything you need is integrated into one smooth and efficient interface. Key Advantages All-in-One System
Combines trend, volatility, sup
FREE

INFOPad是一个信息面板,用于在MetaTrader 4终端中创建所选货币对的信息。 该指标有5个功能: 显示所选符号的主要和主要信息:询问BID,点差,止损水平,掉期,刻度值,佣金价格; 显示SL目标和TP目标的未来目标(已建立的止损和获利点数,美元金额); 它显示了期间收到的利润:今天,周,月,年,所选货币的总利润; 它显示当前的未平仓头寸,其手数(交易量),头寸数量,头寸头寸的利润,美元,百分比; 显示有关未结交易的图表的其他信息。它显示了止损和获利水平以及这些止损水平的目标; 在符号上打开事务,关闭事务,修改事务时,将信息写入日志文件; 在开始交易,完成交易,修改交易时播放声音文件; 打开交易,关闭交易,修改交易时,向手机发送信息性消息(PUSH通知)。 INFOPAD for Metatrader 5 一键式交易面板: VirtualTradePad 亲爱的朋友和我们的顾问用户,在 评论 部分添加您的评分 。 我们的外汇软件的所有更新都是 免费的 ! 主要特征 货币对的名称,符号上存在未平仓头寸,其类型和手数。 询价和买价以可读格式; 当前头寸的盈利能力,当前存款的
FREE

"Candlesticks MTF 4" is an informational indicator that displays "Japanese Candlesticks" . The indicator analyzes and determines the opening and closing times of candles from higher time frames.
An algorithm has been developed for the "Candlesticks MTF 4" indicator that corrects the discrepancy between the opening and closing times of candles from higher time frames. For example, if the opening time of a candle on a weekly time frame is the 1st of the month, and on the smaller time frame this
FREE
Индикатор "Reversal zone" показывает силовые уровни и возможные точки разворота на текущем графике. Индикатор "Reversal zone" поможет трейдеру разобраться с текущей ситуацией The "Reverse zone" indicator shows power levels and possible reversal points on the current chart. The "Reverse zone" indicator will help the trader to deal with the current situation
FREE

Ichimoku Wave Pro
产品简介
Ichimoku Wave Pro 是一款用于 MetaTrader 4 的图表分析指标,帮助交易者在同一张图表中研究 Ichimoku 的波动理论、价格理论和时间理论。
指标会自动寻找看涨和看跌的 A-B-C 结构,并将其视为 N 波候选结构;同时计算经典的 V、N、E 和 NT 价格投影,跟踪价格是否突破 B 点完成第三段确认,并显示重要的 Ichimoku 时间计数。
产品还包括交互式信息面板、可选的 Ichimoku 共振过滤、高周期背景、P/Y 结构辅助线、可拖动的 A/B/C 点以及可选提醒。
本产品是分析工具,不会自动开仓、修改订单或平仓。
主要功能
- 自动识别看涨和看跌 A-B-C / N 波候选结构。 - 区分 N 波候选状态和已确认第三段。 - 计算经典 Ichimoku 价格目标 V、N、E、NT。 - 可选高阶 E 投影。 - 在图表和面板中跟踪目标是否已到达。 - Kihon 时间数字:9、17、26、33、42、65、76、129、172。 - 根据 A-B 与 B-C 的K线数量计算对应时间。
FREE

水印 MT4 版本: https://www.mql5.com/en/market/product/120783 MT5 版本: https://www.mql5.com/en/market/product/120784
Logo MT4 版本: https://www.mql5.com/en/market/product/121289 MT5 版本: https://www.mql5.com/en/market/product/121290
“水印”脚本旨在通过在图表背景上直接显示关键信息来增强您的交易图表。该脚本提供了一种清晰且不显眼的方式来跟踪关键细节,例如当前交易对、时间范围以及各种时间指标。
功能:
交易对显示:
该脚本会自动检测并在图表上显示当前交易对(例如 EUR/USD、BTC/USD)。这可确保交易者始终了解他们正在分析的资产,从而降低基于错误货币对做出决策的风险。
时间范围显示:
脚本显示当前图表时间范围(例如,1 分钟、1 小时、1 天)。这有助于交易者了解他们正在查看的具体时间范围,无论是用于剥头皮交易、日内交易还是长期分析。
时间指标:
G
FREE

RSI 表:您的多时间框架 RSI 控制中心!
您是否厌倦了不断在图表和时间框架之间切换,以全面了解您关注的资产的相对强弱指数 (RSI)?您是否因为重要的超买或超卖信号隐藏在其他图表中而错过了它们?
推出 RSI 表 - 一项旨在让您在一个直观的仪表板上即时全景查看多种工具和时间范围内的 RSI 值的指标!
停止无休止地按按钮,开始以无与伦比的清晰度和效率进行交易。
为什么 RSI 图表会改变你的交易:
RSI 图表不仅仅是另一个指标;它是一个分析仪表板,可以改变您使用最流行的动量振荡器之一的方式。
• 即时概览多个市场: * 自定义您喜欢的货币对、指数、金属或加密货币。 * 优势:专注于*您的*关注列表并一目了然地获取最新数据,为您节省大量时间和精力。
• 前所未有的多时间框架功能(颠覆传统!): * RSI 表格允许您设置三个独立的列,每个列都有各自的自定义 RSI 周期和时间框架(例如 H1、H4、D1)。 * 优势:通过同时观察 RSI 在不同时间框架下的表现,发现隐藏的背离、确认趋势并识别高概率的设置。这对于多时间框架分析和策略确认至关重要。
FREE

Ichimoku Bollinger PRO 3D (Stellar Edition) Transform your trading edge with Ichimoku Bollinger PRO 3D , a next-generation technical indicator designed for MetaTrader 4. Combining the deep analytical power of the classical Ichimoku Kinko Hyo framework with the volatility tracking of Bollinger Bands, this Stellar Edition brings a sleek, cosmic-inspired neon interface right to your charts. Key Features & Advantages No-Repaint Entry Signals: Receive high-probability BUY , SELL , STRONG BUY , and ST
FREE

顧問 對於新聞交易,顧問會在設定時間在新聞發布之前下掛單! 閾值是與當前價格的距離;觸發持有時,將打開市價訂單,並且相反的持有將翻倍,只需3個週期的增加! 止損單和止損單的計算方式是,止損單將覆蓋止損單的負值,結果我們將得到總計+!!!
1 模型的情況,第一手是 0.01,例如,賣出,如果有一個方向的無後座力運動,例如,買入,那麼我們得到 + 該情況的模型2:第一個賣單開倉0.01,價格進入回滾並捕獲(第二次買入停損延遲),增加手數開倉0.02,價格進入買入,達到賣出價,我們仍然得到總計 + 該情況的第三個模型,第一個訂單開倉賣出0.01,價格進入回滾並捕獲(第二次買入止損延遲)增加手數0.02 開倉,價格再次反轉並賣出並捕獲延遲0.04,當價格進一步走向我們仍普遍的看法+
如果價格朝任何方向波動,訂單應以 + 收盤! 適用於任何趨勢波動的貨幣對歐元/美元的預設設定和討論中的近似設置
設定 手數 = 0.01 手數 Porog=250 存款門檻(pp)
FREE
Multiple Divergence Detection System for MT4
多指标「背离」识别与可视化工具(Regular / Hidden,10个指标源,轻量高效) ________________________________________ 核心价值 • 一图整合:自动检测并可视化 常规背离(Regular) 与 隐藏背离(Hidden),在价格与指标之间绘制连线、标注顶部/底部标签,清晰直观。 • 多源共振:内置 MACD / MACD Histogram / RSI / Stochastic / CCI / Momentum / OBV / VWMACD / CMF / MFI 指标,可设定最小合成数量过滤噪音,聚焦更“强”的背离。 • 显示可控:支持是否显示连线/枢轴、标签显示全称/首字母/不显示、仅显示最近一组等,面向盘中观察更友好。 • 轻量高效:限定最大回看、线段/标签数量,适合多周期、多品种并行运行。 ________________________________________ 推荐品种与市场类型 • 更适合震荡/非趋势型
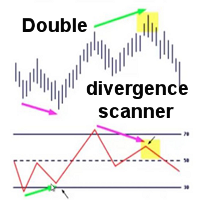
这种多指标/震荡指标(以下简称指标)、多时间框架和多品种指标可识别价格与一个、两个或三个指标之间何时出现背离。它识别常规/经典(趋势逆转)和隐藏(趋势延续)背离。它具有 RSI 和 MA 趋势过滤器选项,可以仅过滤掉最强的设置。结合您自己的规则和技术,该指标将允许您创建(或增强)您自己的强大系统。 它可以通过 3 种方式使用: 设置主要指标和第二/第三指标,并将默认值“当前”保留为第二时间范围。通过这样做,您只会在您选择的每个时间范围内出现双重背离时收到警报。 设置主要指标和第二/第三指标并将第二/第三背离的时间范围设置为例如 H4,或将“一个时间范围更高”设置为 True。通过这样做,您只会在 H4 时间范围内或高于主要背离的一个时间范围内出现第二个/第三个背离时收到警报。 仅设置主要指标。通过这样做,您将在所选指标出现背离时收到警报。 特征
可以检测以下指标的背离:MACD、随机指标、OsMA、RSI、CCI、Awesome (AO)、ADX、ATR、OBV、MFI、动量和综合指数。 可以同时监控您的市场报价窗口中可见的所有交易品种。将该指标仅应用于一张图表,并立即监控整个市场。

Ideally, this is we hope : The good numbers on news should make the related currency become stronger, and the bad numbers on news should make the related currency become weaker. But the fact is: The good numbers on news that has been written on the economic news calendar could not always instantly make the related currency become stronger. and vice versa, the bad numbers could not always instantly make the related currency become weaker. Before placing new position: We need to know which actuall

DoIt EA Monitor - Multi EA Performance Dashboard for MT5 Your account can be profitable while one EA quietly drags down the portfolio. MetaTrader history shows the combined result, but it does not clearly show which strategy deserves more capital and which one needs attention. DoIt EA Monitor runs on one chart and separates live and historical performance by magic number, EA and symbol. It is completely read-only. It never opens, closes or modifies a trade. KNOW WHICH EA IS EARNING ITS PLACE Aut
FREE

按价格设置止盈止损, 自动订单修改器
在任何交易上自动设置精确的止盈和止损价格水平 按价格设置止盈止损 LITE/GBPUSD 是 按价格设置止盈止损 的 免费有限版本 ,旨在通过 价格而非点数或基点 来管理 止盈和止损水平 。 兼容 MetaTrader 4 和 MetaTrader 5,在 Market 上作为独立产品出售。 此免费版本仅在 GBPUSD 上有效,让您零成本体验完整功能。
适用于所有货币对和EA,可按品种或魔术数字筛选 此智能交易系统允许您使用直接价格值(例如 EURUSD 上的 1.12345)为您的交易定义并应用精确的止盈(TP)和止损(SL)水平。无需点数,无需基点。在所有订单上或按图表或魔术数字筛选,实现干净、准确的交易管理。 主要功能: 按精确价格即时修改止盈和止损 应用于所有订单、当前品种或特定魔术数字 使用零值可移除交易中的止盈或止损 附加到任何图表后即可全自动运行 兼容所有交易品种 适用于: 需要快速控制止盈/止损的手动交易者 需要覆盖默认退出逻辑的EA用户 处理复杂头寸的多订单管理者 关键词: 按价格设置止盈止损 ,,,, 交易管理EA , 智
FREE

GoldKiller EA – Professional Expert Advisor for Gold Trading (XAUUSD) General Overview GoldKiller EA is an advanced Expert Advisor specifically designed for gold trading (XAUUSD) . It is not a simple grid robot, but a complete capital, risk, and profit management system , built to operate over the long term in an extremely volatile market. Unlike classic EAs focused purely on raw performance, GoldKiller prioritizes capital preservation , progressive profit protection , and strict risk control .
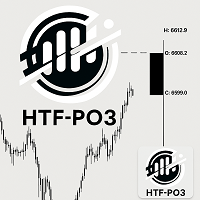
HTF Power of Three (ICT) - MT4 Indicator - Version 1.1 Overview The HTF Power of Three indicator is a professional implementation of the Inner Circle Trader's (ICT) Power of Three concept, inspired by Larry Williams. This indicator visualizes higher timeframe (HTF) candle development in real-time on any lower timeframe chart, making it an essential tool for ICT traders who study institutional price movement patterns. What is Power of Three (PO3)? Power of Three represents a three-staged Sma

This indicator shows the Daily Cycles for M30 and M15 and 90min Cycles for M5 and M1. You can adjust the QT Starting Line based on you broker and align it to New York Time. This will help you in identifying SSMT and AMDX easily.
You can couple this with ICT Time And Price Indicator.
Q1 (Accumulation) Q2 (Manipulation) Q3 (Distribution) Q4 (Continuation or Reversal)
FREE

该指标会实时扫描您的交易账户,分析已持仓单,并可选择是否计算挂单,然后通过数学方式计算出两个关键价格。 保本线(BE)
在该价格平仓后,您的总利润将正好为零。指标会计入手续费和库存费,避免您因为忽略交易成本而意外亏损平仓。 目标线(Target/TP)
价格需要达到该水平后,您才能获得指定金额的利润,例如正好 100 美元,或者获得账户余额的指定百分比,例如余额增长 2%。 两种计算模式,适合不同策略 您可以在设置中选择指标如何处理您的交易。 独立模式
非常适合对冲账户。指标会分别计算多单和空单。图表上会分别显示多单的保本线和目标线,以及空单的保本线和目标线。如果您双向交易或使用锁仓,非常适合该模式。 合并模式
非常适合净额结算账户以及锁仓交易。指标会将所有多单和空单合并计算,得出整体净头寸,并为该交易品种上的所有持仓显示一条统一的保本线和一条统一的目标线。 主要优势与功能 灵活的目标设置
您可以将目标利润设置为账户货币金额,例如 50 美元,也可以设置为当前余额的百分比,例如 1.5%。当余额变化时,指标会自动重新计算目标线。 精确计算
可选择是否计入库存费和手续费,使
FREE

One-Click Close All – Instantly Exit All Trades in MT4 Take control of your trades with One-Click Close All , a powerful MT4 script designed for fast market exits. With a simple drag-and-drop action, you can close all open orders instantly—no more manually closing trades one by one. Key Features: Instant Order Closure – Exit all open trades with a single click, perfect for volatile markets.
Drag & Drop Simplicity – No complex steps—just drop the script onto your chart to execute.
Essen
FREE

MA Assistant MT4 介绍 可视化趋势识别 – 通过平滑且多彩的图表区域,快速识别市场的多头和空头走势 MA 交叉提醒 – 当快慢均线发生交叉时,提供实时提醒 多周期 MA 热力图 – 在一个清晰的表格中分析不同周期的均线状态 MA 差值测量 – 每10根K线显示两条均线之间的差值,帮助衡量趋势强度和动量 专业版本可用 – 包含 16+ 交易策略 的高级工具可在 Strategy Assistant 立即体验 保持更新 – 加入我们的 MQL5 社区 频道 @hdtradinglab 获取最新更新和免费工具 观看 YouTube 视频: 请观看 YouTube 视频以获取有关 MA Assistant 的完整信息,并订阅我的频道以获取更多免费产品视频。 简短描述 :
MA Assistant 是一款强大且免费的交易工具,通过简洁直观的方式简化均线分析。它使用彩色区域突出显示 多头 和 空头 趋势,提供交叉提醒,并包含 多周期 MA 热力图 以提升决策能力。 独特功能是 MA 差值概念 ,可直接在图表上显示动量强度,帮助交易者快速
FREE

Product Name: MY DASHBOARD (v) – Smart Trading Panel for MT4 MY DASHBOARD is a professional-grade trading utility designed to streamline your MT4 workspace. It integrates essential portfolio data, risk metrics, and market insights into a single, clean interface—allowing you to focus on trading while the dashboard handles the calculations. Key Features Real-Time Market Info: Symbol Display: Clearly identifies the current trading instrument. Dynamic Spread Monitor: Visual alerts when spreads exce
FREE

适用于 MetaTrader 4 (MT4) 的 UZFX - 仅删除挂单脚本是一款简单而有效的工具,可自动删除交易账户中的所有挂单(限价买入、限价卖出、止损买入、止损卖出)。该脚本非常适合希望在不影响活跃市场头寸的情况下即时清除挂单的交易者。
查看我的所有其他 MT4/MT5 指标和 EA >> 这里
功能: 删除所有挂单(买入限价单、卖出限价单、买入止损单、卖出止损单)。 不影响未结市场头寸。 通过专家选项卡提供实时执行反馈。 帮助交易者快速重置挂单策略,无需手动干预。 使用方法: 将脚本附加到 MT5 图表。 脚本将自动扫描并删除所有挂单。 专家选项卡中将显示每个已删除订单的确认信息。 注意: 该脚本不会关闭有效交易,只会删除挂单。 运行脚本前,请确保您要删除所有挂单。 该脚本适用于账户中的所有交易符号,而不仅仅是所附图表。
FREE

XAUUSD Trading EA (MT5) Get access to our fully automated Expert Advisor designed for consistent performance. Free Trial Available
Try the EA before you commit. Live Performance
Check real results via MyFXBook (link available in our Telegram channel https://t.me/xgoldscalper – pinned message). How to Get the EA
The original MT5 EA file is shared via Telegram.
Contact directly: https://t.me/SaravananL Available Models
Choose what suits you best: Subscription (Buy EA acc
FREE

Magic Gold Grid v2.1.0 - Capital Preservation & Smart Recovery System for XAUUSD The Magic Gold Grid v2.1.0 is an algorithmic Expert Advisor (EA) designed specifically to master the volatility of Gold (XAUUSD) with an absolute focus on Capital Preservation . Instead of trying to guess tops and bottoms, this robot utilizes a directional architecture (Buy-Only) shielded by a Proprietary Trend Filter and a dynamic defense grid to manage the mathematics of the trades. Through its core Basket Recove
FREE

The " YK Find Support And Resistance " indicator is a technical analysis tool used to identify key support and resistance levels on a price chart. Its features and functions are as follows:
1. Displays support and resistance levels using arrow lines and colored bands, with resistance in red and support in green.
2. Can be adjusted to calculate and display results from a specified timeframe using the forced_tf variable. If set to 0, it will use the current timeframe of the chart.
3. Uses the
FREE

Time Range Separator is a useful tool to display a separator period on your platform. You could go in the properties of the indicator, select the desired range and that's ALL. We believe it is a useful and necessary that we wish to share with you for free all our followers.
Input Values: TimeFrame Period Separator GMT_Hour (ex. +1 or -1) to move the lines at Period Time +/- tot hours in input Hide_dates to show or hide the datetime on vertical lines VLine_Color = Vertical Color Line VLine_Style
FREE

Are you tired of drawing trendlines every time you're analyzing charts? Or perhaps you would like more consistency in your technical analysis. Then this is for you. This indicator will draw trend lines automatically when dropped on a chart. How it works Works similar to standard deviation channel found on mt4 and mt5. It has 2 parameters: 1. Starting Bar 2. Number of bars for calculation The starting bar is the bar which drawing of the trend lines will begin, while the number of bars for c
FREE

Lotsize Risk Reward automatically calculates the size of the position by moving the Pink horizontal line "StopLoss" drawn on the graph. The model is based on the position calculation can be defined in relation to lotsize Balance, heritage or outdoor range, you may also include credit account and deduct the losses assumed by all the Stop Loss. Additionally you can include in the chart the horizontal blue line "TakeProfit" and show the risk / benefit ratio. The ATR (Average True Range) indicator c
FREE

FREE for the First 50 Users
================================================================ ShowKillZones v1.0 - Corrected NY AM end time from 11 to 10, and NY PM end time from 17 to 16 (adjusted to Kill Zone hours) [cite: 321, 326] - Changed NY AM/PM labels to Kill Zone [cite: 321, 326]
v1.0 - User Manual [cite: 321] ================================================================
[Overview] This indicator displays ICT Kill Zones (session hours) on the chart as background zones an
FREE
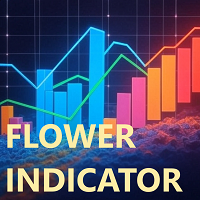
花形指标是一种技术分析工具,主要用于识别趋势并辅助剥头皮交易或日内交易策略。
花形指标是一种基于技术和价格动态分析的信号趋势指标。它使用彩色花朵直观地指示趋势——蓝色花朵表示上升趋势,红色花朵表示下降趋势。
每个水平线都可以充当支撑位和阻力位(注意图表上出现的+/- 200水平线和点)。
您可以将点设置为在突破超买/超卖静态水平线、伴随的波段、两者兼有或其中任何一者时出现。
该指标在识别吸筹/派发区域的同时,还能发现市场的潜在逆转。它兼容任何交易工具和时间框架,参数可根据需要调整。每个水平线都可以充当支撑位和阻力位。 花卉指標是一種技術分析工具,主要用於識別趨勢並協助剝頭皮交易或日內交易策略。
花指標是基於技術和價格動態分析的訊號趨勢指標。它使用彩色花朵直觀地表示趨勢——藍色花朵表示上升趨勢,而紅色花朵表示下降趨勢
每個等級都可以充當支撐和阻力(注意 +/- 200 等級和圖表上出現的點)
您可以將點設定為在突破超買/超賣靜態水平或伴隨的波段(兩者或其中任何一個)時出現。
此指標在識別累積/分佈區域的同時,也發現了市場的潛在逆轉。它與任何工具和時間範圍相容,參數可隨意
FREE
This is a mean reversion system as the name implies. EA performs best on Nasdaq and Dow Jones. The EA is a high frequency trading system and is not suitable for high spread accounts. The EA finds high probability zones and executes order blocks to quickly capture market edge. This is NOT a directional trading system. See: V1.2 backtest example: https://youtu.be/YkUcL6xMfBY
The concept, for those unfamiliar, is simple: price tends to revert back to normal levels after periods of price irregular
MetaTrader市场是您可以下载免费模拟自动交易,用历史数据进行测试和优化的唯一商店。
阅读应用程序的概述和其他客户的评论,直接下载程序到您的程序端并且在购买之前测试一个自动交易。只有在MetaTrader市场可以完全免费测试应用程序。
