 MetaTrader 5
 专家
专家
 指标
指标
 程序库
程序库
 实用工具
实用工具
 窗口小部件
窗口小部件
 规则
规则
适用于MetaTrader 4的EA交易和指标 - 17
 EA交易自动执行市场交易,而指标可使您更准确地分析报价并预测价格行为。
通过这些应用程序,您将能够更明智地在MetaTrader 4执行交易,抓住更多的交易机会。
EA交易自动执行市场交易,而指标可使您更准确地分析报价并预测价格行为。
通过这些应用程序,您将能够更明智地在MetaTrader 4执行交易,抓住更多的交易机会。 
'Fibonacci Dimension' indicator allows display of preset or user-defined multi-timeframe Fibonacci levels. It automatically takes the previous high and low for two user-defined timeframes and calculates their Fibonacci retracement levels. It also considers the retraced level to draw the expansions on every change of price. A complete visual dimension in multiple timeframes allows deriving profitable strategies for execution. Enhanced functionality to view and customize the default Fibonacci Rang
FREE

HTF PO3 Candles HTF PO3 Candles projects Higher-Timeframe candles directly onto your current chart, so you can read the Power-of-Three (PO3) structure of two superior timeframes without switching charts. By default it overlays H1 and H4 candles (up to 4 each) beside the live price, complete with High/Low and Equilibrium (EQ) projection lines — a clean visual map of where higher-timeframe accumulation, manipulation, and distribution are forming. Key features Two selectable higher timeframes (defa
FREE
Brilliant Reversals MultiCurrency Scanner MT4 是一款先进的交易指标,旨在帮助交易者识别多个货币对的潜在反转点。通过利用先进的算法,该工具提供即时洞察,使其对希望优化交易策略的新手和经验丰富的交易者来说都极为重要。 该指标通过根据市场条件提供实时买卖信号,增强了决策能力并改善了交易表现。凭借其全面的仪表板和警报功能,您可以轻松监控关键货币对,并迅速把握市场机会。 MQL产品安装指南 | 在 MT4/MT5 上更新已购买的MQL产品 | 常见故障排除指南 | 指标设置/指南 主要特点 缓冲区集成:将指标值暴露为可访问的缓冲区,使 Expert Advisor 能够有效利用基于信号的交易。 可视化箭头信号:在您的图表上清晰地显示 BUY/SELL 箭头,便于发现交易机会。 快速且可回测:基于 MetaTrader 的原生 OnCalculate() 引擎构建,确保快速计算并与策略测试器完全兼容。 弹出警报:在信号事件时触发警报弹窗,确保您不会错过潜在的交易设置。 推送通知:向您的 MetaTrader 移动应用发送实时推送通知,让您随时了解市场动

产品简介 Dynamic Fibonacci Deviation 是一款专为 MT4 和 MT5 双平台设计的自适应斐波那契水平线主图指标。它创新性地将 EMA 动态中线、标准差波动率与斐波那契比例相结合,构建出能够随市场波动自动伸缩的智能支撑阻力系统。该指标通过超买超卖识别与回落反弹信号,帮助交易者在均值回归行情中精准捕捉高概率的买卖时机,并提供完善的实时状态监控与多通道信号提醒。 核心功能 自适应斐波那契通道与 K 线染色 系统以 EMA 作为动态中线,结合标准差计算当前市场的波动幅度,并通过 EMA 平滑后的最大偏离倍数动态调整斐波那契比例。通道上下各绘制 6 条水平线,涵盖 0.191、0.5、0.75、1.0、1.382、1.618 等经典斐波那契比例,颜色从绿色(低位)渐变到紫色(高位),让价格所处的波动区间一目了然。图表右侧会实时显示当前的 中线价格 和 标准差数值 。 MT5 版本额外支持趋势 K 线染色功能 ,让超买超卖状态通过颜色变化更加直观。 做多信号 Oversold (超卖) :当价格收盘价跌破下轨第 4 水平线 (Dn4, 1.0
FREE

Algo Shadow Matrix 是一款适用于 MetaTrader 4 的 不重绘自适应趋势指标 ,专门用来解决传统 Supertrend 最大的弱点——通道宽度固定:在震荡中被来回“洗”,在顺滑趋势中又明显滞后。Algo Shadow Matrix 并不是使用静态的 ATR 倍数,而是每一根已确认的 K 线都会计算一个连续的 趋势质量指数(TQI) (0–1 之间),该指数由四个独立因子加权而成。随后,指标利用这个指数以非线性的方式调节通道宽度,非对称地收紧当前趋势方向的跟踪止损一侧、放宽反向一侧,并在趋势“性格”崩坏时提前切换多空状态。换句话说,指标能够“自我感知”——它知道自己看到的是干净的单边走势还是纯粹噪音,并据此做出不同反应。 在 TQI 引擎之上,还叠加了一个 6 因素共振评分模块(0–102 分,并在图表上用 1–5 颗星显示)、带有三种计算模式的自动止损(ATR + 枢轴点、纯 ATR、最近摆动高低点)、三个可配置的 R 倍数止盈目标(默认 1R / 2R / 3R)、一个记录最近 100 笔交易的滚动绩效缓冲,以及一个 3×3 的“(ER, Volum

https://t.me/GoldRingM1 Get the expert for free Download Upgrade Expert on Telegram channel Request the special strategy from the Telegram channel admin Training videos for working with Expert and professional upgrades and templates are all available on the Telegram channel. This expert uses 5 separate indicators to find the entry point Along with it, it uses several capital management systems, position management and exit management The version available on the site is the limited version of
FREE

The Supertrend indicator available on the MQL5 Market for MetaTrader 4 is an exceptional tool for traders seeking to identify prevailing trends in specific trading instruments. This indicator boasts two built-in indicators, Average True Range and Standard Deviation, allowing traders to choose the most suitable indicator based on their preferred trading strategy. Additionally, users can customize the period of these indicators and select the price (Close, High, Low, Open, Weighted) to which it s
FREE

BitDooZER is an Expert Advisor designed primarily to trade Bitcoin vs US Dollar on the M1 timeframe, and only on the weekends. BitDooZER is, above all, DooZER 's little brother, and behaves in a similar way, even though all internal parameters are adjusted keeping in mind the volatility, spread and price behavior of the BTCUSD symbol. BitDooZER also follows an averaging strategy with initial entry based on price action. If you want to know more about the strategy you can read all articles relat
FREE

DrawDown Limiter v5.0 — 高级账户保护控制器 DrawDown Limiter v5.0 是一款运行于客户端的交易账户保护控制器,用于监控您的交易账户,并在达到您所设定的风险、盈利、新闻、时间计划、Rollover 或持仓数量限制时自动采取相应措施。 它可以通过一个独立图表监控 手动交易、自动化策略、多个 EA、挂单以及浮动持仓 。它既可以保护整个交易账户,也可以通过 Magic Number 仅监控特定 EA 或一组 EA。 DrawDown Limiter 的目的不仅仅是显示回撤,而是 主动执行您设定的交易规则 ,并在保护条件保持有效期间持续执行这些规则。 DrawDown Limiter v5.0 不仅用于监控您的亏损程度,还用于控制策略何时可以继续运行、哪些风险敞口可以保留、何时必须停止交易,以及自动化交易环境何时可以安全恢复运行。 需要帮助或有任何问题? 请查看 DrawDown Limiter 用户指南 我是 Lio ,欢迎随时联系我! 我们始终愿意为您解答问题、提供帮助并持续改进产品。
统一的保护系统 DrawDown Limiter v

Binary Options Support Resistance Indicator This indicator is designed for binary options trading and effectively shows retracements from support and resistance levels. Signals appear on the current candle. A red arrow pointing downwards indicates a potential selling opportunity, while a blue arrow pointing upwards suggests buying opportunities. All that needs adjustment is the color of the signal arrows. It is recommended to use it on the M1-M5 timeframes as signals are frequent on these timef

Представляю новый индикатор — Profit Reaper! Это чистый Price Action, усиленный алгоритмом. Как он это делает? Мощный сканер Engulf-паттернов: Сканирует рынок 24/7 в поиске сильнейших паттернов "Поглощение". Фильтр RSI | инд. стабильности: Отсеивает слабые сигналы с помощью RSI и фильтра стабильности. ️ TP/SL на основе ATR: Мгновенно определяет оптимальные TP и SL на основе ATR. ️ Мгновенные алерты на сигналы Основа — паттерн "Поглощение": Индикатор находит классические бычьи и
FREE
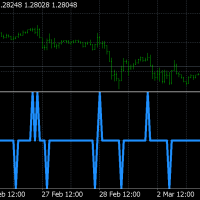
Pulse Scalping Line - an indicator for identifying potential pivot points. Based on this indicator, you can build an effective Martingale system. According to our statistics, the indicator gives a maximum of 4 erroneous pivot points in a series. On average, these are 2 pivot points. That is, the indicator shows a reversal, it is erroneous. This means that the second signal of the indicator will be highly accurate. Based on this information, you can build a trading system based on the Martingale
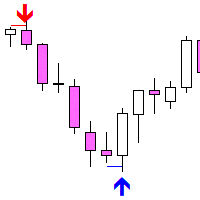
Fakey Detector — 假突破(Fakey)形态指标 Fakey Detector 是一个可以自动识别经典 Fakey(内部K线的假突破)形态的指标,并在图表上用箭头和突破水平线进行显示。 工作原理: Fakey 模式由三根K线组成: 母K线(Mother Bar) — 区间最大的K线 内部K线(Inside Bar) — 完全包含在母K线的范围内 Fakey K线 — 向上或向下突破,但又收盘回到范围之内 当满足设定条件时(包括可选的实体方向过滤器),指标会显示: 向下箭头 — 表示 Fakey Sell 信号 向上箭头 — 表示 Fakey Buy 信号 突破线 — 显示关键突破水平 ️ 参数设置: LookBackBars — 分析的K线数量 MinBreakoutPips — 最小假突破深度(点) UseBodyDirectionFilter — 启用对 Fakey 和 Inside K线实体方向的过滤 UseMotherBarBreakout — true 表示从母K线判断突破, false 表示从内部K线判断 特点: 不重绘 适用
FREE

G2 SMC SYSTEM INDICATOR by Ida Bagus Putu Mahardika PROFESSIONAL SMART MONEY CONCEPTS (SMC) INDICATOR G2 SMC System Indicator is a comprehensive Smart Money Concepts trading tool that reveals institutional footprints in real-time. Designed for traders who want to think and trade like the professionals, this indicator combines multi-timeframe analysis, SMC principles, and advanced filters to deliver high-probability entry signals directly on your chart. KEY ADVANTAGES 1. INSTITUTIONAL FOOTPR
FREE

斐波那契专业警报指标 通过精确的回撤警报提升您的交易表现 这款先进的指标通过检测您在图表上绘制的任何斐波那契回撤工具上的精确价格交叉,实现关键水平的自动化监控。专为使用黄金比例交易的苛刻交易者设计,它确保您在可能的反转或延续区域不会再错过入场机会,并将即时通知直接发送到您的终端、手机或电子邮件。
参数指南(输入菜单) Activate(激活):快速开启或关闭指标的监控功能,无需从图表中移除指标。 BarCross(K线交叉):定义价格交叉的确认标准。您可以将其设置为在当前蜡烛实时移动期间发出警报,或要求仅在蜡烛收盘时发出警报(适用于确认最终突破或拒绝)。 Fibonacci Levels for Alert(斐波那契警报水平):允许自定义您希望同时监控的精确百分比水平。默认包含 0.382、0.5、0.618 和 1.0 等机构比例,可根据您的交易策略进行修改,书写时需用逗号分隔且不带空格。 SendAlert(发送警报):在交易终端内启用经典的弹出窗口及声音提示。 Sendmail(发送邮件):激活向您平台绑定的电子邮箱发送详细确认信息。 Sendpush(发送推送):激活 Me
FREE

Risk manager
Risk manager - it will simplify the tracking of drawdown and will notify you (alert) when the specified risk is reached, and close/lock orders when the critical DD risk level is reached.
If the specified drawdown is exceeded, you can choose two options for actions: All orders will be closed that mean loss will be fixed on depo. The terminal also closes. Instead of fixing the loss on depo, the opposite order will be opened - orders locking will occure. Not a single order will be c

Pivot Point Shift Supertrend 指标是用于 MetaTrader 4 的 无重绘 跟踪型 Supertrend 系统。与将带宽锚定在动态 hl2 中点的经典 SuperTrend 不同,本指标将带宽锚定在“已确认枢轴点”的加权平均价上。这样得到的一条跟踪线在正常波动中保持稳定,只在市场结构真正发生变化时才翻转。 该指标使用可配置的回溯周期(默认:左右各 2 根 K 线)检测枢轴高点和枢轴低点,按 2:1 加权公式更新一条平滑的中心线,然后在该中心线之上与之下放置 ATR 倍数通道,并应用标准 SuperTrend 跟踪规则生成一条具有方向性的 supertrend 线。趋势翻转时,会在图表上以文字标签形式给出 Buy / Sell 信号,同时通过弹窗、声音、推送通知或电子邮件发出提醒。 MT5 版本地址: Pivot Point Shift Supertrend MT5 更多产品请见: 所有产 品 如需查看真实账户示例和最新工具,请访问我的个人主页并发送好友请求,以免错过更新!
工作原理 枢轴识别。 当第 N 根 K 线的最高价高于其左右各 Pivot
FREE

SNIPER INVICTUS: GOLD PULSE – Professional XAUUSD Algorithm Turn Market Volatility into Profit with the Hybrid Mirror System. SNIPER INVICTUS is not just a simple grid EA; it is a high-performance trading engine designed specifically for XAUUSD (Gold). Developed by NAIL FX Trading, this system bridges the gap between precision trend-following and smart recovery logic. EA has added new features with the latest update, including limit and stop order features, and a B-plan feature within the mirro
FREE

BlueDigitsFx 官方生态系统入口 此免费工具是 BlueDigitsFx 交易基础设施生态系统的一部分。 通过 BlueDigitsFx 官方机器人获取更新、工作流程资源、产品发布信息以及官方生态系统访问权限。 Telegram 生态系统
官方网站
MT5 版本
BlueDigitsFx Open Trades MT4 —— 用于主动交易管理的实时点数监控工具 BlueDigitsFx Open Trades 是一款免费的 MT4 工具,可直接在图表上实时显示所有未平仓交易的总点数结果。 该工具采用清晰的颜色编码显示方式,帮助交易者快速识别盈利和亏损仓位,并监控多个活跃交易及货币对的整体表现。 它专为希望获得更清晰交易视图、更快速仓位监控以及无需频繁切换多个窗口即可管理交易会话的交易者而设计。 通过在图表上持续显示未平仓交易的整体表现,交易者无需频繁打开 MetaTrader 终端窗口即可更快做出反应。
主要功能 实时点数显示 —— 直接在图表上监控所有未平仓交易的总点数结果。 颜色编码交易概览 —— 快速识别正收益和负收益交易表现。 多交易监控 —— 适用于同时
FREE
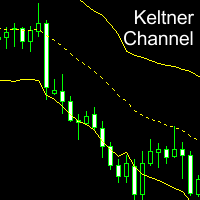
Keltner Channel is a well known indicator that not in MT4's indicators default lineup (You can get this from your broker somehow). This indicator helps you to define trend and sometimes overbought/oversold prices during flat trend. Input Description: EMAperiod: Moving Average period used for indicator. Must be higher than 1. ATRperiod: Average True Range period used for indicator. Must be higher than 1. multiplier: Multiplier used for determine channel's wide. Must be higher than 0 but may not b
FREE
Fractals Dynamic Fractals Dynamic – 是 Bill Williams 改進的免費分形指標,您可以在其中手動設定左側和右側的柱形數量,從而在圖表上建立獨特的模式。 现在所有基于或基于分形动态指标的交易策略都将有一个额外的信号。
此外,分形可以充当支撑位和阻力位。 在一些交易策略中,显示流动性水平。 为此,在这个版本的多分形和多帧指标 MultiFractal Levels 中引入了水平。 您会发现这个指标在任何价格图表上作为您交易的助手更具信息性,视觉性和实用性。 使用分形動態指標作為您交易系統的補充 也試試我在市面上的其他產品 https://www.mql5.com/ru/users/capitalplus/seller
如果您喜欢该指标,请对其进行评分并留下评论,这对我来说非常重要!
交易獲利豐厚!
FREE

Opening Range Breakout EA is a focused trading robot that automates one of the most effective intraday strategies: trading the session breakout. It operates by observing the market during its initial, quiet phase to establish the opening range. Once that range is defined, the EA is ready to enter a trade the moment price action confirms a breakout, helping you ride the volatility that follows.
The Trading Idea The core of this strategy is simple: many of the day's biggest moves begin when the
FREE

Kumo Forge Pro 是一款适用于 MetaTrader 4 的非重绘自适应一目均衡表交易系统。它远超标准一目均衡表指标,新增了自适应波动率引擎(可根据实时市场状况自动缩放转换线、基准线和先行跨度 B 的周期)、0–110 分的 9 因子共振评分引擎、五种独立信号类型(TK 交叉、基准线反弹、云层边缘反弹、迟行线突破和云层突破)、动量脉冲引擎、具有三种止损模式和三个止盈级别的智能 TP/SL 系统,以及包含多时间周期对齐面板的 22–28 行综合大盘。每个信号仅在确认的 K 线收盘时触发,不会重绘。 查看 MT5 版本: Kumo Forge Pro MT5 查看更多产品: 全部产 品 欢迎访问我的主页查看实时示例和新工具,并发送好友申请,第一时间获取更新!
工作原理 自适应一目均衡表引擎 核心引擎通过可配置的回望窗口(默认:50 根 K 线)测量 ATR(14) 相对于其最高值和最低值,生成 0.0 至 1.0 的波动率比率。每个一目均衡表周期——转换线(9)、基准线(26)和先行跨度 B(52)——根据该比率和自适应强度参数(默认:0.4,即周期可拉伸 ±40%)进
FREE
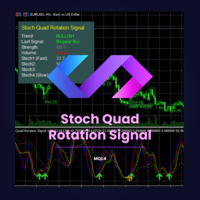
Stoch Quad Rotation Signal MT4 The Stoch Quad Rotation Signal is an advanced technical indicator for MetaTrader 4 that integrates multiple Stochastic oscillators with powerful trend, volume, and pattern filters, along with a scoring system and multi-timeframe analysis. Designed to identify high-probability trading opportunities with clarity and precision. Main Features: Quadruple Stochastic Analysis: Utilizes four distinct configurations of the Stochastic oscillator (with customizable K, D, and

================================================================ DispTrade_en.mq4 User Manual ================================================================
OVERVIEW -------- Displays trade history and open positions visually on the MT4 chart using arrows and connecting lines.
WHAT IT SHOWS ------------- - BUY Entry Arrow : Entry point for BUY orders (blue) - SELL Entry Arrow : Entry point for SELL orders (red) - Exit Arrow : Close point for historical trades (goldenrod) - Dott
FREE

SMT (Smart Money Technique) Divergence refers to the price divergence between correlated assets or their relationship to inversely correlated assets. By analyzing SMT Divergence, traders can gain insights into the market's institutional structure and identify whether smart money is accumulating or distributing assets. Every price fluctuation should be confirmed by market symmetry, and any price asymmetry indicates an SMT Divergence, suggesting a potential trend reversal. MT5 Version - https:/

Alpha Trend sign
Alpha Trend sign 是我么长期以来非常受欢迎的交易工具,它可以验证我们的交易系统,并且明确的提示交易信号,并且信号不会漂移。 主要功能: • 根据市场显示活跃区域,根据指标可以很直观的判断当前行情是属于趋势行情,还是震荡行情。 并根据指标的指示箭头切入市场,绿色箭头提示买入,红色箭头提示卖出。
• 建议使用5分钟以上的时间周期进行交易,避免因为小周期波动出现频繁的交易信号。
• 您也可以开启信号提示,以免错过最佳的交易时机。
• 本指标不但可以很好的预测趋势行情,也可以在宽幅震荡行情中获利。
• 本指标本着大道至简的原则,适合不同阶段的交易者使用。 注意事项: • Alpha Trend sign 有明确的进出场信号,不建议逆势操作,以免造成损失。 • Alpha Trend sign 是特别成熟的指标,我们团队人手一个,使用它可以实现稳定盈利。

NAD RSI Cross A simple RSI-based indicator that provides clear BUY and SELL signals directly on the chart. How It Works BUY — RSI 14 crosses above 30 after the candle closes. SELL — RSI 14 crosses below 70 after the candle closes. Features RSI 14 BUY level: 30 SELL level: 70 Closed-candle confirmation Clean chart with simple arrows Suitable for XAUUSD M1 Can also be used on other instruments and timeframes SL & TP Set your own SL and TP according to your trading strategy and risk managemen
FREE

Channel Scalper Pro 指标是一种基于价格通道和信号箭头的高效市场分析工具。该指标专为 MetaTrader 4 (MT4) 平台设计。它结合了通道和可视信号,以提供相当准确的市场进出点。下面是该指标的详细描述、功能和使用策略。 技术描述 通道: 指标所显示的通道展示了价格范围的上下边界。这些边界帮助交易者确定支撑和阻力水平。 通道的上边界用蓝色表示,代表阻力水平,价格通常不会超过该水平。 通道的下边界用红色表示,代表支撑水平,价格通常不会跌破该水平。 信号箭头: 指标还包括信号箭头,指示市场的潜在进入点。 向下的红色箭头表示可能的卖出信号(空头头寸),表明价格已达到通道上边界,并可能出现向下的反转。 向上的蓝色箭头表示可能的买入信号(多头头寸),表明价格已达到通道下边界,并可能出现向上的反转。 优势和信号准确性 Channel Scalper Pro 指标为交易者提供了几个关键优势: 信号准确性: 箭头是基于对价格数据和通道的综合分析生成的,从而提供更准确的进出信号。 可视化: 明亮的箭头和清晰标记的通道使指标的使用直观且方便。 适应性: 该指标适用于各种时间框架和金
FREE
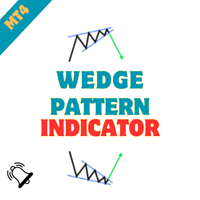
发现 "Wedge Pattern MT4" 的潜力,这是一种专为 MetaTrader 4 设计的创新指标。这个工具使各级交易者能够轻松识别市场走势中的楔形模式,从而增强决策和交易策略。 凭借其先进的模式识别能力,Wedge Pattern MT4 提供及时的见解,可以带来盈利的交易机会。无论您是想识别趋势反转还是延续,这个指标对于任何认真对待当今动态市场的交易者来说都是必不可少的。 MQL 产品安装指南 | 在 MT4/MT5 上更新已购买的 MQL 产品 | 常见故障排除指南 | 指标设置 / 指南 主要特点 缓冲区集成:将指标值暴露为可访问的缓冲区,使 Expert Advisor 能够有效利用基于信号的交易。 可视化箭头信号:在信号蜡烛上直接在图表上显示清晰的买入/卖出箭头,便于视觉阅读。 快速且可回测:基于 MetaTrader 的本地 OnCalculate() 引擎构建,确保极快的计算速度,并与策略测试器完全兼容以进行历史回测。 弹出警报:在信号事件上发送弹出警报,确保您不会错过任何交易设置。 推送通知:实时推送通知到您的 MetaTrader 移动应用,方便随时监控。
FREE

Trendline EA MT4 Trendline EA MT4 是一款适用于 MetaTrader 4 的半自动化智能交易系统(Expert Advisor),旨在根据用户绘制的趋势线执行交易操作或发送提醒。 MetaTrader 4 本身并未提供直接基于趋势线进行下单或管理交易的原生功能。该智能交易系统通过监控用户定义的趋势线,并在价格与其发生交互时执行预设动作,从而扩展了平台的标准功能。 该智能交易系统不会定义或应用任何交易策略。所有交易逻辑和决策完全由用户掌控。 补充资料 用户手册与文档 MT5 版本 功能概览 基于趋势线的交易执行 当价格触及、突破或回撤趋势线时执行买入或卖出操作 为每条趋势线配置止损、止盈和交易手数 基于K线收盘价或与趋势线的价格距离触发动作 监控与提醒 在趋势线触及、突破、回撤或假突破时生成提醒 支持弹窗、电子邮件、推送通知和声音提醒 可选:当价格到达退出趋势线时自动平仓 用户主导分析 智能交易系统不会绘制、修改或重新定位趋势线 所有图表分析保持不变,并完全由用户控制 基本使用方法 将智能交易系统附加到图表 使用标准 MetaTrader 工具绘制趋势线
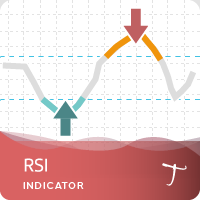
Tipu RSI Features 28 symbols, multi-time frame powerful Dashboard for the full market view Customizable Buy/Sell alerts, push alerts, email alerts, and visual on-screen alerts. Marked overbought and oversold levels. Three colors RSI that marks the normal, oversold and overbought levels. The relative strength index (RSI) is an oscillator devised by J. Welles Wilder in his famous book New Concepts in Technical Trading Systems in 1978.1 He also introduced Parabolic SAR (see Tipu Parabollic SAR Pane
FREE

Easy and Smart Trade Manager. It does work on visual strategy tester. Take your trading to the next level with it. Backtest you ideas and indicators. Improve it and run it live. This assistant has everything you need to do that. MT5 version
Basic features: Works with any FX, Crypto, Indices, Futures etc Several volume calculations methods, included risk calculation based on StopLoss level Several BreakEven modes Time close, timeout close and orders expiration Cancel pending orders level (OCO) R
FREE

PositionClose|MT4一键平仓脚本 PositionClose 是一款适用于 MetaTrader 4 (MT4) 的实用脚本,帮助交易者高效管理持仓。只需一键即可立即平掉所有持仓,也可以选择只平多单或只平空单。在行情剧烈波动、重大数据发布等需要快速降低风险或调整头寸的场合,这一工具尤为实用。无论是手动交易还是EA自动交易,甚至用于模拟账户的回测和仓位管理,PositionClose 都能带来便利。 主要功能 一键全部平仓
无论持有多少品种和订单,都可一键立即全部平仓。 可单独平多单或空单
可选择只平多单或只平空单,方便对冲或策略调整。 双重确认对话框,防止误操作
执行前会弹出两次确认提示,有效防止误平所有持仓的情况。 详细错误日志输出
若平仓过程中出现错误,会在“专家”标签页详细记录错误信息和代码,便于排查。 最多允许3个点的滑点
平仓时自动允许最多3点滑点,有效降低滑价或成交延迟风险。 使用方法 在MT4导航器中,将PositionClose脚本拖放到任意图表上。 弹出的对话框中选择“全部平仓”、“只平多单”或“只平空单”。 会再次弹出确认提示,核对后点击“是
FREE

SimpleGridBot – 透明的网格交易,支持买卖分开设置、篮子平仓和 RSI 逻辑 一款你可以完全理解并掌控的网格 EA。没有黑箱:间距、手数和平仓方式都由你设定,EA 严格按设置执行,没有隐藏逻辑。 主要特点 买入和卖出分开设置: 每一侧的间距、初始手数和止盈都可以独立设置。 篮子止盈并自动重启: 当前网格周期达到你的盈利目标时,全部平仓,然后自动开启新网格,或停止 EA,由你选择。 由 RSI 决定每一侧何时可以交易: 入场过滤、平掉一侧的出场,以及“armed until exit”模式,使一侧保持激活,直到 RSI 出场将其平仓。 工作原理 买入网格:价格每跌破最低持仓买单一个买入间距,就开一张新的买单。 卖出网格:价格每涨过最高持仓卖单一个卖出间距,就开一张新的卖单。 每个持仓都有自己的止盈。止损和每侧最大订单数为可选项。 持仓平仓后,价格再次到达该价位时,该价位即可重新交易。 快速上手 在模拟账户的一个图表上加载 EA(对冲账户,开启自动交易)。 根据品种和账户规模选择网格间距和手数。 可选:设置篮子止盈,在达到目标时锁定整个网格周期的盈利。 可选:启用 RSI 过

Meet GridSense Pro — the Expert Advisor designed for traders who want the market working for them 24/7 without waiting for signals . Unlike many EAs that depend on rare entry conditions, GridSense Pro actively searches for opportunities on its own . Using a smart comparison system based on RSI behavior , the EA continuously analyzes the market and detects its own trading signals automatically . No signal hunting. No complicated timing.
Just attach the EA and let the algorithm do the thinking. A
FREE

ToggleTrueClose — The familiar MT4 line chart, just better. ToggleTrueClose is a free MT4 indicator for traders who want a clear view of where candles actually closed. It connects the closing prices of completed candles and marks each close with a distinct dot. The result is a simple, readable chart that makes individual closing prices easier to follow. Only completed candles. The current, unfinished candle is excluded. The line ends at the latest confirmed close and extends when another candle
FREE

这是免费产品,欢迎您使用以满足您的需求! 如果您喜欢这个指标,请留下简短的好评!非常感谢! .................................................... 点击这里查看高质量的交易机器人和指标! Crypto_Forex MT4 版“资金流量指数 (MFI) 带警报”指标,无需重绘。 - 资金流量指数 (MFI) 是一种技术震荡指标,它利用价格和成交量数据来识别超卖和超买区域。 - 内置电脑和移动设备警报,适用于:进入超卖/超买区域以及退出超卖/超买区域。 - 警报触发点可调整。 - MFI 震荡指标提供有关看涨和看跌价格动能的信息。 - 当 MFI 高于 80 时,建议在超买区域卖出;当 MFI 低于 20 时,建议在超卖区域买入。 - MFI 非常适合用于背离检测,也非常适合与价格行为结合使用。 - 指标适用于任何时间范围。 这是仅在 MQL5 网站上提供的原创产品。
FREE

Flow Anchor 指标是一款适用于 MetaTrader 4 的非重绘趋势引擎。它将相对动量指数(RMI——由标准 14 周期收盘价 RSI 与 14 周期典型价 MFI 的平均值构成)、区间加权移动平均线以及基于 ATR 的自适应波动带结合在一起。最终形成一条单一的彩色“锚定线”,用于跟踪主导趋势:在多头阶段位于价格下方,在空头阶段位于价格上方,并且从不会穿过 K 线实体。状态切换时,会在图表上绘制 BUY 或 SELL 箭头,并可选通过最多四种通知渠道推送提醒。
查看 MT5 版本: Flow Anchor MT5 查看更多产品: 所有产 品 想查看实盘示例和新工具,请访问我的个人主页并发送好友请求,以免错过任何更新! 工作原理 混合动量指数(RMI) RMI 是两个经典振荡指标的算术平均:一个是基于收盘价的标准 14 周期 RSI,另一个是基于典型价 (high+low+close)/3 的 14 周期资金流量指数 MFI。RSI 捕捉的是纯价格动量,MFI 则用成交量对动量进行加权。将两者取平均,就得到一个同时对价格速度和市场参与度敏感的混合指数:放量上涨的行情会
FREE
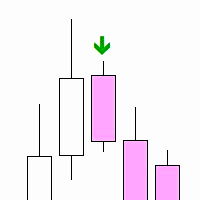
"Inside Bar PA" is a technical indicator designed to determine the inner bars on the chart. An internal bar is a bar or candle, the maximum and minimum of which are completely contained in the previous bar. This may signal a potential reversal or continuation of the trend, depending on the context.
Features: Automatic detection of internal bars. Visual marking of internal bars with arrows on the chart. The ability to adjust the distance of the mark from the bar. How to use: Attach the indicato
FREE

Market Profile 3 MetaTrader 4 indicator — is a classic Market Profile implementation that can show the price density over time, outlining the most important price levels, value area, and control value of a given trading session. This indicator can be attached to timeframes between M1 and D1 and will show the Market Profile for daily, weekly, monthly, or even intraday sessions. Lower timeframes offer higher precision. Higher timeframes are recommended for better visibility. It is also possible t
FREE

DeThrust StatsMood — Impulse Exhaustion Detector for D1 DeThrust StatsMood is a MetaTrader 4 indicator optimized for the Daily (D1) timeframe, designed to identify potential exhaustion points following exceptionally strong directional moves in the Forex market. How it works The indicator detects when price experiences a statistically abnormal acceleration compared to the symbol’s historical behavior and signals the potential exhaustion of that impulse. This is not a conventional trend reversal i
FREE

BlueDigitsFx 官方生态系统入口 获取基础设施更新、交易资源、产品发布信息以及 BlueDigitsFx 官方生态系统访问权限。 Telegram 生态系统
官方网站
MT5 版本
BlueDigitsFx OBV Divergence MT4 —— 用于识别市场反转的成交量背离指标 BlueDigitsFx OBV Divergence 是一款 MT4 指标,用于识别价格走势与 On-Balance Volume(OBV)指标之间的看涨和看跌背离。 通过比较价格走势与成交量行为,该指标能够帮助交易者识别潜在的趋势衰竭、市场反转以及动量变化等情况。 指标会直接在图表上标示背离形态,帮助交易者结合成交量确认,更深入地分析市场结构。
主要功能 自动背离检测 —— 自动识别图表中的 OBV 看涨和看跌背离。 成交量与价格对比 —— 比较价格走势与 On-Balance Volume 指标行为。 多时间框架兼容 —— 支持 MT4 所有时间周期。 可自定义提醒 —— 支持弹窗、电子邮件和推送通知提醒。 清晰的可视化信号 —— 背离区域直接显示在图表上,便于分析。 轻量级 M

Pinpoint 是一个高效的交易指标,专为准确的 XAUUSD 买入和卖出信号而设计。 该指标的工作原理没有重绘和没有延迟。 该指标专为在快速变化的市场中实时想要快速,准确和可视化解决方案的交易者而设计。 该指标可作为现成的交易策略。 它根据内置算法分析价格行为,并确定理想的切入点,以及显示未来利润可以记录的位置。
为了更准确地识别潜在的变化,该指标有一个内置的智能趋势线工具,可以根据当前的市场条件动态调整。 根据标准线路设置: 绿色购买倡议。 红色是卖出的主动权. 橙色—有可能拦截以前的倡议。
Pinpoint mt5
Pinpoint Blog
Pinpoint 包含多种过滤器,可帮助减少误报并提高输入质量。 默认配置针对 TF m15、m30和1H的XAU/USD在5年时间段内进行了优化。 因此,为更稳定和一致的交易选择了最佳设置,并根据每个时间帧的标准自动设置。 但是,有些设置单独显示在指标菜单中,在那里它们可以保持自动或根据当前市场情况自行更改并选择。
该指标提供清晰直观的买入和卖出信号。 它们由箭头和颜色表示。 橙色信号,在任何方向,意味着风险增加。 这意味着最

Trading XAUUSD is a double-edged sword. Its massive volatility offers incredible profit potential, but it also carries significant risk for those without a disciplined strategy. Today, I am excited to introduce my latest automated trading system: B Clode . Built specifically for the XAUUSD H1 timeframe , B Clode was engineered to harmonize high-frequency grid trading with intelligent risk management.
1. Why B Clode for XAUUSD? Gold is notorious for its "noise." By focusing on the H1 timeframe
FREE

MetaTrader 4 批量操作面板 批量操作面板是一款适用于 MetaTrader 4 的实用交易工具,专为帮助交易者在一个整洁的面板中管理多个持仓而设计。它将批量交易管理,快速执行,移动止损控制,对冲开仓,实时统计以及紧凑的最小化功能结合在一个简单直观的界面中,强调速度与便利性。 本产品适合希望更快速管理持仓和挂单的交易者,无需再手动逐一处理每一笔交易。在市场活跃,行情变化快速的环境中,这款面板尤其有用,因为此时快速决策和顺畅执行非常重要。 主要用途 这款面板的主要目标是简化批量交易操作。您可以直接在图表上通过一个面板完成开仓,对冲持仓,关闭指定类型的交易,删除挂单,以及管理移动止损设置。 主要功能 支持批量关闭全部持仓,盈利持仓,亏损持仓,买入持仓以及卖出持仓 支持快速删除全部挂单,便于更高效地清理订单 支持从面板直接手动开立买单和卖单 支持对冲功能,可同时开立买单和卖单 内置移动止损管理,支持自定义启动值,步进值和距离值 支持直接在图表上开启或关闭移动止损 实时持仓统计,显示总交易数,买入数量,卖出数量,挂单数量,盈利持仓数量,亏损持仓数量,总盈亏,买入盈亏和卖出盈亏 支持
FREE

QCL Adaptive Band Oscillator — MetaTrader 4 A smooth 0–100 oscillator with adaptive reference bands for a clearer view of price momentum. QCL Adaptive Band Oscillator combines smoothed price calculations with dynamic upper and lower bands. Displayed in a separate indicator window, it helps you examine momentum swings, potential turning points, and divergences between price and the oscillator. A smooth transformation keeps the oscillator and both bands within the 0–100 range , with a center refer
FREE
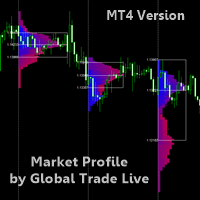
READ THE DESCRIPTION ITS IMPORTANT - ONLY TAKES 2 MINUTES - THIS IS A TOOL NOT A TRADING STRATEGY
Market Profile By Global Trade Live A Market Profile is a graphical representation that combines price and time information in the form of a distribution. A Market Profile is used to determine elapsed time, number of ticks and volumes traded at specific prices, or over a price interval, over a given period. A Market Profile also makes it possible to identify prices accepted or rejected by the mark
FREE

Торговый робот предназначен для торговли криптовалютой по уровням Фибоначчи на рынке Форекс. Безопасность в торговле: постоянный стоплосс, тейкпрофит, защита от повышенного спреда, а лгоритм не использует опасные методы торговли - мартингейл, сетку и усреднение . Достоинством советника является торговля Мани Менеджмент (система управления капиталом) автоматический расчет лота на основе размера вашего депозита, автоматическая установка и перемещение уровней Фибоначчи. Установка отложенных ордеров
FREE

Super trend is one of the best trend indicators in metatrader 4 (MT4). Triple SuperTrend indicator is an indicator that consist of three super trend indicator that can be aranged. This indicator is built by mql4 language and doesn't provided by MT4 platform. Highly recommended using EMA SuperTrend Strategy Indicator if you want to get better result in here:
https://www.mql5.com/en/market/product/91664
This indicator is easy to use, power full and has many benefits, there are: Using three indic
FREE

准备好成为外汇交易的夏洛克·福尔摩斯了吗?️️ 介绍终极交易工具: Lisek Levels and Channels 指标!!! 忘掉像马戏团表演一样玩多个指标的杂耍吧。我们把你需要的一切都打包成一场精彩的表演: 价格水平?搞定! 价格通道?你说对了! 价格VWAP?没错! 平衡交易量?都在这里! 还有最棒的是什么?警报和推送通知,它们会比双倍浓缩咖啡更快地唤醒你!️ 你的图表即将成为交易机会的藏宝图: 看看当前价格在哪里,还有所有酷炫的水平线、通道和VWAP。 评估平衡交易量 - 它在跳熊市之舞还是牛市探戈?看看谁占上风:买家还是卖家。 上下指向的箭头像外汇狂欢派对?那显示的是买家或卖家不断增长的交易量。 像井字游戏一样交叉你图表的线条?那些是你的水平线和通道,朋友。 但是等等,还有更多! 认识 Glimpz ,你进入大玩家游戏的VIP通行证。为什么要与鲸鱼对抗,当你可以和它们一起游泳?来自 glimpz.net 的 Glimpz 让你窥探市场大亨的策略。这就像拥有一个交易水晶球,不过不用穿占卜师的服装。 交易风格?我们的花样比高级冰淇淋店还多: 在
FREE

We provide indicators tailored to better meet your trading requirements. >> MT Magical <<
MT Supply Demand :
It is an indicator created to find supply and demand, which will be important support and resistance levels for the price. Supply Zone is a zone where the price has reached, it is often resisted. In other words, when the price reaches this zone, there will be more selling power to push the price back down.
Demand Zone is a zone where the price has reached, it is ofte
FREE
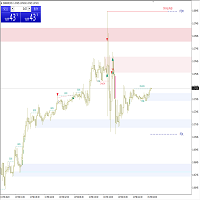
Trade History for MT4 This indicator is specially developed for that traders want to display his trades on the charts. Shows history and current deals on the chart. Trades show on the chart with a dotted line, and profit will show realtime. Buy trades are displayed in bull color, Sell trades in bear color.
Tip: The historical order displayed by the indicator is associated with the "Account History", so please set the historical order display in the "Account History" of MT software.
If you a
FREE

Discover the power of precision and efficiency in your trading with the " Super Auto Fibonacci " MT4 indicator. This cutting-edge tool is meticulously designed to enhance your technical analysis, providing you with invaluable insights to make informed trading decisions. Key Features: Automated Fibonacci Analysis: Say goodbye to the hassle of manual Fibonacci retracement and extension drawing. "Super Auto Fibonacci" instantly identifies and plots Fibonacci levels on your MT4 chart, saving you tim
FREE

Indicator determines the direction of price movement, calculates the possibility of entering the market using an internal formula and displays a breakout entry signal. Indicator signals appear both at the beginning of trend movements and in the opposite direction, which allows you to open and close orders as efficiently as possible in any of the market conditions. Version for МТ5: https://www.mql5.com/en/market/product/58980
Benefits: a unique signal calculation formula; high signal accuracy; d
FREE

indicators to facilitate analysis based on Oma Ally's BBMA strategy by displaying CSAK (CSD), CSM and Extreme labels on the chart 1. Displays the Bollinger Band line 2. LWMA 5-10 High and Low 3. EMA 50 4. Fibonacci 5. MHV . area 6. Alert & Show labels BBMA consists of the use of 2 indicators: Moving Averages Bollinger Bands BBMA consists of 3 types of entries: Extreme MHV Re-Entry Moving Average Settings: There are 5 MAs used in the system: 2 High Moving Averages, 2 Low Moving Averages and
FREE

This is the Full Version, to get the free version please contact me.
The free version works on “AUDNZD” and “XAUUSD” charts.
All symbols and time frames scanner
Head and Shoulder
One of the most popular Price Action patterns is the Head and Shoulders pattern. The pattern has three local tops that resemble the left shoulder, head, and right shoulder. The head and shoulders chart pattern appears in all kinds of markets, including Forex, cryptocurrency, commodities, stocks, and bonds. The head

Green Red Sweep Candle by RWBTradeLab
A clean, non-repainting two-candle sweep detector for MetaTrader 4. It finds the moment a candle raids the far side of the one before it and then closes clean through the opposite side — the liquidity grab and the commitment, in the same candle. All from CLOSED candles only.
What This Indicator Does
Both candles of the pattern share the same colour. The second one first SWEEPS the far side of the first, and only then CLOSES beyond the opposite side, so i
FREE

中文(简体)Iceblock 简短描述:
Iceblock — MT4 指标,识别高成交量但价格波动小的聚簇(类似冰山单行为)。 时间框架:
适用于所有时间周期(M1 至 D1)。 品种:
兼容外汇、指数、黄金和差价合约(CFD)。 参数: VolumeLookback – 计算平均成交量的蜡烛数量 VolumeThreshold – 判定成交量异常的乘数 ClusterSize – 用于确认簇的相邻蜡烛数量 RangeComparisonPeriod – 用于平均价格区间(高–低)的周期 简短结论:
Iceblock 高亮显示成交活跃但价格变动有限的区域——类似冰山单导致的现象,但仅基于 MT4 的成交量与价格数据。箭头为异常活动标记,不等同买卖信号。
FREE

Pulse Echo 指标是用于 MetaTrader 4 的 无重绘 、波动率自适应趋势包络工具。它不是依赖单一固定长度的移动平均线,而是根据短期与长期实现波动率的比率,在快速 EMA(默认 7)与慢速 EMA(默认 34)之间持续再平衡,生成一条单一的“趋势脊线”:在平静行情中紧贴价格,在高波动市况下则变平以屏蔽噪音。围绕这条脊线构建的 EWMA 方差带按脊线与当前 σ 成比例缩放,用来定义多头与空头突破;三状态的结构机(多头 / 空头 / 中性)驱动可见趋势颜色、着色 K 线以及每次确认切换时的 Buy/Sell 标签。
MT5 版本: Pulse Echo MT5 更多产品: 所有产 品 如需查看真实账户示例和最新工具,请访问我的个人主页并发送好友请求,以免错过更新! 工作原理 自适应趋势脊线 指标先计算源价格(默认收盘价)的对数收益,并送入两个滚动标准差窗口:一个是 20 根 K 线的短期波动率 volS,另一个是 80 根 K 线的长期波动率 volL。它们的比值 vr = volS / volL 通过 wRaw = clamp(1 - (vr - 0.7) / 0
FREE

InnerPulse EA: A Blend of Precision and Scalability Overview:
InnerPulse EA is a sophisticated Expert Advisor tailored for traders seeking precision and adaptability. Built around the Harami candlestick pattern (both Bullish and Bearish), this EA integrates additional filters such as Moving Average (MA), Stochastic, and RSI to validate market trends and enhance trade accuracy. Key Features: Pattern Recognition:
Detects Bullish and Bearish Harami patterns, ensuring high-probability entries by v
FREE

NEW OPTIMIZATION , LOWER DRAWDOWN UPDATE!
VERSION 3.5
(Real Profit, Real Trades, Real Signal)
After your purchase, drop me a PM.
Ever wonder why the popular selling scalpers with fixed Stoploss, that you bought, never makes money after a while, even though the backtest is great? Ever wonder why you dont make profit from the EA's that you used, after going through many of them?
There is a reason for that.
Hi, Im a Quant with 15++ years REAL trading experience. You can PM me any questi

产品简介 Bottom Picker Pro 是一款专为 MT4 和 MT5 双平台设计的牛熊波段副图指标。它通过融合多周期极值算法与多重平滑技术,构建出灵敏的牛熊趋势线与波段跟踪系统。该指标能够精准识别市场在极度超买与超卖区域的动能反转,提供明确的抄底、逃顶以及趋势回调信号,帮助交易者在波动的市场中精准把握波段的高低点,并配备完善的多通道信号提醒与冷却过滤机制。 核心功能 牛熊波段趋势系统与超买超卖参考线 系统内置 4 条核心轨迹线:紫色的 牛线 与青绿色的 熊线 用于界定中长期的牛熊多空边界;白色的 波段线 与蓝色的 段线 用于捕捉中短期的价格波动节奏。副图采用固定的 0-100 坐标系,并内置 80 和 20 两条水平参考线以界定超买与超卖区域。 MT5 版本额外支持牛线与辅助线之间的区域填充显示 ,让牛熊力量的扩张与收缩通过色块变化更加直观立体。 做多信号 Buy Dip (抄底) :当波段线在 20 以下的深度超卖区向上穿越段线时触发,显示红色向上箭头与 "Buy Dip" 文字。这代表市场经历了充分的下跌释放,空头动能枯竭并开始强劲反弹,是极具实战价值的左侧或

摆动策略是 Shuttle Runner 专家顾问的基础。 该策略在2009年被描述,并被外汇市场的交易者积极使用。 Shuttle runner是该策略的修改和改进版本。
该战略的主要实质如下:
只有在市场的活跃阶段才值得交易这个专家顾问。 我们知道市场在欧洲和美国的交易时段是活跃的(你也可以采取亚洲的,但重要的经济新闻的存在是一个先决条件)。 因此,在启动专家顾问之前,一定要查看经济日历,并检查我们要交易的国家的重要新闻。 如果有新闻,我们可以在新闻发布前1-2小时启动专家顾问。 您可以使用挂单开始,虽然如果有消息将移动市场100%,您也可以进入市场价格(由开始交易参数配置)。 第一个订单打开后,我们立即将相反的订单放置在距离初始订单20-30点的距离处,比第一个订单的数量大2.3-3倍。 这是必要的,以弥补损失的第一个订单,如果价格转向相反的方向。 此外,如果价格反转并捕获挂单,我们会在相反的方向上放置另一个订单。 这个订单的手数也增加了2.3-3倍。 依此类推,如果价格在30-40点的小通道。 订单的止损和利润从通道边缘放置15-30点,以便同一通道的所有订单在同一时间关闭。
FREE

市场新王者登场 —— 指标 + 订单管理系统(TP1 + TP2 + TP3)(完整交易系统) 该指标集成了一套先进的交易策略、可自定义订单管理系统以及均值回归(Mean Reversion)交易体系。系统结合 Envelopes 通道扩展技术,并通过 RSI 等多重智能确认过滤器筛选高概率反转机会,生成清晰的 BUY(买入)和 SELL(卖出)信号。 本指标绝不重绘(No Repaint)。 您不仅能够学习如何寻找优质交易机会,还能掌握如何高效管理多个持仓,并利用已有盈利仓位来覆盖潜在亏损交易,实现更专业的资金管理。 本指标专为 M5 时间周期开发和优化,在几乎所有交易品种和货币对上均具有出色表现。同时支持历史回测,可帮助您评估系统在不同市场环境下的表现与适用性。 指标会自动生成清晰的多头(Long)和空头(Short)信号,并基于 ATR 自动计算入场价、止损位(Stop Loss)和止盈位(Take Profit),让风险管理从交易开始就融入系统之中。 多级止盈系统(Multi-TP)设有三个递进式目标位。您可以在 TP1 部分获利了结,在 TP2 进一步锁定利润,并将剩余仓位持

Night Scalper EA 是一款先进的全自动交易系统,旨在通过高概率的剥头皮策略捕捉夜间市场的波动。不论您是经验丰富的交易者还是刚刚起步, Night Scalper 都为您提供了一个强大的工具,以精确和便捷的方式应对低波动性时期。这款专家顾问(EA)采用稳健的多货币策略,同时确保严格的风险管理,并符合NFA/FIFO规则。 Night Scalper EA 的主要功能 多货币剥头皮交易 Night Scalper 设计用于交易多种货币对,为您提供多样化交易的灵活性。其先进的算法可根据不同的市场条件进行调整,确保您不局限于单一货币对。 全自动化交易 此 EA 设计用于无人值守的交易。一旦设置好, Night Scalper 将自动为您开仓、管理和平仓。其高效的策略让您无需频繁监控即可参与剥头皮交易。 夜间市场剥头皮策略 Night Scalper EA 专注于夜间低波动时段的交易,专门针对市场较为平静的时间段进行操作。通过在这些较为平静的市场时期进行交易,EA 能够在控制风险的前提下快速执行交易。 内置风险管理 风险管理是 Night Scalper EA 的核心功能。EA 使

Forex Gump EA is a unique trading system that uses algorithms for trading with several indicators of the Forex Gump series. Thanks to the improved financial control system, this robot adjusts the aggressiveness of trading depending on the dynamics of the deposit growth. The more actively the deposit grows, the larger the lot size of new opened deals. That is, the trading volume of transactions increases with the growth of the deposit on the trading account. The robot in a fully automatic mode a

What is the FVG Scalper EA?
I would suggest this bot is best for people who have a good understanding of a certain market and how the FVG and retracements work in that said market. Anyone who can share profitable .set files with me, i'd be happy to collaborate with.
Let's be totally honest for one moment. Many of the products on MQL5 are very slippery promising crazy returns, sharing the most amazing backtests you have ever seen and so forth. But, they typically either overcomplicate how the
FREE

The popular "SuperTrend" indicator is a technical analysis tool designed to help identify trend direction and potential entry or exit points in financial markets. This indicator is built upon the Average True Range (ATR) , which gauges market volatility based on price ranges. It is available for free on other platforms, and this should be no exception! Common Use Cases The SuperTrend is typically utilized in three primary ways: Trend Identification: When the price is trading above the indicator
FREE
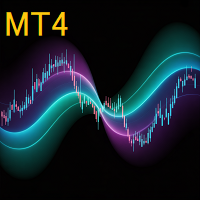
AP VWAP Bands Pro (MT4) Volume-weighted average price with ±σ bands for clear intraday bias, mean-reversion zones, and dynamic support/resistance. Works on crypto (incl. BTC), FX, indices, and metals. Uses tick-volume when real volume isn’t available.
What it shows VWAP line (volume-weighted mean price).
Two envelopes around VWAP (default ±1σ and ±2σ) to highlight balance vs. extension.
Reset modes: Day, Week, or Anchor Time (HH:MM) to start VWAP where you need it (e.g., exchange open).
Why
FREE
学习如何在MetaTrader AppStore上购买EA交易,MetaTrader平台的应用程序商店。
MQL5.community支付系统支持通过PayPay、银行卡和热门付款系统进行交易。为更好的客户体验我们强烈建议您在购买前测试EA交易。
