 MetaTrader 5
 专家
专家
 指标
指标
 程序库
程序库
 实用工具
实用工具
 窗口小部件
窗口小部件
 规则
规则
适用于MetaTrader 4的EA交易和指标 - 15
 EA交易自动执行市场交易,而指标可使您更准确地分析报价并预测价格行为。
通过这些应用程序,您将能够更明智地在MetaTrader 4执行交易,抓住更多的交易机会。
EA交易自动执行市场交易,而指标可使您更准确地分析报价并预测价格行为。
通过这些应用程序,您将能够更明智地在MetaTrader 4执行交易,抓住更多的交易机会。 
Indicator determines the direction of price movement, calculates the possibility of entering the market using an internal formula and displays a breakout entry signal. Indicator signals appear both at the beginning of trend movements and in the opposite direction, which allows you to open and close orders as efficiently as possible in any of the market conditions. Version for МТ5: https://www.mql5.com/en/market/product/58980
Benefits: a unique signal calculation formula; high signal accuracy; d
FREE

产品简介 Dual Swing Breakout System 是一款专为 MT4 和 MT5 双平台设计的双摆动突破状态机主图指标。它通过构建快、慢两套完全独立的摆动高低点追踪系统,将市场结构转化为清晰的状态机模型。当价格突破关键摆动极值时,系统会改变状态线的颜色并触发交易信号。该指标帮助交易者过滤市场噪音,精准识别短期动能爆发与中长期趋势反转,提供了一套逻辑严密、视觉直观的主图趋势跟踪解决方案。 核心功能 快慢双轨状态线与实时价格标签 系统在主图绘制 4 条状态线: 快线 由红色(多头状态)和绿色(空头状态)组成,追踪短期 12 周期内的摆动极值突破; 慢线 由紫色(多头状态)和青色(空头状态)组成,基于多周期加权组合算法追踪中长期趋势结构。线条颜色会根据市场状态自动切换,让交易者一眼看清当前所处的多空阶段。系统在最新 K 线右侧显示橙色(快线)和紫色(慢线)的 实时关键价位数字 ,方便交易者设置止损或挂单。 MT5 版本额外支持 K 线变色染色功能 ,让盘整与突破状态通过 K 线颜色直观呈现。 做多信号 Long (快线做多) :当快线状态从空头(绿色)切换为多头(
FREE

Currency Strength Pro 按相对强度对八大主要货币进行排名,数据取自最多 28 个货币对,基于多周期合成计算,然后把篮子自身能组成的货币对排进一个带分级的扫描器。只使用已收盘的柱,绝不在每个 tick 上计算。 思路很简单:用强势货币对抗弱势货币,而不是去交易今天碰巧看着顺眼的那张图。强度表回答"哪种货币";扫描器和它的 A/B/C 分级回答"哪个货币对,这个设置有多干净"。 它做什么 面板把 EUR、GBP、AUD、NZD、USD、CAD、CHF 和 JPY 从最强到最弱排列。每一个读数都建立在您的经纪商实际报价的货币对之上。每个货币对为一方加分、为另一方减分,因此八个分值始终以 50 为中心,货币篮子在构造上是零和的。50 是篮子的平均值,而不是一条固定水平线:分值 70 表示该货币此刻相对于其余七种货币强势,而不是绝对意义上的强势。 表格下方,扫描器会给篮子能组成的每一个货币对打分:差距大且各周期一致的为 A,差距明显的为 B,差距勉强的为 C。最佳设置卡片用文字说明排名第一的那一行,鼠标悬停在任意扫描器行上都会解释它为什么得到这个分级——各周期的差距、双方背后

TCL Boom Crash is a signal indicator for MetaTrader 4 that combines a Relative Strength Index (RSI) layer, Stochastic oscillator confirmation, optional RSI divergence detection, and a multi-factor trend filter. Signal arrows are plotted on the chart when the configured filters agree. How It Works Each potential signal is built from three layers: RSI crossing its overbought or oversold level, Stochastic oscillator confirmation, and optional RSI divergence detection. A separate trend filter using
FREE

It identifies the pivot, support, and resistance price levels of the selected timeframe and then draws lines onto the chart. FEATURES: Option to specify the Timeframe Period in the PivotSR calculation. Option to display the PivotSR of the last candle, of every candle, or of the current candle. Options for displaying labels, line thickness, and line color. PivotSR can be interpreted as reversal levels or past price reactions that can be used as the basis for current price analysis. Some traders b
FREE

VR Trade Panel 是一款专业的交易面板,旨在提高交易便利性并降低交易风险。借助简洁的界面和详尽的指南,新手将更容易掌握交易基础并开始实践。 面板的主要原则:舒适、快速、功能全面。 說明: [ 如何安裝 ]、[ 如何使用 ]、[ 演示版 ]。 程序界面直观简洁,只需两次点击即可开立市价单或设置任何类型的挂单。 头寸和订单管理迈上了新台阶,您不仅可以移动水平的止损和止盈位,还能创建倾斜的价位。借助这一解决方案,止损、止盈位及挂单价格可按您指定的方向移动,或在设定条件下自动失效。 该交易面板旨在让交易者能提前为自己做好一切设置,从而快速舒适地交易。 为此,交易面板采用了以下先进解决方案: 五个手数按钮——让您无需在计算上浪费时间,能瞬间选择所需的交易量。同时,交易量可按存款百分比、指定金额或存款的倍数金额进行计算。 止损和止盈输入字段——您可按方便的方式指定规模:精确价格、精确点数、期望的利润或亏损金额。 注释输入字段——会保留此前输入的注释,无需您重新填写。 声音提示——帮助您了解交易指令的执行情况。 对于每个头寸或挂单,您可设置多达 10 个部分平仓价位,每个价位均可单独配置
FREE

这是免费产品,欢迎您使用以满足您的需求!
如果您喜欢这个指标,请留下简短的好评!非常感谢! .............................................................. 点击这里查看高质量的交易机器人和指标! ......................................................... Crypto_Forex MT4 版“RSI 带警报”指标,无需重绘。 - RSI 是最受欢迎的交易震荡指标之一。 - 内置 PC 和移动端警报,适用于:进入超卖/超买区域以及退出超卖/超买区域。 - 警报触发级别可调。 - 该指标非常适合动量交易系统。 - 它非常适合在强超买区域(高于 70)进行卖出操作,以及在强超卖区域(低于 30)进行买入操作。 - RSI 本身对于背离检测非常有用。 - 指标适用于任何时间范围。 - 该指标也非常适合与价格行为技术结合使用。 本产品为原创产品,仅在 MQL5 网站提供。
FREE

实施一种稳健的策略通常被证明是一项具有挑战性的任务。我们理解您的时间宝贵,这就是为什么我们推出“ Diamond Hedge Pro ”的原因。这一革命性的解决方案提供了一种成功的策略,让您在享受成功的同时,无需花费数小时监控图表的负担。
重要!购买后请立即与我联系,我将为您提供我使用的参数!
它是如何工作的? 设置您的交易通道并选择所需的倍增器。当市场达到通道限制时,EA开始运行。无论运动方向如何,都会以预定义的止盈和止损水平开启交易。在市场保持在设定的通道内时,“ Diamond Hedge ”通过低买、高卖和累积利润运作。当市场趋势并离开通道时,EA会节制自己,在稳定恢复时重新开始操作,采用对冲机制以保持交易为正。 通过战略性过滤器优化性能 为了进一步提高EA的性能,我们已经加入了关键的战略过滤器。时间过滤器将EA的活动限制在一天中的特定时间,增加了利润潜力。这些过滤器共同精炼“ Diamond Hedge ”策略,确保它调整得以在市场中最大程度地把握机会。
为什么应该购买这个EA? 验证过的策略:该EA融合了一种经过开发和测试以利用市场波动的成功策略。在各种条件下获得的实
FREE
This expert advisor trades using the famous super trend indicator: it is completely loyal to the original algorithm and implements many other useful features for the exigent trader, like customizable trading sessions, multi-timeframe filters and many others. [ Installation Guide | Update Guide | Troubleshooting | FAQ | All Products ] Easy to use and supervise Fully configurable indicator settings Customizable break-even, stop-loss, take-profit and trailing-stop settings Works for ECN/Non-ECN br
FREE

停止搜索和尝试新指标!获取 Winshots Massive FX Profits 指标,让自己与众不同。
多年的交易经验使我们构建了这一多合一指标!
使用 Winshots Massive FX Profits 像专业人士一样交易!
该指标使用以下方法来帮助您成为更稳定的盈利交易者:
- 市场容量概况 - 每日枢轴级别 - 价格周期分析
什么是音量曲线?
成交量概况是许多交易者忽略的非常有用的交易工具 - 它使您可以发现重要价格行为发生的真实价格水平。它类似于支撑位和阻力位,但逻辑不同。成交量分析概述了机构交易发生的实际支撑和阻力水平。没有更多的猜测工作!你会确切地知道所有大量交易何时发生,大量的手数和交易量。成交量配置文件的 POC(控制点)将通过在图表上画一条线来准确显示发生的位置。 POC 是卷配置文件上的最高卷节点。控制点是交易量配置文件上最长的交易量条,那里有大量交易量。专业交易者将 POC 用作强大的支撑和阻力或重要的重新测试点。
成交量概况(在某些情况下也称为市场概况)是一个方便的工具,用于检查图表上的价格行为。交易者在分析图表时标记的第一件事是支撑
The indicator highlights the value in "over Sold" and "over Bought" zones. in addition, arrow indicates the return of the value from the extreme zone. Indicator can be easily customized by the user including change of colors, with, levels and arrows. Combination with other market signals and analysis is necessary and provides more stable results. Alert is also available for user.
FREE

达到目标利润时自动锁定利润 EquityTargetCloser — 是一款 MetaTrader 5 实用工具型专家顾问,当 净值(Equity)超过当前余额达到指定的利润金额时 ,它会自动平掉所有市价单并删除挂单。平仓后目标自动提高:新门槛 = 新余额 + 指定利润。该 EA 不负责开仓,仅管理现有头寸,帮助可靠地锁定利润并保护积累的资金。 MT5-version: https://www.mql5.com/en/market/product/169839
工作原理 该专家顾问持续将 净值(Equity) 与动态目标进行比较: 目标 = 当前余额(Balance) + plusMoney (美元)。 当净值大于或等于该金额时,触发保护机制: 平掉 所有市价单 (任何品种)。 如果参数 Delete pending orders = true ,则删除 所有挂单 。 平仓后余额更新,目标重新计算: 新余额 + plusMoney 。这样,EA 在每个成功周期后逐步提高利润锁定门槛。 重要提示 :触发条件取决于 累计浮动利润 ,而不是

This is the best Support and Resistance Indicator on the market, and it shows both confirmed Support and Resistance as well as Retests. Support & Resistance: Support marks where buying demand halts price declines, acting as a safety net. Resistance caps price surges, driven by selling pressure. Traders leverage these levels to predict reversals, plan entries, exits, and manage risks, making them trading's fundamental guideposts. Join To Learn Market Depth - https://www.mql5.com/en/channels/suv
FREE

TPSproTrend PRO 这是一个趋势指标,它可以自动分析市场,提供有关趋势及其变化的信息,并显示交易入场点。 无需重绘! 新版本 Trend Lines PRO — 改进了入口点检测算法,增加了信号滤波,并更新了可视化效果。 俄语说明 - 说明 ENG - MT5 VERSION
主要优势 无需重绘即可发出信号。 所有信号均已固定。 如果出现箭头 - 它不会再改变也不会消失了。
您可以基于稳定的数据做出交易决策,而无需承担虚假信号的风险。 现成的买卖点 该指标会自动确定最佳交易时机,并在图表上用箭头显示出来。
无需猜测或主观分析——只有清晰的信号。 自动止损和止盈区域 信号发出后,您立即会看到: 入口点 风险限制区(止损) 止盈区 这允许 在达成交易前评估交易条款 并遵守风险管理规定。 自适应止损(移动止损) 该指标采用智能交易支持逻辑,随着时间的推移…… 减小止损位,降低初始风险。 支持更高时间框架(MTF) TPSpr

How To Use
Check out this post for detailed description on All Indicator extras and template: https://www.mql5.com/en/blogs/post/758259
The Best Heiken Ashi System is a simple trading system for trading based only two indicators for generate signals: Heiken ashi smoothed and Vqzz indicator multi-timeframe. The system was created for scalping and day trading but can also be configured for higher time frames. As mentioned, the trading system is simple, you get into position when the two indica
FREE

FOLLOW THE LINE GET THE FULL VERSION HERE: https://www.mql5.com/en/market/product/36024 This indicator obeys the popular maxim that: "THE TREND IS YOUR FRIEND" It paints a GREEN line for BUY and also paints a RED line for SELL. It gives alarms and alerts of all kinds. IT DOES NOT REPAINT and can be used for all currency pairs and timeframes. Yes, as easy and simple as that. Even a newbie can use it to make great and reliable trades. NB: For best results, get my other premium indicators for more
FREE

GoldmanScalper_V3 - Adaptive Scalping on XAUUSD Overview and Operational Strategy GoldmanScalper_V3 is an Expert Advisor (EA) specifically designed for trading XAUUSD (Gold vs. US Dollar) , an asset known for its high volatility and rapid movements. The EA is optimized to execute an adaptive scalping strategy , aiming to profit from short-term price fluctuations. Key Features: Target Asset: Exclusively XAUUSD . Strategy: Adaptive Scalping, specialized in high volatility environments. Time
FREE

Rebate System performs a large number of trades with the minimum profit, which gives the opportunity to earn from receiving rebates (returning part of a spread). It is based on two grids (buy and sell), when one of them is in a drawdown, the other one can enter with an increased lot size, keeping the account away from the drawdown. It features a news filter, which prevents the possibility of getting into a trend without rollback caused by news releases. The default parameters are for EURUSD and

Liquidity Flow Analyzer (LFA) v2.2 实时检测机构资金流向市场的位置——在价格启动之前发现流动性变化。 指标显示内容 绿色/红色柱状图 —— 每根K线的净流动性流量: 绿色 = 买方占主导 红色 = 卖方占主导 LFA 线 —— 根据设定周期平滑后的流动性趋势 EMA 信号线 —— LFA 与 EMA 的交叉表示动量变化(类似 MACD) 箭头信号 —— 吸筹 ↑ 和 派发 ↓ 信号,由高成交量和价格位置共同确认 信息面板 显示在图表角落,并实时更新: Symbol / TF —— 当前交易品种和时间周期 Flow —— 当前 LFA 数值(+ 看涨 / − 看跌) Trend —— LFA 相对于 EMA 的动量状态:BULLISH / BEARISH / FLAT Signal —— ACCUMULATION · DISTRIBUTION · NEUTRAL Accum / Distrib —— 0–100% 的评分条 Vol —— 当前成交量与平均成交量的比率:SURGE · HIGH · NORMAL · LOW HTF —— 高周期确认状态:A

The XU_H4_910440109_S_PS_CF_SQX is an algorithmic trading strategy for MetaTrader, tested on XAUUSD (Gold) using the H4 timeframe from April 1, 2004, to April 24, 2024. There is no need to set up parameters, all settings are already optimized and fine-tuned.
Recommended broker RoboForex because of EET timezone.
You can find the strategy source code for StrategyQuant at the link: https://quantmonitor.net/gold-bulls-power-trader/
Key details are:
Parameters
MagicNumber: 910440109
Main Ch
FREE

New version 8.00 is available.
In this version, I tried to take into account the wishes of the user. Each of you can also take part in the improvement of this advisor. In the default settings, the adviser opens trades when the extremum point is broken standard indicator Zigzag. When the upper point of the zigzag extremum is broken, it opens a buy deal, and when the lower point of the zigzag extremum is broken, it opens a sell deal.
In addition to the standard ZigZag indicator, which
FREE

下面是中文翻译版本: ORP Dip Expert — 掌控风险溢价 简要说明 专业的趋势跟随机器人,在上升趋势中自动买入市场回调,在市场过度乐观时获利,使用基于波动率的自适应入场和退出信号。 交易策略 ORP Dip Expert 适合希望系统性从已建立趋势中的暂时回调中获利的交易者。机器人遵循纪律化方法:在恐惧创造机会时买入,在贪婪创造风险时卖出。 工作原理 机器人使用双移动平均系统识别强势趋势。当市场处于上升趋势时,它耐心等待暂时回调(dip)后再建仓。回调通过平均真实波幅(ATR)指标识别,该指标会根据当前市场波动自动调整——无论市场平稳还是波动,机器人都能自适应。 入场系统: 仅在确认的上升趋势中买入(价格高于200周期移动平均线) 等待价格回调至20周期移动平均线以下,距离根据波动率调整 使用动量指标确认入场,避免“接刀子” 随回调延伸可增加多个仓位,智能间距防止过度交易 出场系统: 市场过度延伸时自动减仓(乐观情绪检测) 使用随市场波动调整的移动止损 可选固定盈利目标,实现设置后无需干预 每个仓位都有独立保护止损 优化适用 货币对: EURUSD, GBPUSD, USD

Next Arrival : Flip or Die Trading Arena. Flip a trading account: https://flipordie.com/chapter-1-thirteen-doublings-double-a-trading-account/
The Break of Structure (BoS) and Change of Character indicator with Fair Value Gap (FVG) filter is a specialized tool designed to enhance trading strategies by pinpointing high-probability trading opportunities on price charts. By integrating the BoS and Change of Character concepts with the FVG formation, this indicator provides traders with a robust f
FREE
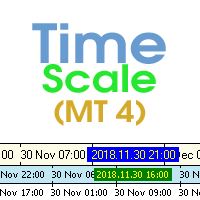
The indicator draws the time scale on the chart. You can specify the time offset, adjust the size and font to display on the chart (it is displaying your local time on your chart instead of MT time). You can also select the desired format for displaying the date and time. While holding down the middle mouse button, and moving the cursor, a slider will appear on the scale. You may be interested in my other product , which contains a more advanced version of the Time Scale.
You can also find my o
FREE

不要盲目追逐每一根波动。大多数蜡烛图指标之所以失败,是因为它们将趋势中部的“锤子线”与关键反转点的“锤子线”混为一谈。 Candlestick Pattern Analytics 通过结构、强度和逻辑过滤,彻底改变了这一点。 为什么选择这款指标? 普通工具会用海量信号“轰炸”你的图表,而本指标专注于 质量而非数量 。 基于波段高低点的智能识别: 默认情况下,信号仅出现在局部波段高点(Swing High)或低点(Swing Low)。它忽略了趋势中段的“噪音”,专注于市场真正的转向位置。 加权强度评分: 并非所有形态都具有同等价值。信号被分为 3个强度等级 (1 到 3 分),支持自定义颜色编码。一眼识别高胜率设置(3分)。 精准自定义参数: 你可以自行定义“锤子线”或“吞没形态”的外观。调整实体比例、影线比例和缺口规则,以适配特定的品种和交易策略。 它如何简化您的交易? 即时价格行为读取: 无需手动扫描。形态(如晨星、吞没等)一旦形成,图表立即显示清晰的文字标签或箭头。 简洁的图表: 使用上下文过滤器(Context Filter)保持工作界面专业化。如果
FREE

本程序是为交易者和投资者设计的简单图表播放器,旨在帮助您回放历史市场数据,从而更好地理解市场的动态和价格走势。
使用本播放器,您可以逐根推进K线,按顺序确认市场走势, 并可以分析特定交易策略在不同市场情况下的表现。
通过反复观察关键价格点和趋势变化, 您能够有效地提升交易决策的准确性和操作信心。
播放过程中可以暂停, 并在需要时继续播放。
【功能特点】 从过去向未来方向自动播放 以固定间隔逐根K线推进 支持播放中的暂停 【播放规格】 播放方向:过去 → 未来 播放速度:固定 移动K线数量:1根固定 播放暂停 / 继续 使用END结束播放 【操作方法】 Pause / Restart:暂停或继续播放 END:结束播放并停止程序 版本比较 下表显示了本产品(Player版)与高端型号(Full Version)之间的功能差异。虽然用户界面(控制面板)的布局完全相同,但可用的模式和设置范围有所不同。
功能项目 Player版 (本产品) Full Version (完整版) 用户界面 完全相同 (通用
FREE

Prop Gold Breakout 是一款用于 XAUUSD(黄金) 、运行在 M15 周期 的全自动智能交易系统(EA)。该策略专门面向 Prop Firm 挑战账户 和资金账户设计,采用简洁的突破交易逻辑,不使用马丁格尔,也不使用网格加仓,因此更适合有严格风控和回撤限制的交易环境。 该 EA 会识别最近的价格区间,在区间上方和下方放置 Buy Stop 与 Sell Stop 挂单,并通过固定止损、固定止盈、保本移动和移动止损来管理订单。当点差过高或达到当日盈利目标时,系统会自动停止继续开仓,以帮助控制风险。 主要特点 适用于 XAUUSD(黄金)M15 纯突破逻辑,使用 挂单突破入场 不使用马丁格尔,不使用网格,不做套利,不依赖新闻交易 内置 最大点差过滤 ,默认 35 点 带有 每日盈利停止功能 ,达到目标后当天停止交易 支持 交易时段过滤 支持自动 保本 与 移动止损 同时仅保留一个交易机会或一组挂单,避免过度交易 全自动运行,参数清晰,易于使用 建议使用条件 交易品种: XAUUSD(黄金) 时间周期: M15 最低建

Backtest Trade Simulator (BTS) — MT4/MT5 手工模拟交易面板
本产品是用于 MetaTrader 4 与 MetaTrader 5 的图表工具(Utility),在策略测试器的可视化(Visual)模式下,于历史行情中进行手动模拟下单、挂单管理与成交统计。产品不自动开仓,不构成投资建议,也不保证任何实盘或未来交易结果。
适用场景 - 在策略测试器中练习手动交易流程 - 检查挂单价格、手数、止损/止盈设置是否合理 - 查看模拟成交后的统计指标(胜率、盈亏比、最大回撤等)
重要说明 - 所有订单与统计均来自测试器内的模拟环境,与真实账户表现可能不同 - 面板依赖图表对象与测试器事件,请按下方设置启用可视化模式
策略测试器建议设置
MT5 - Modelling:1 minute OHLC 或 Open prices only - 勾选 Visual mode(显示图表的可视化模式)
MT4 - Model:Open prices only - 勾选 Visual Mode
主要功能 - 手数、价格、止损价、止盈价:只读输入框配合 +/-
FREE
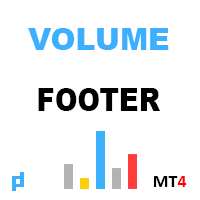
指示器显示垂直体积. 在设置中,有2个系数用于确定高和极值,1个用于确定低音量。 类似的算法也用于指示器 UDP1 Volume Pixel 。 当检测到指定的体积时,直方图以适当的颜色着色。 直方图的宽度会根据比例自动选择。 作为一项规则,价格反应的最大和最小体积。 但有必要使用确认信号。
输入参数 。
基本设置 。 Bars Count - 指标将显示在其上的蜡烛数 。 Calc Bars - 确定体积偏差的平均蜡烛数 。 Low Volume Factor - 我们定义低容量的系数 。 High Volume Factor - 我们定义大体积的系数 。 Extreme Volume Factor - 我们定义极值体积的系数 。
视觉设置 。 Histo Color - 根据蜡烛的体积和方向选择颜色来着色直方图 。 Width Histo (-1 auto) - 规则直方图的厚度 。 Width Color Histo (-1 auto) - 颜色直方图的厚度。 默认情况下,自动选择厚度。
电线杆 。 Draw Polus - 显示两极。 极点被定义为逆分形。 左右的音量
FREE

Position Calculator calculates how many lots to trade based on: Entry and stop-loss levels Risk tolerance Account size (balance, equity, or even your savings account) Account currency Currency exchange rates - The main tab of the panel provides the primary control over the EA's functions and serves to output the most important calculation results: the position size, risk, reward, and risk-to-reward ratio. - The risk tab can help you assess current and potential risk and reward profile. Using a s
FREE

Adaptive SuperTrend K-Means is an MT4 port of the open-source TradingView indicator "Machine Learning Adaptive SuperTrend" by AlgoAlpha (Mozilla Public License 2.0). All credit for the idea and the original code goes to AlgoAlpha. At a glance What it is: a SuperTrend whose band width adapts to the current volatility level Volatility levels: K-means sorts recent ATR values into high, medium and low clusters Faithful port: same math and the same defaults as the original Pine Script code For EA dev
FREE

Smart Band Classic An adaptive multi-layer trading indicator combining dynamic price zones, intelligent BUY and SELL signals, and professional chart visualization in one streamlined MetaTrader 5 workspace. Smart Band Classic is a technical analysis indicator designed to help traders navigate market movements, recognize potential trading opportunities, and evaluate price behavior through a clean and coordinated visual environment. The indicator brings together an adaptive band system and a propri
FREE

The Trend PA indicator uses Price Action and its own filtering algorithm to determine the trend. This approach helps to accurately determine entry points and the current trend on any timeframe. The indicator uses its own algorithm for analyzing price changes and Price Action. Which gives you the advantage of recognizing, without delay, a new nascent trend with fewer false positives. Trend filtering conditions can be selected in the settings individually for your trading style. The indicator

NAD RSI Cross A simple RSI-based indicator that provides clear BUY and SELL signals directly on the chart. How It Works BUY — RSI 14 crosses above 30 after the candle closes. SELL — RSI 14 crosses below 70 after the candle closes. Features RSI 14 BUY level: 30 SELL level: 70 Closed-candle confirmation Clean chart with simple arrows Suitable for XAUUSD M1 Can also be used on other instruments and timeframes SL & TP Set your own SL and TP according to your trading strategy and risk managemen
FREE

Divergence Signal Alerts MT4 is a free indicator for MetaTrader 4 that finds RSI and MACD divergences on the chart. It draws a line between the two price pivots. It puts an arrow on the bar where the divergence became known, and it can send alerts. Signals come from closed bars only. A pivot is known only a few bars after it forms. The arrow goes on that later bar and never moves or disappears. It places no orders. MetaTrader 4 edition: the same calculation and the same arrows as the MetaTrader
FREE

SMC Zones MT4 is a free smart money concepts indicator for MetaTrader 4. It draws order blocks, fair value gaps and BOS / CHoCH structure lines on any symbol and timeframe, with alerts for new and touched zones. It is a charting tool. It draws zones and sends alerts; it places no trades and does not say when to buy or sell. Every zone is decided on a closed bar, so it does not repaint. Standalone: everything is built in. You do not need to buy or install any other product named on this page. Met
FREE

这是免费产品,欢迎您使用以满足您的需求!
如果您喜欢这个指标,请留下简短的好评!非常感谢!
点击这里查看高质量的交易机器人和指标!
Crypto_Forex 指标:Heiken Ashi Candles for MT4。无需重绘。 - Heiken_Ashi_Candles 与趋势线 MA 指标完美结合,如图所示。 - 指标 Heiken_Ashi_Candles 是非常有用的辅助指标,可以使趋势更加明显。 - 它有助于使烛台图更具可读性,趋势更易于分析。 - 大多数利润是在市场趋势时产生的,因此正确预测趋势是必要的。 - Heikin-Ashi 图表的构造类似于常规烛台图,只是计算每个条的公式不同 - Heikin-Ashi 具有更平滑的外观,因为它本质上是取运动的平均值。 - 绿色蜡烛没有下影线,表示强劲的上升趋势。 - 红色蜡烛没有上影线,表示强劲的下降趋势。 - 蜡烛主体较小,周围有上下影线,表示趋势发生变化或修正。 这是仅在此 MQL5 网站上提供的原创产品。
FREE

Safe Trading with a $500 Account This Expert Advisor (EA) has been carefully engineered for traders who prioritize capital protection, disciplined risk management, and sustainable long-term profitability over aggressive, high-risk trading. Rather than pursuing unrealistic returns, the EA is designed to achieve consistent performance by maintaining a conservative approach to every trade. The recommended minimum trading capital is $500 USD . With this account size, the EA automatically starts trad
FREE

WONNFX Trade Panel EA - Trading Panel for MT4 EA Description:
is a user-friendly semi-automatic trading panel. The EA attaches to a chart and provides an intuitive button-based interface for quick trade execution.
The panel allows you to open market, limit, and stop orders with predefined parameters, and manage risk effectively using built-in Breakeven and Trailing Stop functions.
Key Features
1. Market Orders:
Instantly open BUY and SELL positions with a single click Automatic lot calculat
FREE

免费获取我所有的 MT4 和 MT5 指标 — 点击这里了解方法
新工具 售价 $30 限于 首周 或 前 3 次购买 ! MQL5 Trading Tools 频道 : 加入我的 MQL5 频道,获取我的最新动态 AI Channels 指标利用 滚动K均值聚类 ——一种在聚类分析中强大的机器学习技术——实时提供基础价格趋势的见解。该指标根据聚类价格数据创建自适应通道,使交易者能够做出有关趋势方向和市场状况的明智决策。 该指标还包括一个 跟踪止损选项 ,提供了更灵活的风险管理方法。 查看更多MT5版本: AI Channels MT5 查看更多产品: 所有产品 如何使用AI Channels指标 每个通道的极端值为确定趋势方向提供了宝贵的见解: 上通道极端值: 价格突破此水平可能表明上升趋势。 下通道极端值: 价格跌破此水平可能表明下降趋势。 调整 窗口大小 (用于聚类的最近价格范围)可以提供高值的长期视角或低值的短期视角。 通过“群集”设置调整聚类 群集 设置允许用户控制价格突破通道极端值的难易程度。较高的群集值将极端值放置得远离价格,反映出更
FREE

MA Ribbon Flow MA Ribbon Flow is a trend visualization indicator that combines 20 Moving Averages into a single ribbon-like structure.
The purpose of this indicator is to help traders validate whether a trend has truly changed direction or if the market is only experiencing temporary pullbacks or noise.
By observing the flow, alignment, and spacing between the MA ribbons, traders can identify: Trend strength Trend continuation Potential reversals Momentum expansion and weakening The indicator
FREE

这款EA产品使用的交易策略来自于传统而有效的PASR策略,该策略包含了蜡烛形态判断,支撑压力位判断,当前加载的时间框架下以及周和月时间框架下的趋势判断;该产品包含了多货币对,趋势,趋势翻转等功能的自动化交易系统,没有马丁,没有网格,没有对冲,没有剥头皮;它有明确的止损位,止损方式根据当前时间框架最近收盘的蜡烛价格判断是否关闭,止盈点位默认根据EA是否检测到反向信号来判断是否关闭,当然,也可以设置目标盈利点子数或者设置跟踪止损,但强烈建议您使用默认止盈方式, 因 明确设置目标止盈点子或者设置跟踪止损会让您丢失潜在更大的盈利结果 。另外,因EA的判断目前不能做到100%,所以必要时可以人工干预关闭盈利订单,这样不会影响EA的运行。 支持的时间框架:H1 H4 D1 默认配置建议运行XAUUSD H1 下面是输入参数列表: input string EAComment = "RTNV"; //EA名称用于备注 input int MAGICMA = 891;
FREE
通过 Nadaraya Watson Envelope MT4 解锁您的交易策略潜力,这是一种创新指标,旨在为交易者提供精确的趋势分析和动态支撑与阻力水平。非常适合 forex、商品和加密货币交易者,这个工具增强了决策能力和识别市场反转及趋势延续的准确性。 Nadaraya Watson Envelope MT4 的突出之处在于利用先进的高斯核平滑技术创建自适应包络带,以响应市场波动。这使得交易者能够自信地捕捉关键价格波动,无论是快速获利的剥头皮交易,还是长时间持有的仓位。 MQL 产品安装指南 | 在 MT4 上更新已购买的 MQL 产品 | 常见故障排除指南 | 指标设置 / 指南 主要特点 缓冲区集成:将指标值暴露为可访问的缓冲区,用于基于信号的自动交易,使 Expert Advisor 能够有效利用数据。 快速且可回测:基于 MetaTrader 的原生 OnCalculate() 引擎进行快速计算,确保与策略测试器兼容以进行历史分析。 弹出警报:在信号事件上触发 MetaTrader 警报弹出窗口,确保您不会错过任何交易机会。 推送通知:实时推送通知直接发送到您的 MetaT
FREE

GOLD (XAU) is one of the most volatile assets, and is the most attractive asset for traders.
Use this EA with this simple setup to trade Gold. To use this EA, the user only needs to fill in the Lot , TP , SL , and the EA will work optimally.
Choose the M1 time frame for this EA, to get as many trades as possible.
Even if the user leaves the TP and SL values (TP=0 & SL=0), the EA will automatically determine the best TP and SL values so that trading can be profitable.
As an additional f
FREE

Kalifx Trade Manager is a smart on-chart trading and risk-management panel for MetaTrader 4. It replaces manual order tickets and spreadsheet risk math with a compact, draggable panel that lets you place, size, and manage trades directly from the chart — including automatic breakeven, trailing stops, and a 3-level partial close (multi-TP) system with draggable on-chart lines. Built for discretionary traders who want the speed of a one-click panel with the discipline of automated risk rules runn

欢迎使用 Repeat Order Block,这是一款高效的图表工具,专为那些希望在没有盯盘压力的情况下获得高胜率交易的人而构建。 该指标背后的核心理念非常简单且合乎逻辑:我们只交易 pullback (回调)。我们等待主要市场结构在 Higher Timeframe (较高级别时间框架)上被打破,让价格回撤到我们新形成的区域,然后严格等待 Lower Timeframe (较低级别时间框架)上的趋势延续确认,然后再执行交易。 主要功能和优势 Proven Multi Timeframe Logic: 这不是一个标准的独立指标。它无缝融合了两个时间框架。Higher Timeframe 充当您的路线图,而 Lower Timeframe 充当您的狙击触发器。这过滤掉了虚假的 breakout(突破)和陷阱。 Clean Visual Distinction: 您的 Higher Timeframe 区域用纯色背景填充清晰标记,这样您就不会迷失大局。同时,您的 Lower Timeframe 确认区域仅用边框清晰绘制,让您的图表保持整洁易读。 Interactive On Chart

Discover our sophisticated Expert Advisor (EA) designed for the MetaTrader 4 (MT4) market.
This free EA exploits a trading strategy based on the crossover of two simple moving averages, enhanced by a grid approach, providing a powerful way to optimize your operations in the financial market.
Key Features:
Moving Average Crossover Strategy: Our EA uses a crossover of two moving averages – 50 and 200 periods – to identify trading opportunities. This proven method provides a strong indication o
FREE

EA Local Trade Copier Pro MT4:终极无 DLL 交易复制器 您是否厌倦了那些需要不安全的外部 DLL、导致终端崩溃,或者用独立的“Master”和“Client”文件让您感到困惑的复杂交易复制器? 使用 EA Local Trade Copier Pro MT4 体验新一代的交易复制。这款工具专为最大程度的稳定性、闪电般的执行速度和极致的简单性而设计,允许您在同一台 Windows PC 或 VPS 上的多个 MetaTrader 终端之间无缝复制交易。 无论您是管理多个自营基金(Prop Firm)账户、分享信号,还是管理投资者资金,EA Local Trade Copier Pro 都能提供完美无瑕、零延迟的同步。 LOCAL TRADE COPIER PRO 的优势(解决痛点) 与市场上大多数复制器不同,EA Local Trade Copier Pro 使用 100% 原生 MQL5 代码(零 DLL)。这意味着它绝对安全,绝不会触发防病毒警告,并且完全符合 MQL5 市场规则。 我们 EA 的一个巨大优势是只读复制功能。您不需要主账户的交易权限!您

ATTENTION: The Indicator cannot be backtested, as it is generated exclusively from live intraday calculations based on options flow.
GEX Level Converter – Gamma Exposure Mapping for CFD Charts NASDAQ-100 edition — for US100 · NDX · NAS100 · USTECH and every Nasdaq-100 CFD equivalent
Instantly see professional options-market levels directly on your MetaTrader Nasdaq-100 CFD chart. The GEX Level Converter translates the daily Gamma Exposure (GEX) zones of the NDX options market into precise pri
The Controversial 5-Step System That Professional Traders Use To Unlock Trading Success!
Reversal Pro effectively combines price action, ideal location and reliable statistics in one smart algorithm. Understanding the market in this unique perspective allows you to recognize reversals professionally.
Discover The Secret Of Professional Traders
Get instant access www.mql5.com/en/blogs/post/716077 Copy & Paste what professional traders are doing right now!
How To Trade Step 1: Trade Setup Sta
Fractals Dynamic Fractals Dynamic – 是 Bill Williams 改進的免費分形指標,您可以在其中手動設定左側和右側的柱形數量,從而在圖表上建立獨特的模式。 现在所有基于或基于分形动态指标的交易策略都将有一个额外的信号。
此外,分形可以充当支撑位和阻力位。 在一些交易策略中,显示流动性水平。 为此,在这个版本的多分形和多帧指标 MultiFractal Levels 中引入了水平。 您会发现这个指标在任何价格图表上作为您交易的助手更具信息性,视觉性和实用性。 使用分形動態指標作為您交易系統的補充 也試試我在市面上的其他產品 https://www.mql5.com/ru/users/capitalplus/seller
如果您喜欢该指标,请对其进行评分并留下评论,这对我来说非常重要!
交易獲利豐厚!
FREE

Pips Chaser 指标的开发是为了补充你的手动交易。该指标可用于短线剥头皮和长线波段交易 // MT5 版本
特点 无重绘指标 当新数据到来时,该指标不会改变其数值 交易货币对 任何货币对 时间框架 H1是最好的,但你可以将其适应于任何时间框架 交易时间 全天候 Buffers Buy Buffer: 0 / Sell Buffer: 1
要求
使用一个ECN经纪商,并为一些头寸提供严格的点差是必须的。 不要在中等影响和高影响的新闻发布时间进行交易。
如何安装
将该指标附加到首选的交易对上(推荐H1)。
配置
指标设置 。 在这里你可以修改指标的参数以采用最适合你的策略。 附加设置 。 在这里你可以改变指标不同部分的颜色。你还可以改变警报的配置。
如何使用它
当你在图表中看到箱体突破的箭头时,你就必须进行买入或卖出交易。 当蜡烛触及趋势线时,你必须关闭交易。 当趋势线和狙击线在同一水平上相互接触时,这将是一个理想的利润水平。 当交易线远离对方时,在这种情况下,该交易将给你带来更多利润。而当交易线小于对方时,在这种情况下,该交易将给你带来较少的利润。 你必须在突破框
FREE

水平趋势PRO指标旨在搜索反转进入点到局部趋势。 它在日内烛台M15-H1上效果最好
指标信号自动交易的专家顾问: 这里
Level Trend PRO的优势:
永远不要重绘它的信号; 将其作为独立策略的可能性; 具有支撑阻力位; 它适用于股票市场,指数,石油,黄金和所有时间框架; 它在手机上具有通知功能; 该指标已证明其在真实账户交易中的有效性 信息面板显示更高时间帧的方向
如何使用水平趋势PRO指标 :
#1. 在D1或H4图表上,设置止损保护水平超出支撑-阻力水平边界 切换到较低的时间帧M5-H1。 等待信号出现,箭头指向与更高时间帧相同的方向。 在等于或大于止损水平的距离处获利
#2. 当您收到通知时,使用当前的指标信号进行交易。 通过在上一个水平的趋势之外设置止损保护#1和在当前水平的趋势之外设置止损#2来打开两个相同大小的交易 交易,直到相反的信号指标出现
#3. 使用其他无限指标进行组合交易 如果趋势线PRO指标和趋势线PRO或利润区的信号重合,则打开交易。 设置这些指标提供的止损和止盈保护水平
如果您有任何问题或希望收到私人聊天的个人邀请,
FREE

One Click Close MT4 is an EA which allows you close orders quickly. EA display on chart two buttons. The first button "Close All Positions" is using to close all opened orders. The second button "Close Profit Positions" is using to close only profitable orders. EA is closing orders for all available symbols, not only for chart symbol. In EA params you can set distance from upper chart frame (Y Offset) and from left chart frame (X Offset). For installation EA it is only need to copy One Click Clo
FREE

Harvest FX USES THE TREND WAVE INDICATOR AND IT CAN IDENTIFY THE BEGINNING AND THE END OF A NEW WAVE TREND MOVEMENT.
AS AN OSCILLATOR, THE INDICATOR IDENTIFIES THE OVERBOUGHT AND OVERSOLD ZONES.
IT WORKS GREAT TO CATCH THE SHORT TERM PRICE REVERSALS AND USES A MARTINGALE STRATEGY TO CLOSE ALL TRADES IN PROFIT.
USE DEFAULT SETTINGS ON H1 OR HIGHER TIME FRAME ON ANY PAIR FOR MORE ACCURATE TRADES
WHY THIS EA :
Smart entries calculated by 3 great strategies The EA can be run on even a $30000 a
FREE

KT Auto Support Resistance Levels:适用于 MetaTrader 4/5 的多周期支撑阻力、智能区域与水平仪表盘 摆动高点、Pivot 枢轴点、订单块、前期高低点。每个交易者标记市场的方式都不太一样,最后承受代价的往往是图表本身。把太多方法堆在同一张图上,它就不再是一张清晰的地图,而会变成噪音。 KT Auto Support Resistance Levels 正是为了解决这个问题而设计。它会同时扫描月线、周线、日线以及当前周期,然后自动把真正重要的水平直接绘制到您的 MetaTrader 图表上。当图表开始变得拥挤时,只需点击一次,就可以把这些水平合并成干净的 Smart Zones。实时面板还会持续显示价格上方和下方最近的水平,让您不必在图表上来回寻找。 可以把它看作一位永远不会疲惫的图表分析师,始终帮您标记关键位置。
它能为您做什么
从多个经过验证的来源寻找并绘制水平:摆动点、Pivot 枢轴点、前期价格以及订单块中点,覆盖多个时间周期。 当您想要更简洁的图表时,可以把彼此接近的水平合并成清晰的 Smart Zones。 保持一个实时面板,显示

-40% OFF
HERE is a FREE file for use in a LIVE DEMO account.
Telegram Group: Find the link in my profile or contact me
Huge Upgrade in:
Conditions of entry.(The same as before plus some restrictions for even better).
Added Buttons for Pause and Restart EA from chart.
Added input for Pause EA based on number of positions and restart the EA based on candle of 4H chart if it is back on trend!
Gold Stallion uses artificial intelligence to produce as better as it can entries in gold.

This indicator has been created for finding the probable reversal points of the symbol price. A small candlestick reversal pattern is used it its operation in conjunction with a filter of extremums. The indicator is not redrawn! If the extremum filter is disabled, the indicator shows all points that have a pattern. If the extremum filter is enabled, the condition works – if the history Previous bars 1 candles back contains higher candles and they are farther than the Previous bars 2 candle, such
FREE

Investment Castle EA — 趋势交易自动驾驶
Investment Castle 是一款顺势交易的智能交易系统(EA),内置了我们自己的两大工具:Investment Castle 指标和心理关键价位。它旨在免去顺势交易中的手动工作——识别市场结构、把握入场时机和管理风险——让您依据清晰的规则化计划进行交易,而非凭情绪。
它能为您做什么 自动支撑与阻力: 在每张图表上自动为您识别关键价位——无需手动画线。 心理关键价位: 入场与出场对齐价格容易反应的整数价位区域。 波动性自适应距离: 止损、目标和恢复距离会根据当前市场波动性自动调整。 可控恢复,而非盲目马丁格尔: 采用受控的止损与恢复模型,旨在抑制回撤而非累加风险。 完全可配置: 每个参数都开放且可优化——根据您的品种、周期和风险偏好进行调整。
适合人群: 既适合希望获得可靠自动化的主观交易者,也适合需要透明、可调趋势引擎的系统化交易者。
风险提示: 交易存在重大亏损风险。请务必先在模拟账户上测试,并使用您能接受的风险设置。过往表现不代表未来结果。
FREE

Auto Fibo 是一个为加强你的手动交易而开发的指标。它将自动画出黄金比例,节省你的时间,促进你的交易。 将指标附在图表上,它就会自动画出准确的黄金比例,省去你寻找临界点的麻烦。 界面会根据你的电脑调整到波段的近似高点和低点。 这个指标会纠正大多数起点和终点的选择错误。 对于每个波段,都会显示准确的价格。 警告 我只在MQL5.com上出售我的EA。如果有人与您联系,向您出售我的EA,那么他们是骗子,只想要您的钱。
另外,如果您从外部网站购买我的EA,我向您保证,它们将是假的版本,不会和原来的一样工作。 .....................................................
FREE

SuperTrend 指标是一种趋势跟随型技术工具,可以直观地显示市场趋势的反转。其线条的颜色和位置会根据价格变动自动切换,帮助交易者判断入场和离场时机。该指标结构简单,适用于手动交易和自动交易等多种交易风格。 主要特点 清晰显示趋势反转
上升趋势时,线条绘制在K线下方;下降趋势时,线条绘制在K线上方。这使得判断趋势方向和反转点变得直观易懂。 便于观察盘整到趋势的转变
有助于捕捉新趋势的初始阶段和突破区间行情的时机。 灵活的参数调整
通过调整ATR周期和乘数,可以优化不同货币对、CFD和周期上的使用效果。 多样化应用
适用于手动和自动交易,提供清晰的信号辅助交易决策。 计算逻辑 计算指定周期的平均真实波幅(ATR)。 上升趋势时显示下方线,下降趋势时显示上方线。 上升趋势线:(最高价 + 最低价) / 2 减去 ATR × 乘数。 下降趋势线:(最高价 + 最低价) / 2 加上 ATR × 乘数。 当收盘价突破这些线时,趋势方向切换,线条颜色也会随之变化。 主要用途 趋势启动时辅助进场 判断区间突破 作为止损或跟踪止损的参考 与其他指标或振荡器组合用作多重过滤 参数 参数名
FREE
HTF MACD – Trend-Aligned Signals (one subwindow, arrows on chart) What it does
This indicator keeps you trading with the higher-timeframe trend while using MACD crosses for precise entries. In a single subwindow it shows: HTF Trend Histogram — green = uptrend, red = downtrend (neutral is hidden for a cleaner view) MACD Lines — blue = MACD main, orange = MACD signal Arrows on the price chart when a valid, trend-aligned MACD cross occurs Optional alerts on bar close Entry logic (strict, closed-ba
FREE
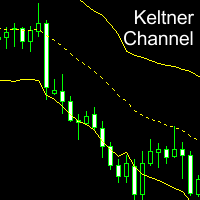
Keltner Channel is a well known indicator that not in MT4's indicators default lineup (You can get this from your broker somehow). This indicator helps you to define trend and sometimes overbought/oversold prices during flat trend. Input Description: EMAperiod: Moving Average period used for indicator. Must be higher than 1. ATRperiod: Average True Range period used for indicator. Must be higher than 1. multiplier: Multiplier used for determine channel's wide. Must be higher than 0 but may not b
FREE

We Trade Live Trend Max 500-1000 Pips Our team of engineers have programmed a great tool which we have used to success and will aid you in making better decisions when placing a trade, it is better than anything available on the market at the moment! try & Test Against other products and see for yourself how amazing this is. Our Main Objective is to help you as traders discover how you can take a simple trading setup and make consistent profits. We provide the fundamentals needed to trade the ma
FREE

SX Supply Demand Zones accurately identifies and draws high-probability Supply and Demand zones using a sophisticated algorithm. Unlike traditional indicators that clutter your chart, this indicator is designed with a focus on performance and a clean user experience.
New Unique Feature: Interactive Legend System What truly sets this indicator apart from everything else is the Interactive Control Legend. You have a professional dashboard directly on your chart that allows you to: Show/Hide: Ins
FREE
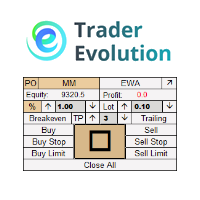
" Trader Evolution " - A utility designed for traders who use wave and technical analysis in their work. One tab of the utility is capable of money management and opening orders, and the other can help in making Elliott wave and technical analysis.
Manual (Be sure to read before purchasing) | Version for MT5
Advantages
1. Trading in a few clicks. Immediate and pending orders are available in the panel
2. Money management. The program automatically selects the appropriate lot size
3. Simplifies

RSI indicator with signal lines, at the intersection of which a corresponding notification will be issued, which can be in the form of a normal alert, or in the form of a user sound file.
The indicator also has the function of sending push-notifications and email notifications at the intersection of these levels.
The values of the levels can be set independently in the indicator settings, and, if desired, they can be changed and configured directly in the indicator window. To check the oper

Advanced Satoshimind Bitcoin BTCUSD EA MT4 - AN Agentic AI-Driven Bitcoin Trading System_Latest Version 598.10 Set file is attached in Comment_Must use_20April2026 Agentic AI-Driven Bitcoin Trading System Advanced Satoshimind is a next-generation BTCUSD Expert Advisor engineered for MetaTrader 4, powered by an Agentic AI framework designed for intelligent, adaptive decision-making in high-volatility crypto markets. Integrated Agentic AI Architecture This EA concept is built around multi-agent

МetaТrader的交易复印机4.它复制任何账户的外汇交易,头寸,订单。
这是МТ5↔️МТ4今天贸易复印机的最佳 МТ4 - МТ4, МТ5 - МТ5, МТ4 - МТ5, МТ5 - МТ4 。 独特的复制算法将所有交易从主账户复制到您的客户账户。运行速度快。严格的错误处理。一组强大的功能。 所有这些品质都合并在一个程序中 - EXP - COPYLOT。 该程序可以在多个终端绑定上运行。 在一个账户上交易的各种投资者账户中将其用作交易的同步器, - COPYLOT会将您的交易复制到其他终端。 安装 CopyLot Master - 要在帐户上安装的专家,您要从中复制职位和订单。 在终端中安装此专家,您可以从中将位置复制到投资帐户。 将任何文本标签名称指定为pathWrite(pathRead),例如“COPY”。 EA需要设置为1图表!默认情况下,我们的顾问会复制您帐户中的所有头寸和订单!
要复制您需要在第二个帐户或 Copylot客户端MT5 上安装 COPYLOT客户端MT4 的位置
注意:设置列表在我们的 特征 从有利可图的投
FREE
Binary Trader Master 是一个基于箭头的指标,可预测蜡烛的收盘价。它仅在一根蜡烛内进行分析。当蜡烛打开时,需要一些时间来进行分析并预测蜡烛的收盘价。然后它产生一个信号。该指标还允许您应用可用于分析的时间限制,这意味着您实际上可以告诉指标允许在蜡烛内进行分析的时间。该指标监控蜡烛中的特殊交易量模式。该分析实际上预测了当前 (0) 蜡烛的收盘价。由于此类蜡烛通常具有强劲的成交量,因此这些信号也具有良好的获利潜力,也可用于外汇交易。二元和外汇交易者都可以从该指标中受益。 由于指标与单个蜡烛的主体一起使用,因此指标仅在实时或视觉策略测试模式下提供信号! 信号不要重绘! 购买后请联系我!我会为您提供交易说明,免费赠送您丰厚的红利!
MetaTrader市场是一个简单方便的网站,在这里开发者可以出售自己的交易应用程序。
我们将帮助您发布您的产品,并向您解释如何为市场准备您的产品描述。市场上所有的应用程序都是加密保护并且只能在买家的电脑上运行。非法拷贝是不可能的。
