TwoLineMACD
- 指标
- Xin You Lin
- 版本: 1.3
- 激活: 5
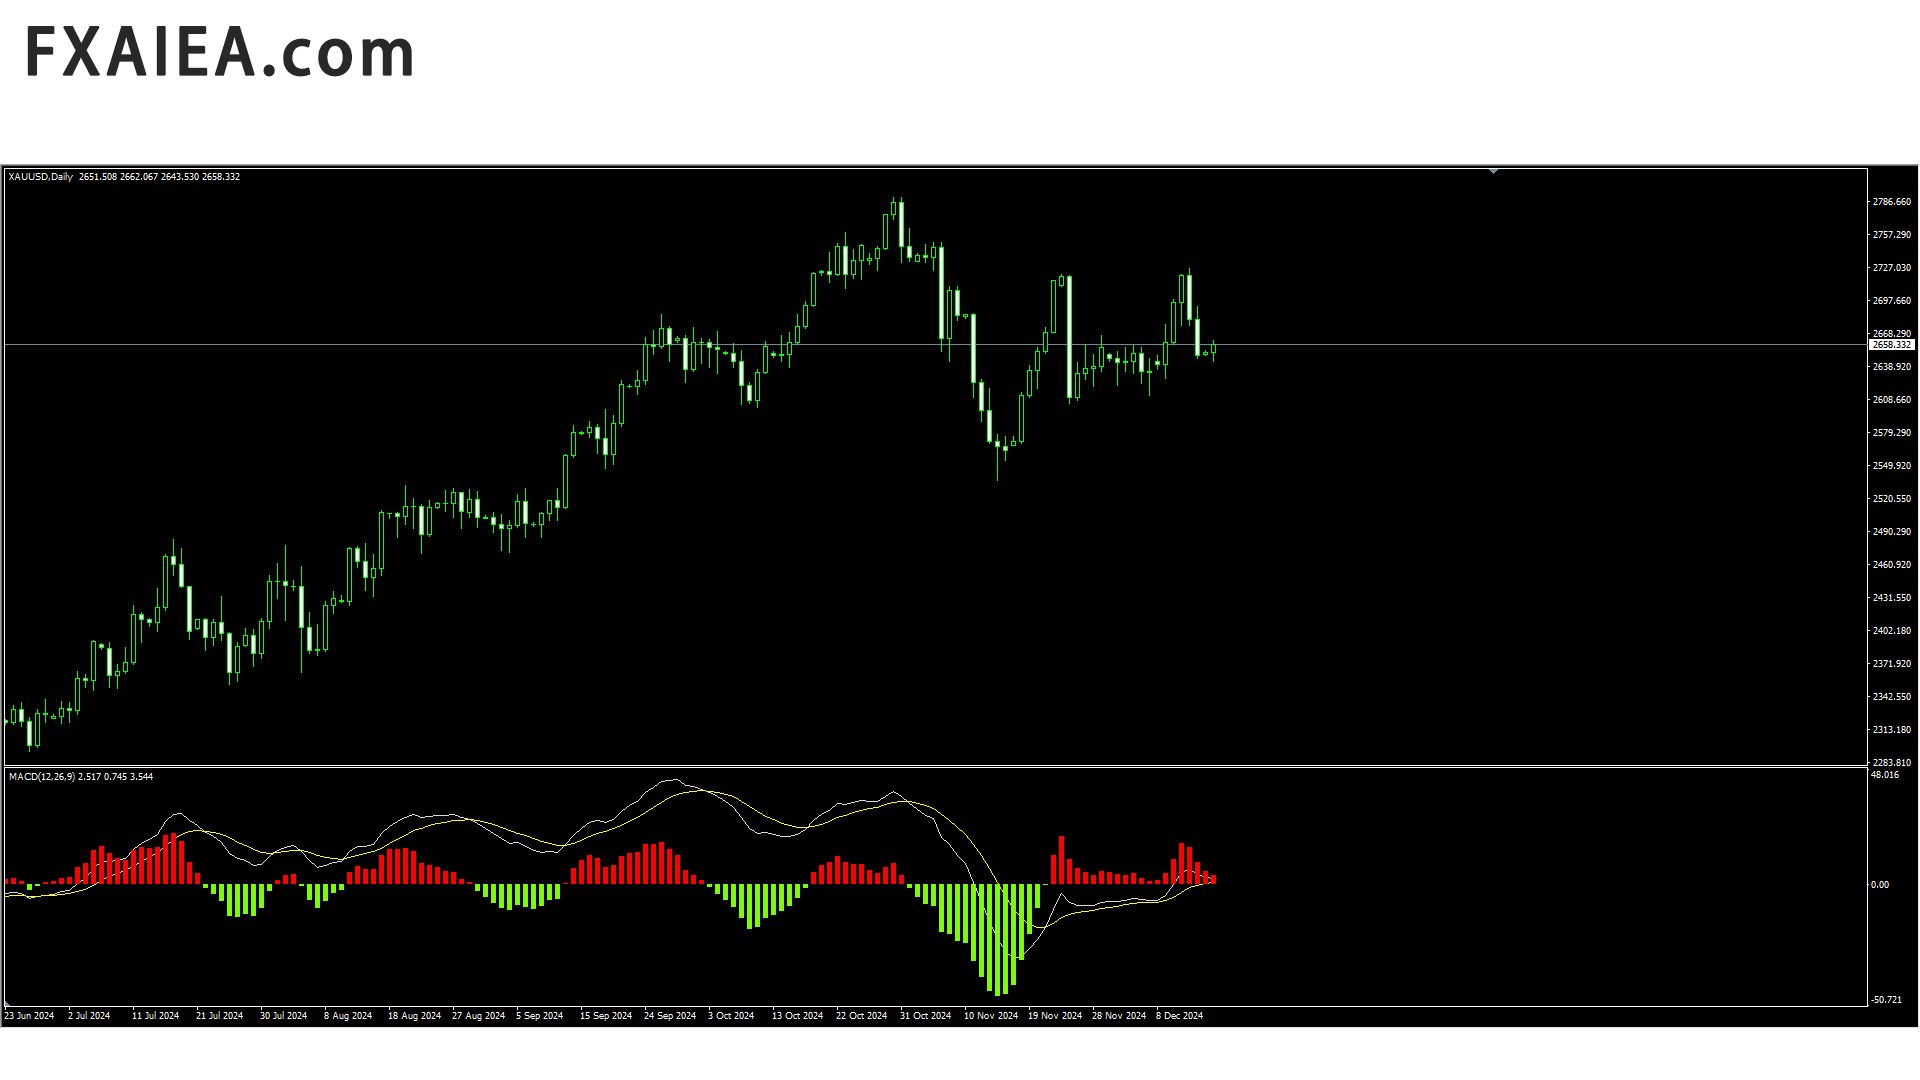
双线MACD
指标构成
- MACD 线(快线):通常由 12 周期的 EMA 减去 26 周期的 EMA 计算得出,它对价格变化较为敏感,能快速反映近期价格趋势的变化情况,其波动相对频繁,用于捕捉短期市场趋势的动态。
- 信号线(慢线):一般是 MACD 线的 9 周期 EMA,它的作用是对 MACD 线进行平滑处理,过滤掉一些短期的噪音和虚假信号,使指标信号更加稳定可靠,能更清晰地展现市场的主要趋势方向。
- 柱状图(Histogram):代表 MACD 线与信号线之间的差值。当柱状图位于零轴上方且不断伸长时,表示市场处于多头动能增强状态;反之,在零轴下方且持续变长,则反映空头动能占优。柱状图的长短变化直观地显示了市场买卖力量的对比和变化程度。
安装
- 安装步骤:在 MT4 平台上,点击 “文件” 菜单,选择 “打开数据文件夹”。进入 “MQL4” 文件夹,再进入 “Indicators” 文件夹,将下载好的双线 MACD 指标文件(.mq4 或.ex4 格式)复制粘贴到该文件夹内。关闭并重新打开 MT4 平台,在 “插入” 菜单中选择 “指标”,然后在自定义指标列表中找到刚刚安装的双线 MACD 指标并点击,即可将其添加到图表上。
参数设置
- MT4的双线 MACD 指标默认参数为 12、26、9,但交易者可以根据不同的交易品种、时间框架和个人交易策略进行调整。例如,在较为短期的交易中,如日内交易,可以适当缩短 EMA 的周期,将参数设置为 6、13、4 等,使指标对价格变化的反应更为灵敏,能及时捕捉到短期的买卖机会;而在长期趋势跟踪交易中,可增大参数值,如 20、40、10 等,以过滤掉市场短期波动,更准确地把握市场的主要趋势方向。不过,参数调整需要在充分理解市场特性和指标原理的基础上进行,避免过度优化导致指标在实际交易中失效。
交易信号解读
- 金叉与死叉:当 MACD 线从下向上穿过信号线时,形成金叉,这通常被视为买入信号,表明短期市场动能开始超过长期动能,市场可能进入上升趋势;相反,当 MACD 线从上向下穿过信号线时,出现死叉,这往往是卖出信号,意味着短期市场动能减弱,空头力量可能占据主导,市场有下跌趋势。需要注意的是,金叉和死叉信号在震荡市场中可能会出现较多的假信号,因此最好结合其他技术分析工具或市场条件进行综合判断。
- 零轴交叉:MACD 线在零轴上方表示市场处于多头行情,在零轴下方则表示处于空头行情。当 MACD 线从下向上穿越零轴时,是一个较强的多头信号,表明市场可能由空头转向多头;反之,MACD 线从上向下穿越零轴时,是空头信号,市场可能进入下跌阶段。
- 柱状图变化:柱状图的伸长和缩短也能提供交易信号。当柱状图在零轴上方且逐渐伸长时,说明多头力量在增强,可考虑继续持有多头头寸或逢低买入;若柱状图在零轴上方但开始缩短,可能预示着多头动能减弱,有回调风险,可适当减仓获利。在零轴下方,柱状图伸长表示空头力量增强,适合逢高做空;柱状图缩短则可能暗示空头动能衰竭,行情有反转的可能。