AI T3 MA Super Fill

MT4 平台 AI T3 MA Super Fill 指标使用介绍

一、指标概述


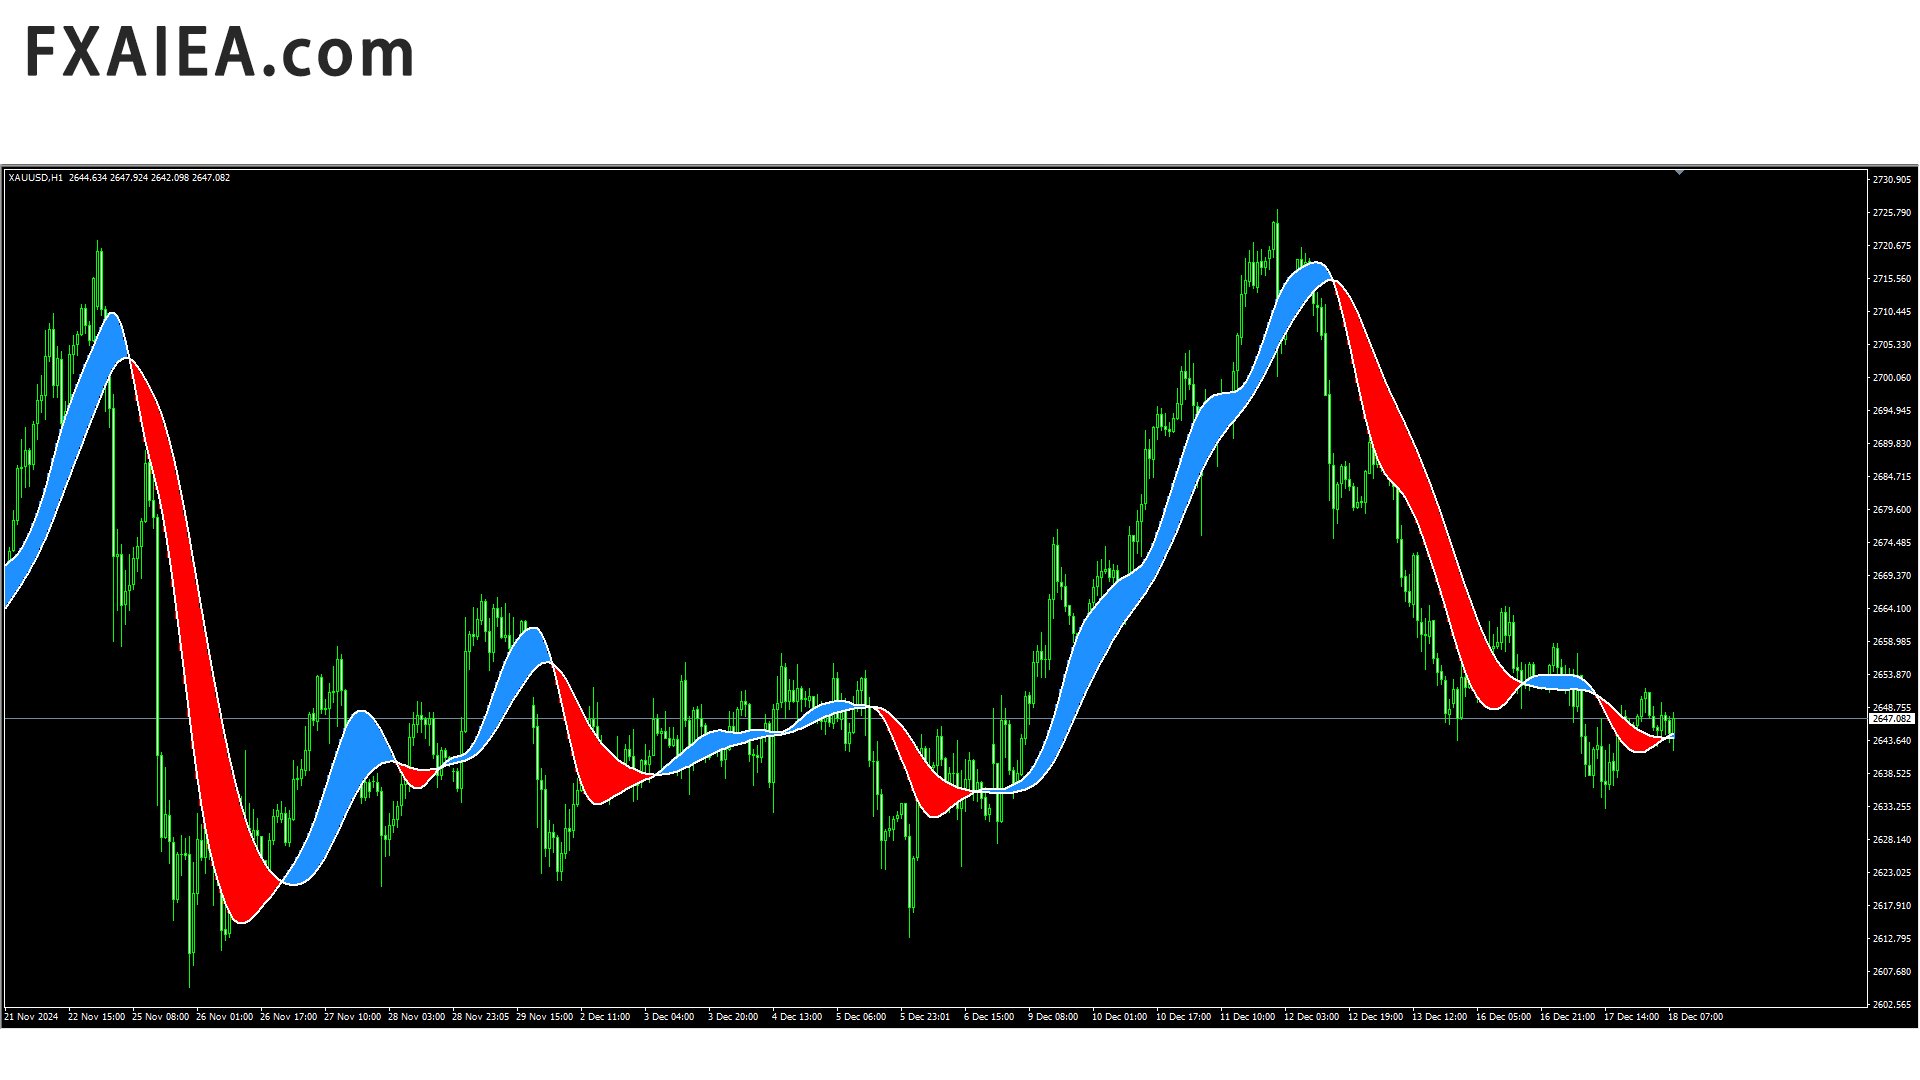
  1. AI T3 MA Super Fill 指标是一款融合了先进算法和 T3 移动平均线技术的强大分析工具,旨在为 MT4 平台的交易者提供精准的市场趋势判断和交易信号。它利用智能算法对价格数据进行深度处理,并通过独特的方式展示 T3 移动平均线的变化情况,帮助交易者更有效地把握市场动态,无论是在趋势市场还是震荡市场中,都能辅助交易者做出更明智的交易决策,适用于外汇、股票、期货、贵金属等多种金融交易市场。

二、指标构成与原理


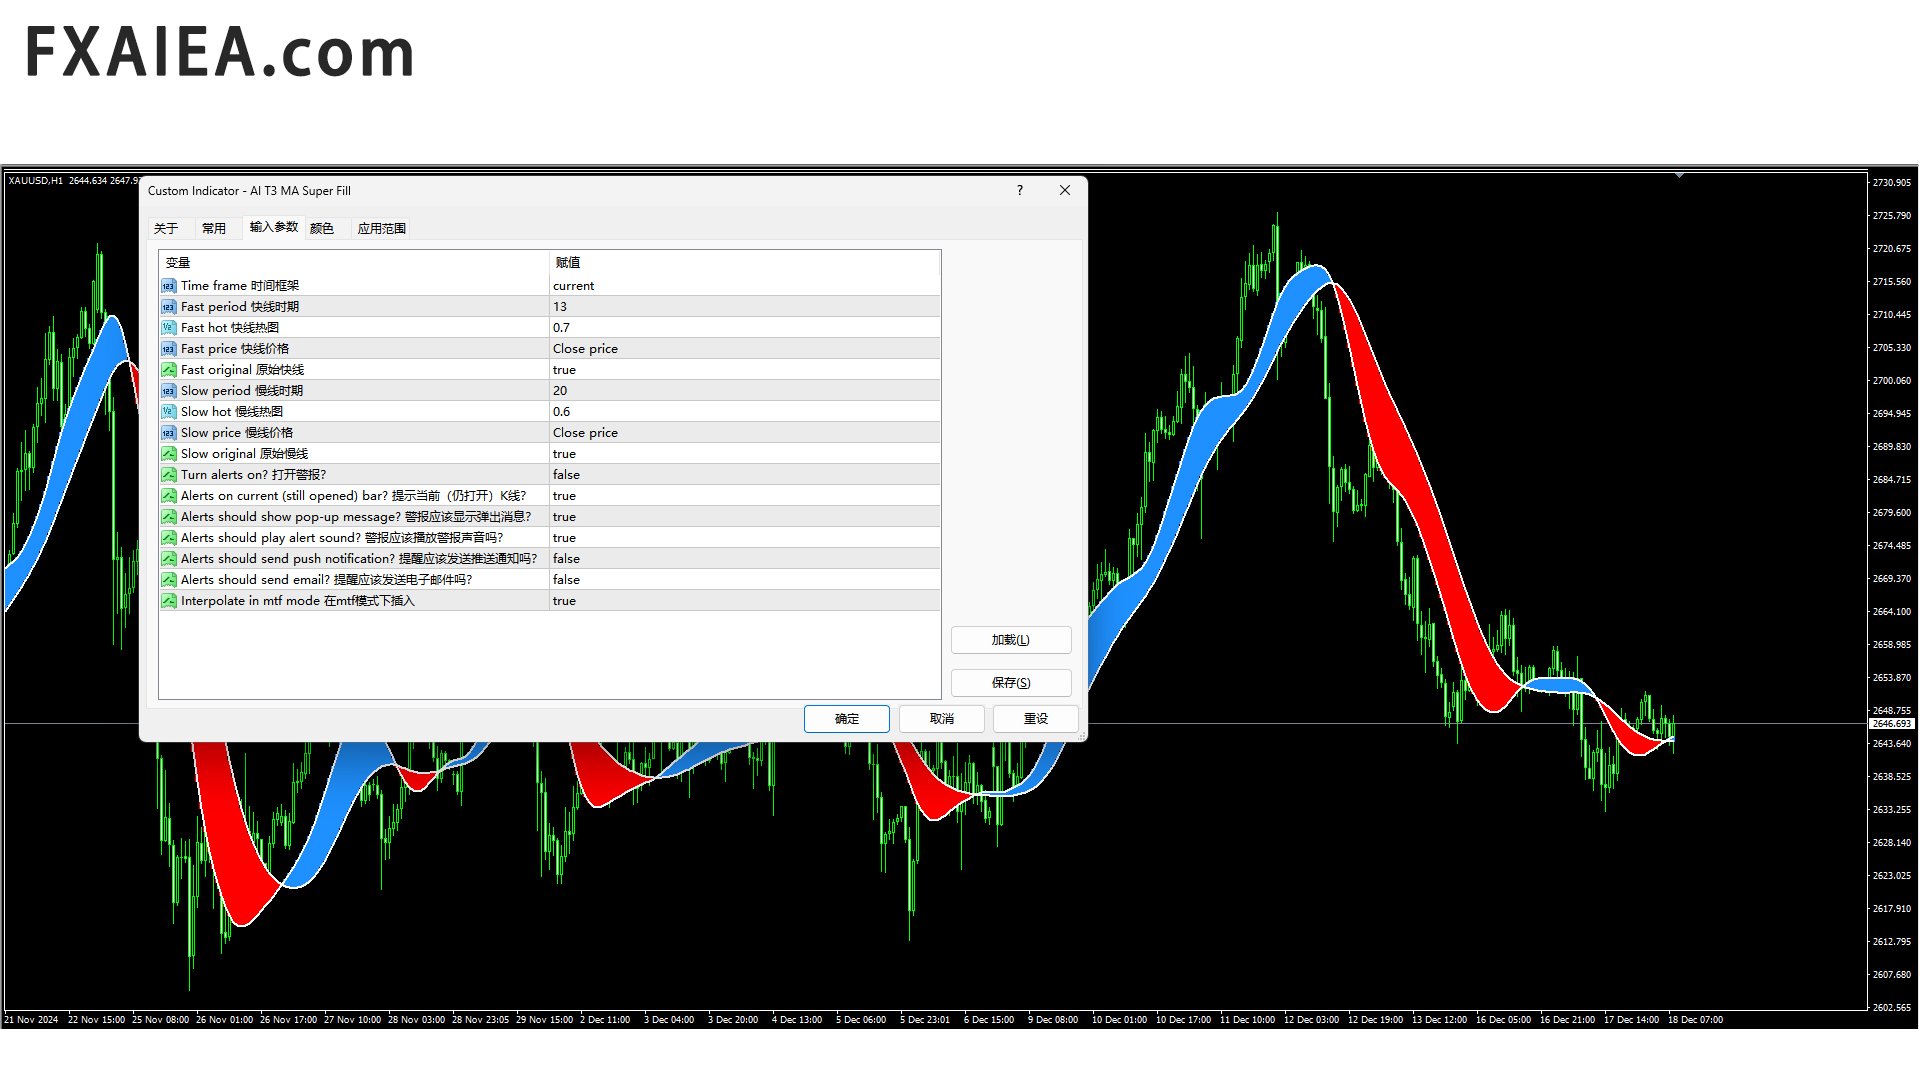
  1. T3 移动平均线组合:该指标基于 T3 移动平均线构建,通过计算不同周期的 T3 均线,如短线(13 周期)、和长线(20 周期)均线,来反映市场不同时间跨度的趋势。这些均线的交叉、分离和汇聚等情况是判断市场趋势变化的关键要素。T3 均线相较于传统均线,对近期价格数据赋予了更合理的权重,使其能够更灵敏地捕捉价格趋势的变化,同时减少了滞后性带来的影响。
  2. 智能填充区域:指标在均线之间的区域进行智能填充,形成独特的视觉效果。当市场处于多头趋势时,填充区域呈现出蓝色,直观地展示多头趋势的强度;反之,在空头趋势下,填充区域呈现红色, 直观地展示空头趋势的力度。这种填充方式不仅使交易者能够快速识别市场的主导趋势,还能从填充区域的动态变化中感知趋势的演变过程。
  3. AI 算法驱动:指标引入了人工智能算法,对市场数据进行实时监测和分析。它能够自动适应不同市场条件下的价格波动,动态调整指标的敏感度和参数设置,以提供更准确、可靠的交易信号。例如,在市场波动较为剧烈的时期,算法会适当降低指标的敏感度,避免因短期价格噪音而产生过多虚假信号;而在市场趋势较为明显时,算法会提高指标的响应速度,确保交易者不会错过重要的交易机会。

三、安装与设置


  1. 安装步骤:首先,下载 AI T3 MA Super Fill 指标文件,通常为.ex4 格式。然后,在 MT4 平台上,点击 “文件” 菜单,选择 “打开数据文件夹”,进入 “MQL4” 文件夹,接着找到 “Indicators” 文件夹,将下载好的指标文件复制粘贴到该文件夹内。关闭并重新打开 MT4 平台,在 “插入” 菜单中选择 “指标”,在自定义指标列表中找到刚刚安装的 AI T3 MA Super Fill 指标并点击,即可将其添加到图表上。
  2. 参数设置:安装完成后,交易者可以根据自己的交易策略和所交易的品种对指标参数进行调整。常见的参数包括不同周期的 T3 均线设置,如调整短期、长期均线的周期参数,以适应不同市场的波动特性和交易周期。此外,还可能有与智能算法相关的参数,如敏感度调节参数、趋势确认阈值等,这些参数可以通过反复试验和回测来优化,以找到最适合自己交易风格和市场环境的参数组合,提高指标的有效性和交易信号的准确性。

四、交易信号解读


  1. 趋势信号:当指标的填充区域持续显示为蓝色且不断扩展,同时各条 T3 均线呈现多头排列(短期均线在长期均线上方)时,表明市场处于强劲的多头趋势中,这是一个明确的买入信号或继续持有多头头寸的信号。反之,若填充区域持续为红色并加宽,且均线呈空头排列(短期均线在长期均线下方),则表示市场处于空头趋势,是卖出或持有空头头寸的信号。
  2. 趋势反转信号:如果填充区域的颜色从蓝色逐渐转变为红色,并且短期 T3 均线向下穿过中期和长期均线,这可能预示着多头趋势即将结束,空头趋势即将开始,是一个潜在的卖出信号,交易者应考虑平掉多头头寸并适时建立空头头寸。相反,当填充区域从红色变为绿色,且短期均线向上穿过中期和长期均线时,可能是空头趋势反转的信号,提示交易者寻找买入机会。
  3. 震荡信号:在市场处于震荡区间时,填充区域的颜色可能会频繁切换,均线相互缠绕,此时市场方向不明确,指标发出的信号较为混乱。在这种情况下,交易者应保持谨慎,避免盲目根据指标信号进行交易,可结合其他震荡指标,如布林带、RSI 等,或者等待市场趋势明朗后再依据指标做出交易决策。

五、优势


  1. 优势
    • 精准的趋势判断:凭借 T3 均线和智能算法的优势,能够准确地识别市场的主要趋势,减少因误判趋势而导致的交易损失,提高交易的成功率和盈利能力。
    • 及时的信号提示:通过实时监测市场数据和动态调整参数,指标能够快速响应市场变化,及时发出交易信号,使交易者能够在第一时间把握市场机会,避免错过最佳的入场和出场时机。
    • 智能适应市场变化:无论是在趋势性较强的市场还是在震荡频繁的市场,指标的 AI 算法都能自动适应市场条件,调整指标的表现,提供相对稳定和可靠的交易信号,降低了交易者因市场环境变化而需要频繁调整交易策略的难度。
    • 直观的可视化效果:独特的填充区域和均线展示方式,使市场趋势和交易信号一目了然,即使是没有丰富交易经验的新手交易者也能轻松理解和应用,有助于提高交易者的决策效率和信心。


推荐产品
Forex Gump Trend 是一種通用指標,用於高效確定趨勢方向。如果您正確識別趨勢,這就是 95% 的交易成功,因為您將能夠在價格變動的方向上開倉並從中受益。 Forex Gump Trend 指標幫助交易者以高度的效率確定當前趨勢方向,以及趨勢反轉點。趨勢的方向在圖表上用彩色線表示,趨勢反轉點用箭頭表示。該指標有許多設置,允許您在幾乎所有時間框架和所有貨幣對上使用它。 如何與外匯阿甘趨勢交易? 交易策略取決於交易者的交易風格和他所使用的貨幣對。但在全球範圍內,使用該指標的交易策略始終基於趨勢方向的開單。該指標用彩色線條顯示趨勢。因此,當指標畫出藍線時,我們建立買入交易,當指標畫出紅線時,我們建立賣出交易。考慮到大多數交易者使用剝頭皮策略進行交易的事實,我們建議將 TakeProfit 放置在最小距離。大約15-25分。這是由於剝頭皮。在剝頭皮交易中,我們的目標是在短距離內打開許多訂單。止損設置在指標信號線的上方或下方或趨勢發生變化時。我們總是以小批量交易,這使我們能夠減少交易餘額的負擔。我們嘗試每天進行大量交易以平均結果。因此,如果我們開立大量短距離交易,我們會增加盈
OtmScalpHedge
Otmane Achandir
OtmScalp EA V1 - 专为欧元、黄金和比特币设计的人工智能剥头皮交易机器人 OtmScalp EA V1 - 专为欧元、黄金和比特币设计的人工智能剥头皮交易机器人 限时优惠: 仅售499美元(原价1200美元 - 即将涨价!) 为什么OtmScalp EA V1是专业交易者的最佳选择? 稳定的每日盈利 - 专为激进但可控的剥头皮交易设计,捕捉小而频繁的盈利机会 3个专业版本 - 针对欧元货币对、黄金(XAU/USD)和比特币(BTC/USD)优化 全自动AI交易 - 无需人工干预,24/5全天候运行 智能风险管理 - 自动止损、止盈和动态手数调整 OtmScalp EA V1如何为您创造收益 高胜率策略 - AI检测微趋势并在毫秒内执行交易 低回撤 - 先进的风险管理保护您的资金 兼容任何经纪商 - 已在IC Markets、Pepperstone、RoboForex等平台测试 简单设置 - 2分钟完成安装,无需编程知识 实际表现(回测和实盘结果) 欧元/美元版本:月均15-25%(5分钟和15分钟图表) 黄金(XAU/USD)版本:月均20-35%(波动率优化) 比特币(
Copyright(c) 2019 Superfarabi EA Is the Scalping Forex Expert Advisor for MT4 Working on Timeframes (M5) Best Pair Recomended is EU/UChf=0.4 Calculation is based of Envelopes indicator ===========Rakyat +62 =========== Hak Cipta (c) 2019 Superfarabi EA Merupakan Scalping Forex Expert Advisor untuk MT4 Berjalan pada Time Frame Kecil (M5) Pair Rekomendasi adalah EU / UChf = 0,4 Perhitungan didasarkan pada indikator Envelopes
Gyroscopes
Nadiya Mirosh
Gyroscope        professional forex expert   (for EURUSD, GBPUSD, USDJPY, AUDUSD, USDCHF, EURGBP, EURJPY, NZDUSD, USDCAD, EURCHF, AUDJPY, CADJPY pairs)   alyzing the market using the Elliot Wave Index. Elliott wave theory is the interpretation of processes in financial markets through a system of visual models (waves) on price charts. The author of the theory, Ralph Elliott, identified eight variants of alternating waves (of which five are in the trend and three are against the trend). The mov
Koala Supply Demand
Ashkan Hazegh Nikrou
5 (3)
介绍 MetaTrader 4 的 Koala 供需指标(我们鼓励您分享您的评论或反馈 - 无论是正面的还是负面的 - 以便其他交易者可以从您的经验中受益。): 欢迎使用 Koala 供需指标。该指标设计用于识别不间断的供应和需求区域,有助于交易者将市场视为区域,您可以看到价格如何尊重一些强大的区域,该指标还可以在这些区域内形成价格行动信号时显示给您。 加入  Koala Trading Solution 频道  在 mql5 社区中获取有关所有 Koala 产品的最新消息,加入链接如下: https://www.mql5.com/en/channels/koalatradingsolution https://www.mql5.com/en/blogs/post/755700 重要提示 :此产品包含免费的专家顾问(EA)。购买后,请在MQL5 Messenger上与我联系,以获取与指标关联的免费EA。 重要提示: 从1.2版本开始,此指标是多时间框架供需指标,用户可以通过点击按钮在不同时间框架间切换。 主要特点: 图上回测功能:通过独特的图上回测功能体验分析的未来。只需单击图表
FREE
H4 GBPUSD Trend Scalper is a trend signal scalper The EA trades according to the trend strategy using original built-in indicator for opening and closing orders. The external inputs for limiting trading on Fridays and Mondays are available. The purpose of the strategy is to use the current trend with the most benefit. According to the results of testing and working on demo and real accounts, the best results achieved by using the Н4 timeframe on the GBP/USD pair Works on MetaTrader 4 Build 971+
Harvest GOLD
Sayan Vandenhout
Harvest GOLD USES THE TREND WAVE INDICATOR AND IT CAN IDENTIFY THE BEGINNING AND THE END OF A NEW WAVE TREND MOVEMENT. AS AN OSCILLATOR, THE INDICATOR IDENTIFIES THE OVERBOUGHT AND OVERSOLD ZONES. IT WORKS GREAT TO CATCH THE SHORT TERM PRICE REVERSALS AND USES A MARTINGALE STRATEGY TO CLOSE ALL TRADES IN PROFIT. USE DEFAULT SETTINGS ON H1 OR HIGHER TIME FRAME ON ANY PAIR FOR MORE ACCURATE TRADES WHY THIS EA : Smart entries calculated by 3 great strategies The EA can be run on even a $30000
BinaryUniversal
Andrey Spiridonov
BinaryUniversal is a signal indicator for binary options and Forex. In its work, the indicator uses a complex algorithm for generating signals. Before forming a signal, the indicator analyzes volatility, candlestick patterns, important support and resistance levels. The indicator has the ability to adjust the accuracy of the signals, which makes it possible to apply this indicator for both aggressive and conservative trading. The indicator is set in the usual way, it works on any time period and
ShinZuka
Muhammad Asyraf Bin Mohamad
Using MACD value for direction. Using RSI as reversal indicator. Using open trading hour. (Recommend Hour 10,11,15 & 19 : MT4-Time) Counter trade if signal failed. Cutloss trade if signal failed. Auto lot calculate based on target profit & takeprofit. Able to set counter trade value. Suitable for commodities & currency.  Timeframe H1. Able to set limit lot open. Able to select day to trade.
Magic EA MT4
Kyra Nickaline Watson-gordon
3 (1)
Magic EA is an Expert Advisor based on Scalping, Elliot Waves and with filters such as RSI, Stochastic and 3 other strategies managed and decided with the robot smartly. Large number of inputs and settings are tested and optimized and embedded in the program thus inputs are limited and very simple. Using EA doesn't need any professional information or Forex Trading Knowledge. EA can trade on all symbols and all time frames, using special and unique strategies developed by the author. The EA wo
Mk R
Can Pei Pu
MK_R It is based on contrary patterns for EURUSD.  Basically, it will entry using the condition of 1 buy wave and 6 sell wave of Granville's law. The EA does not use indicators, grid, martingale, arbitrage.  The EA has been proven to be profitable in the six months of 2020 and is particularly suitable for the current EURUSD market since mid-December 2020. Monitoring: https://www.mql5.com/en/signals/789229 Timeframe is M5. EA needs M1 chart,M5 chart,M15 Chart,H1 chart,H4 chart. Maxium Spread
Crosskalp1
Mikhail Bilan
Добрый День уважаемые трейдеры!  Вашему вниманию индикатор созданный и работающий на базе трендовика ADX,  для торговли на смене направления движения который учитывает коррекцию и даёт возможность на ней заработать.  Применяю этот индикатор для скальпинга. Рекомендую таймфреймы от 15 ти минутного(М15) до часового (Н1) периодов.  Красный кружок сигнал на продажу- Sell) Зелёный кружок  сигнал на покупку Buy) Чем меньше ваш таймфрейм тем меньше пунктов вы зарабатываете.   Важно выставлять стопы! !В
Scalping worm
Andrey Kozak
Scalping Worm is an essential tool for every trader aiming to improve the accuracy of their market entries and exits. With its advanced weighted moving average formula and adaptive smoothing logic, this indicator not only captures the current trend direction but also helps determine its strength and stability. The blue line signals an uptrend, while the red line indicates a downtrend, making analysis highly intuitive and visually straightforward. The main advantage of this indicator is its abili
Solemnity
Evgeniy Zhdan
The Expert Advisor identifies the beginning of a wave movement and starts working according to the direction of the new wave. It uses tight stop loss and take profit. Built-in protection against spread widening. Control of profit is performed by the tight trailing stop feature. Lot calculation is based on stop loss. For example, if stop loss is 250 points and MaxRisk = 10%, the lot size will be calculated in such a way that triggering the stop loss would lead to a loss equal to 10% of the deposi
Gold Trader Pro Indicator
Massimiliano Tuzzolino
5 (3)
Gold Trader Pro is an advanced analytical tool specifically engineered for professional trading on XAUUSD (Gold). It provides an immediate comprehensive overview of market structure across 7 different timeframes, allowing traders to identify flow direction and signal strength through a modern, draggable, and interactive interface. Key Features Multi-Timeframe Analysis: Real-time monitoring of M1, M5, M15, M30, H1, H4, and D1. Two Operational Modes: MODE_SCALPING: Optimized for fast-paced analys
FREE
Multi Universal Robot
Oleksandr Klochkov
5 (1)
我想提请你注意一个独特的,独一无二的顾问。 您可以从指标,形态,烛台形态,回归方向(趋势)和各种自定义功能(网格,尾随,重复移动等)创建自己的策略。)。 顾问函数: 1. 能够启用买/卖/buy_sell方向之一 2. 固定手数或存款的百分比 3. TR-在点数或波浪指标  4. SL-输入点数或波动指标  5. SL支持:      -抛物线追踪止损      -网格与鞅很多类型的增加(增加很多通过自己的公式)      -重新进入x2-代替第一个止损,挂单被放置在相同的手        -重新进入X3-这里接下来的两个止损被替换为挂单 6. 盈亏平衡-当N数通过时,EA会将订单移动到开行 7. 头寸反转-掉期买/卖方向 8. 海象级别是资金管理设置,即当达到此值时,EA停止打开新订单 9. 损失百分比或存款损失水平-当所有未平仓的存款头寸达到此损失百分比时,EA关闭所有交易  10. 以分钟为单位的订单延迟-在指定的分钟数(启用此功能时)后打开订单) 11. Intaymframe-默认值是当前值,即如果EA在当前图表上运行,则可以修复工作的TF
Market Maestro: Your Ideal Partner for Automated Forex Trading If you're looking for a reliable assistant for trading in the currency market, Market Maestro is exactly what you need. This modern Forex bot is built using the latest technologies and algorithms, allowing it to effectively analyze market data and make informed trading decisions in real-time. Key Features of Market Maestro 1. Multicurrency Capability for Broad Opportunities Market Maestro can work with a wide range of currency pairs,
Auto Fibo Pro m
DMITRII GRIDASOV
“Auto FIBO Pro” Crypto_Forex 指标 - 是交易中的绝佳辅助工具! - 指标自动计算并放置在图表斐波那契水平和局部趋势线(红色)上。 - 斐波那契水平指示价格可能反转的关键区域。 - 最重要的水平是 23.6%、38.2%、50% 和 61.8%。 - 您可以将其用于反转剥头皮或区域网格交易。 - 还有很多机会可以使用 Auto FIBO Pro 指标来改进您当前的系统。 - 它具有信息价差掉期显示 - 它显示所连接的外汇对的当前价差和掉期。 - 显示屏还显示账户余额、净值和保证金。 - 可以将信息价差掉期显示定位在图表的任何角落: 0 - 左上角,1 - 右上角,2 - 左下角,3 - 右下角。 点击这里查看高质量的交易机器人和指标! 这是仅在此 MQL5 网站上提供的原创产品。
Santa Scalping
Morten Kruse
2.84 (19)
Santa Scalping is a fully automated Expert Advisor with no use of martingale. Night scalping strategy. The SMA indicator filter are used for entries. This EA can be run from very small accounts. As small as 50 EUR. General Recommendations The minimum deposit is 50 USD,  default settings reccomend for eurusd m5 gmt +2 . Please use max spread 10 if you will not have orders change it to -1. Use a broker with good execution and with a spread of 2-5 points. A very fast VPS is required, preferably w
Trend PA
Mikhail Nazarenko
5 (3)
The Trend PA indicator uses   Price Action   and its own filtering algorithm to determine the trend. This approach helps to accurately determine entry points and the current trend on any timeframe. The indicator uses its own algorithm for analyzing price changes and Price Action. Which gives you the advantage of recognizing, without delay, a new nascent trend with fewer false positives. Trend filtering conditions can be selected in the settings individually for your trading style. The indicator
REX complete 3in1
Christophe Godart
This is the complete REX package. It consists of the lite, pro and ULTRA version.  Perfect for beginners and intermediates. REX complete is 100% non repaint. The strategy is based on a mix of different strategies, statistics, including pivot points, oscillators and patterns.  As the trading idea consists of a variety of some classic indicators like Momentum, Williams Percent Range, CCI, Force Index, WPR, DeMarker, CCI, RSI and Stochastic, it is clear that the fundamental indicators have being u
BSA Indicator
Ahmet Metin Yilmaz
BSA indicator is a ZigZag based indicator. This indicator is used to find the reversal level of the price. You can use the existing risk ratio and calculation timeframe in the entries by optimizing them according to your usage preference.  In lower time frames, the indicator can repaint. For healthier results, you can detect the least repainting by observing for a while according to the graphic you will apply.
Scalp88
Andrey Kozak
Scalp88 — 适用于 XAUUSD(M1)的多周期 MTF 剥头皮指标 Scalp88 是一款面向 MetaTrader 4 的专业剥头皮(Scalping)指标,专为 M1(1分钟) 的快速行情读取与顺势交易而设计。该指标融合了 动态趋势逻辑 、 ATR 波动率归一化 与 多周期一致性确认(MTF) ,以直观的箭头信号与强度百分比面板呈现交易方向与机会。 要了解如何购买该指标,请点击此链接: https://www.mql5.com/zh/articles/498 图表上你会看到什么 蓝色箭头(BUY) —— 买入信号 / 多头入场提示 红色箭头(SELL) —— 卖出信号 / 空头入场提示 趋势线(Up/Down) —— 动态趋势结构与趋势阶段切换的可视化 右上角 MTF 面板 : 显示主导方向 BUY/SELL 显示 信号强度百分比 (基于多周期信号一致性) 可选显示各周期细节(M1…W1) 工作原理(技术概述,不公开代码细节) Scalp88 采用 多层信号架构 ,每一层都用于提升过滤质量与信号稳定性: 趋势核心(Trend Core) 指标在设定周期内对局部极值(Hi
Gann Price Level
Kirill Borovskii
The indicator is designed to work on any trading platform. The program is based on proprietary algorithms and W.D.Ganna's mathematics, allowing you to calculate target levels of price movement based on three points with the highest degree of certainty. It is a great tool for stock trading. The indicator has three buttons: NEW - call up a triangle for calculation. DEL - delete the selected triangle. DELS - completely remove all constructions. The probability of achieving the goals is more than 80
GeoWprPro
Georgij Komarov
WPR by Profile, or WPR for Professionals Geo_WprPro is one of the well-known currency profile indicators. It simultaneously displays two WPR indicators with different parameters in the matrix form on all timeframes of multiple currency pairs forming the currency profile . As follows from the description, " WPR is a leading indicator that often goes ahead of the price chart. The oscillator frequently reaches extreme values before the price reversal as if anticipating that event: it almost always
This Indicator is use the ZigZag to calculate the Upper and  Lower Bound and the uptrend and the downtrned. Red for downtrend, Green for uptrend and Yellow is for the horizontal trend this horizontal trend also bookmarked the upper limited and the lower limited the the price swings.  Or in simple the Support and the Resistance level. However, You may use the Heikin Ashi to confirm the trend of the buy sell signal above. I cannot guarantee the win rate, Nevertheless, you must study well the timef
PipFinite EA Breakout EDGE
Karlo Wilson Vendiola
5 (5)
The Official Automated Version of the Reliable Indicator PipFinite Breakout EDGE EA Breakout EDGE takes the signal of PipFinite Breakout EDGE indicator and manages the trade for you. Because of numerous financial instruments to consider, many traders want the signals to be fully automated. The EA will make sure all your trades are executed from entry to exit. Saving you time and effort while maximizing your profits. The Edge of Automation Effortless price action trading is now possible acros
A simplistic indicator informing a user on RSI divergence by sending messages to mobile device and email. The indicator draws 2 vertical lines, marking two RSI extrema that formed the divergence. You get the alert, open the charts and make a decision. The indicator does not show past divergences, thus when you attach it to a chart for the first time you see nothing. Graphics and alerts will appear as soon as divergences do. Drop it in Tester to see how it works. Parameters: RSIPeriod - number of
摆脱交易迷茫,拥抱稳定收益! 您还在为寻找低风险、稳定盈利的方法而烦恼吗? 还在为判断市场方向、控制下单风险而焦虑吗? 全新跨平台套利指标,助您轻松实现稳定收益!精准捕捉套利机会,无需您操心! 跨平台套利指标 是一个强大的工具,可以实时监控同一金融产品在不同平台的价格差异,并在价差达到设定阈值时发出精准的交易信号。 您只需坐等信号入场,即可轻松实现盈利,告别市场波动带来的风险! 本指标的核心价值在于为您提供 安全正规的美国监管平台 和 优质交易品种 , 差价值稳定在0---30点差之间 (一手单量空间2000美元以上)让您在安全可靠的环境下进行低风险套利操作。 限量发售 ,机会难得! 仅售十套!每售出一套,价格将增加 200 美元! 购买后,私信我领取详细的 指标使用教程 ! 提示: 1. 使用本指标需要注册两个不同平台,请您慎重考虑是否愿意。             2. 本指标需要另一个交易平台和交易品种才能测试收益。 
BinaryScalping
Andrey Spiridonov
BinaryScalping is a professional indicator for trading binary options and scalping. The algorithm of the indicator is based on the calculation of pivot points for each time period separately, the location of the price of the trading instrument relative to the pivot points is analyzed and the probability of a trading operation is calculated. The indicator has a built-in filter of trading signals based on the global trend. The indicator is installed in the usual way and works with any trading inst
该产品的买家也购买
Miraculous 指标 – 100% 不重绘的外汇和二元期权工具,基于江恩九方图 这个视频介绍的 Miraculous 指标 是一款专为外汇和二元期权交易者开发的高精度、强大交易工具。该指标的独特之处在于它建立在传奇的 江恩九方图 和 江恩振动法则 之上,使其成为现代交易中可用的最精确预测工具之一。 Miraculous 指标 完全不重绘 ,这意味着它的信号在 K 线收盘后不会改变或消失——你看到的就是你得到的。这为交易者提供了可靠且一致的基础,让他们能够自信地进出场交易。 主要特点: 基于江恩九方图和江恩理论构建 100% 不重绘的信号系统 适用于所有时间周期(M1、M5、H1、H4、日线、周线) 适用于外汇和二元期权交易 清晰的买卖信号,准确率高 可用于剥头皮、日内交易或波段交易 兼容大多数 MT4 平台 这款工具旨在帮助初学者和专业交易者做出更好、更明智的决策。无论您是交易货币、指数还是二元期权,Miraculous 指标都将为您在市场中提供所需的优势。
訂閱指標注意事項 此信號只支援電腦版MT4 不支援MT5、手機、平板 指標只顯示當日進場箭頭 非直播指標顯示歷史箭頭 (直播為展示用) 指標為交易輔助性質 非EA自動交易 無跟單功能 指標只標示進場位置 無出場(止盈)指示 進場止損點位設定30-50 PIPS 或是前高前低做為防守 止損不需拉太遠 紅色箭頭為多方進場訊號 綠色箭頭為空方進場訊號 撐阻力強度用箭頭大小表示 此指標適用於波段策略 不適合當沖策略盤整 多空反轉時不適用 指標載入後 右下角都會預設顯示盤整 載入指標一小時後 才會顯示多空 加入Youtube頻道會員 可參加每個月一次實體抽獎活動(台灣以外地區,獎品折現金用Paypal匯出) 每月抽獎時間為非農數據公布當週的週末盤勢分析(2100) 得獎者必須抽獎時在線上,逾期不候
Pulse Scalping Line - an indicator for identifying potential pivot points. Based on this indicator, you can build an effective Martingale system. According to our statistics, the indicator gives a maximum of 4 erroneous pivot points in a series. On average, these are 2 pivot points. That is, the indicator shows a reversal, it is erroneous. This means that the second signal of the indicator will be highly accurate. Based on this information, you can build a trading system based on the Martingale
El indicador "MR BEAST ALERTAS DE LIQUIDEZ" es una herramienta avanzada diseñada para proporcionar señales y alertas sobre la liquidez del mercado basándose en una serie de indicadores técnicos y análisis de tendencias. Ideal para traders que buscan oportunidades de trading en función de la dinámica de precios y los niveles de volatilidad, este indicador ofrece una visualización clara y detallada en la ventana del gráfico de MetaTrader. Características Principales: Canal ATR Adaptativo: Calcula
BinaryIndicator
Andrey Spiridonov
BinaryIndicator is a highly accurate indicator for trading binary options. It shows excellent results in scalping. This indicator is based in multifactor analysis of trend indicators, as well as confirmation oscillators, which in the end gives an increased accuracy of signals. Advantages of the indicator Increased accuracy of signals. Excellent results when trading binary options with a short expiration time from M30 to M1 . It works on any timeframes. Works with any trade symbols. Parameters
Rtc ML Ai Predictor MT4
Muhammad Faisal Sagala
Rtc ML Ai | Predictor CORE MACHINE LEARNING ENGINE Adaptive ML Market Predictor – Multi-Bar Trend & Candle Forecast What This Indicator Does This indicator is a  real-time market prediction engine  designed to analyze price behavior and estimate  future market tendencies . Unlike conventional indicators, this system  does not rely on static parameters or historical curve-fitting , but adapts its internal state dynamically during live market operation. Instead of using static rules, the indic
FFx Engulfing Setup Alerter gives trade suggestions with Entry, Target 1, Target 2 and StopLoss. Below are the different options available: Entry suggestion - pips to be added over the break for the entry 3 different options to calculate the SL - by pips, by ATR multiplier or at the pattern High/Low 3 different options to calculate the 2 TPs - by pips, by ATR multiplier or at Risk/Reward Offset the dashboard - any place on the chart Remove the suggestion once the price reached the SL line Lines
FFx InsideBar Setup Alerter gives trade suggestions with Entry, Target 1, Target 2 and StopLoss. Below are the different options available: Entry suggestion - pips to be added over the break for the entry Minimum candle size - to avoid too close buy/sell entry suggestions 3 different options to calculate the SL - by pips, by ATR multiplier or at the pattern High/Low 3 different options to calculate the 2 TPs - by pips, by ATR multiplier or at Risk/Reward Offset the dashboard - any place on the c
FFx OutsideBar Setup Alerter gives trade suggestions with Entry, Target 1, Target 2 and StopLoss. Below are the different options available: Entry suggestion - pips to be added over the break for the entry. 3 different options to calculate the SL - by pips, by ATR multiplier or at the pattern High/Low. 3 different options to calculate the 2 TPs - by pips, by ATR multiplier or at Risk/Reward. Offset the dashboard - any place on the chart. Remove the suggestion once the price reached the SL line.
FFx PinBar Setup Alerter gives trade suggestions with Entry, Target 1, Target 2 and StopLoss. Below are the different options available: Entry suggestion - pips to be added over the break for the entry Minimum candle size - to avoid too small candles 3 different options to calculate the SL - by pips, by ATR multiplier or at the pattern High/Low 3 different options to calculate the 2 TPs - by pips, by ATR multiplier or at Risk/Reward Offset the dashboard - any place on the chart Remove the sugges
FFx MACD Divergences
Eric Venturi-Bloxs
The purpose of this new version of the MT4 standard indicator provided in your platform is to display in a sub-window multiple timeframes of the same indicator with its divergences. See the example shown in the picture below. But the display isn't like a simple MTF indicator. This is the real display of the indicator on its timeframe. Here's the options available in the FFx divergences indicator: Select the timeframes to be displayed (M1 to Monthly) Define the width (number of bars) for each tim
FFx RSI Divergences
Eric Venturi-Bloxs
The purpose of this new version of the MT4 standard indicator provided in your platform is to display in a sub-window multiple timeframes of the same indicator with its divergences. See the example shown in the picture below. But the display isn't like a simple MTF indicator. This is the real display of the indicator on its timeframe. Here's the options available in the FFx divergences indicator: Select the timeframes to be displayed (M1 to Monthly) Define the width (number of bars) for each tim
FFx CCI Divergences
Eric Venturi-Bloxs
The purpose of this new version of the MT4 standard indicator provided in your platform is to display in a sub-window multiple timeframes of the same indicator with its divergences. See the example shown in the picture below. But the display isn't like a simple MTF indicator. This is the real display of the indicator on its timeframe. Here's the options available in the FFx divergences indicator: Select the timeframes to be displayed (M1 to Monthly). Define the width (number of bars) for each ti
The FFx Dashboard MTF alerter will show you on a single chart all the timeframes (M1 to Monthly) with their own status for the indicator. 2 Alert Options: Single timeframe: each selected timeframe alert separately when a signal occurs Multi timeframes: all selected timeframes must agree for an alert to be triggered Both options have an input to select the timeframes to be used for the alert(s). How to Understand the Status: Green/Red square: histogram above/below 0 line Green square + Red bord
The FFx Dashboard MTF alerter will show you on a single chart all the timeframes (M1 to Monthly) with their own status for the indicator. 2 Alert Options: Single timeframe: each selected timeframe alert separately when a signal occurs Multi timeframes: all selected timeframes must agree for an alert to be triggered Both options have an input to select the timeframes to be used for the alert(s). How to understand the status: Green/Red square: RSI above/below 50 line Green square + Red border: R
The FFx Dashboard MTF alerter will show you on a single chart all the timeframes (M1 to Monthly) with their own status for the indicator. 2 Alert Options: Single timeframe: each selected timeframe alert separately when a signal occurs Multi timeframes: all selected timeframes must agree for an alert to be triggered Both options have an input to select the timeframes to be used for the alert(s). How to understand the status: Green/Red square: Stoch above/below 50 line Green square + Red border:
The FFx Dashboard MTF alerter will show you on a single chart all the timeframes (M1 to Monthly) with their own status for the indicator. 2 Alert Options: Single timeframe: each selected timeframe alert separately when a signal occurs Multi timeframes: all selected timeframes must agree for an alert to be triggered Both options have an input to select the timeframes to be used for the alert(s). How to understand the status: Green/Red square: Price above/below Cloud (Kumo) Green square + Red bo
The FFx Dashboard MTF alerter will show you on a single chart all the timeframes (M1 to Monthly) with their own status for the indicator. 2 Alert Options: Single timeframe: each selected timeframe alert separately when a signal occurs Multi timeframes: all selected timeframes must agree for an alert to be triggered Both options have an input to select the timeframes to be used for the alert(s). How to understand the status: Green/Red square: MA pointing Up/Down Green square + Red border: MA po
The FFx Dashboard MTF alerter will show you on a single chart all the timeframes (M1 to Monthly) with their own status for the indicator. 2 Alert Options: Single timeframe: each selected timeframe alert separately when a signal occurs. Multi timeframes: all selected timeframes must agree for an alert to be triggered. Both options have an input to select the timeframes to be used for the alert(s). How to understand the status: Green square: Price above PSAR Red square: Price below PSAR Options
The FFx Dashboard MTF alerter will show you on a single chart all the timeframes (M1 to Monthly) with their own status for the indicator. 2 Alert Options: Single timeframe: each selected timeframe alert separately when a signal occurs Multi timeframes: all selected timeframes must agree for an alert to be triggered Both options have an input to select the timeframes to be used for the alert(s). How to understand the status: Green/Red square: CCI above/below levels (ie. 100/-100) Grey square: C
The FFx Dashboard MTF alerter will show you on a single chart all the timeframes (M1 to Monthly) with their own status for the indicator. 2 Alert Options: Single timeframe: each selected timeframe alert separately when a signal occurs Multi timeframes: all selected timeframes must agree for an alert to be triggered Both options have an input to select the timeframes to be used for the alert(s). How to understand the status: Green/Red square: ADX above level Grey square: ADX below level Red bor
The FFx Dashboard MTF alerter will show you on a single chart all the timeframes (M1 to Monthly) with their own status. 2 Alert Options: Single timeframe: each selected timeframe alert separately when a signal occurs Multi timeframes: all selected timeframes must agree for an alert to be triggered Both options have an input to select the timeframes to be used for the alert(s). How to understand the status: Green/Red square: bullish/bearish candle Options available in the FFx Dashboard Alerter
THE GRAFF III
Antonin Skaryd
The [GRAFF] III manual trading system is based on multiple MetaTrader (MT4) indicators. Together, the entire PACK of GRAFF III indicators makes an advanced trading tool. The system consists of over 20 different custom-built indicators which have been carefully selected and tested in the long term to produce strong and efficient trading signals. The particular indicators are based on different mathematical formulas, so the entire system is calibrated to remove false signals from its own indicator
FFx Universal Strength Meter PRO is more than a basic strength meter. Instead of limiting the calculation to price, it can be based on any of the 19 integrated strength modes + 9 timeframes. With the FFx USM, you are able to define any period for any combination of timeframes. For example, you can set the dashboard for the last 10 candles for M15-H1-H4… Full flexibility! Very easy to interpret... It gives a great idea about which currency is weak and which is strong, so you can find the best pai
Pan PrizMA CD Phase is an analogue of the МetaТrader 5 indicator , and is an option based on the Pan PrizMA indicator. Details . Averaging by a quadric-quartic polynomial increases the smoothness of lines, adds momentum and rhythm. Extrapolation by the sinusoid function near a constant allows adjusting the delay or lead of signals. The value of the phase - wave status parameter (which is close in meaning to the trigonometric phase or the angle of the radius-vector rotation in the trigonometric p
Green Wall Arrows
Daniel Luchinger
1 (1)
The Name Green Wall : Arrows hits a lot of TP, by changing the idea of non using SL as something bad, but instead use Small TP and a lot of free Margin and Patience. Use micro TP and a lot of Free Margin with this indicator on Forex. It also can be used with Binary Options. This strategy is intended to be traded Manually. This Indicator runs on Open Bar, arrows will delete when price are against it. The only Indicator Parameter is Alerts true/false, all the rest is included inside the code. Arro
Golden Monowave
Ahmed Mohamed Ali
Golden Monowave is monowave indicator, the monowave theory is one of Elliott wave approach and one of most complicate and accurate method. Golden Monowave can shortcut many major steps to identify and describe the monowave. It works on any timeframe and with any trading instrument, including currencies, indices, futures, etc. Input Parameters initial_Bars - set the initial number of bars to calculate. wave_color - select the color of the wave. label_color - select the color of labels. temp_labe
Ticks Size
Viktor Kolmakov
This indicator displays in a separate window the difference between the number of points which increased the price, and the number of points that decreased the price during the time interval specified in the settings. The time interval for calculation is expressed as the number of bars of the chart the indicator is attached to. This approach allows you to evaluate the movement direction (growth or fall) of the instrument's price, the strength of the movement and the size of the movement in point
作者的更多信息
本EA通过智能AI程序筛选符合条件的订单,以毫秒级极速按使用者任意条件进行平仓; 帮助交易员快速 平盈利单:平仓该图表品种所有盈利的单,获得利润; 帮助交易员快速 平亏损单:平仓该图表品种所有亏损的单,截断亏损; 帮助交易员快速 SELL平仓:平仓该图表品种所有SELL的单,快速解套锁仓; 帮助交易员快速 BUY平仓:平仓该图表品种所有BUY的单, 快速解套锁仓; 帮助交易员快速 全部平仓:平仓该图表品种所有单,快速落袋为安。 智能快速平仓面板:共五个按钮 平盈利单:平仓该图表品种所有盈利的单 平亏损单:平仓该图表品种所有亏损的单 SELL平仓:平仓该图表品种所有SELL的单 BUY平仓:平仓该图表品种所有BUY的单 全部平仓:平仓该图表品种所有单
自动止盈止损: 该EA使用先进人工智能化程序, 实时跟踪图表订单情况, 精确捕捉有加载EA的图表上的成交订单, 该EA自动按设置的止盈止损给订单添加止盈止损, 大幅节省交易员下单时间,下单后EA自动添加止盈止损 也给忘记设置止盈止损的交易员添加一道保护资金的屏障。 建议: 货币对:货币 时间范围:任何 最低存款:无要求 经纪商时间:GMT +3 账户类型:ECN、Raw 或 Razor,点差极低。 重要的: 使用低点差账户以获得最佳结果非常重要! 规格: 止损SL 止盈TP 魔术号Magic Number 安装非常简单,   不需要对设置进行任何更改,默认设置非常适合大多数使用 GMT+2 和 DST 服务器时间的经纪商。 使用 VPS 让 EA 全天候 (24/7) 工作(强烈推荐) 注意: 不管是手动开仓的订单还是其他EA开启的订单, 该EA只要识别到加载图表的品种有订单, 即会给订单修改新的止盈止损, 所以建议不要同时打开其他EA,以免影响EA正常效果 免责声明: 个人账户盈亏情况,本EA概不负责
本EA主要功能:利用AI快速捕捉订单的价格,批量修改止盈止损到指定的价格位置。例如:你有5个XAUUSD的buy订单,开仓价格分别为2510、2508、2506、2504、2495,你可以通过本EA批量统一修改止盈为2530,止损为2480。祝你交易顺利! 微信:FX-AIEA QQ:2813871972 邮箱:lxy284628@163.com 微信公众号:鑫有金科FXAIEA.com   欢迎关注 (鑫有金科(FXAIEA.com)围绕A1、大数据、云计算区块链等前沿科技,为交易员、投资者和金融机构提供创新解决方案,助其在复杂市场中创造更大价值。资讯:市场动态、技术分析、交易策略和交易心态,技术:MT4/MT5指标、EA和脚本)
江恩理论 江恩理论是金融市场分析中的一种重要工具,它基于市场周期性和自然法则的假设,通过特定的技术分析工具来预测市场走势。江恩理论的主要内容包括: 市场周期 :江恩认为市场存在周期性波动,这些周期可以通过特定的时间周期和价格周期来识别。 价格和时间 :江恩理论强调价格和时间之间的相互作用,认为两者是市场分析的关键要素。 江恩角度线 :这是江恩理论中的一种重要技术分析工具,用于识别市场的支撑和阻力水平。 江恩轮中轮 :又称“江恩圆形图”,是江恩发明的另一种重要技术分析工具,用于预测市场的未来走势。 量化分析 :T3指标可能通过特定的数学模型或算法来量化市场的行为或特征。 趋势识别 :T3指标可能用于识别市场的趋势方向,包括上升趋势、下降趋势或横向整理。 交易信号 :基于T3指标的分析,投资者可能能够获得买入或卖出的交易信号。
Arbitrage Indicators 是一个专业且易于使用的外汇交易指标,它使用最新AI的套利模型的最佳交易原则。 该指标提供准确的买入和卖出信号。只适用于货币对。 它共有六个不同的指标选项, MACD、KDJ、RSI、CCI、RVI、DEMARK。 可供用户自由切换。 它直观展示了货币对的走向及反转信号,当两线交叉颜色时货币即有很大概率发生反转。 推荐时间框架: 任何时间框架都有效,但我们喜欢使用   M5、 M15、M30 和 H1   也是不错的选择! 推荐交易品种: 我们喜欢使用的最佳交易品种是   M15 时间框架上的 EURUSD 、GBPUSD 、USDJPY、 USDCAD、 AUDUSD 、USDCHF 有问题可联系:QQ:2813871972 微信: FX-AIEA 邮箱:2813871972@qq.com
AI Fibonacci Indicators (非重绘)  是一个专业且易于使用的AI全自动斐波那契生成器外汇交易指标,它使用最新AI的技术自动识别图表准确的斐波那契位置并自动在图表描绘出来。 该指标提供准确的斐波那契重要价格位置和其他高低价位置。适用于任何货币对和其他产品。 它共有七个功能切换,其中五个不同的斐波那契类型("斐波那契回调线", "斐波那契弧线", "斐波那契扇形线", "斐波那契时间区间", "斐波那契扩展线")和一个基于zigzag的填充功能以及一个生成显示(昨日高低价、上周高低价、上个月高低价)功能可供选择或组合。 推荐时间框架: 任何时间框架都有效,但我们喜欢使用   M5、 M15、M30 和 H1   也是不错的选择! 推荐交易品种: 任何品种 我们喜欢使用的最佳交易品种是   M15 时间框架上的XAUUSD、 EURUSD 、GBPUSD 、USDJPY、 USDCAD、 AUDUSD 、USDCHF 有问题可联系:QQ:2813871972 微信: FX-AIEA 邮箱:2813871972@qq.com
TwoLineMACD
Xin You Lin
双线MACD 指标构成 MACD 线(快线) :通常由 12 周期的 EMA 减去 26 周期的 EMA 计算得出,它对价格变化较为敏感,能快速反映近期价格趋势的变化情况,其波动相对频繁,用于捕捉短期市场趋势的动态。 信号线(慢线) :一般是 MACD 线的 9 周期 EMA,它的作用是对 MACD 线进行平滑处理,过滤掉一些短期的噪音和虚假信号,使指标信号更加稳定可靠,能更清晰地展现市场的主要趋势方向。 柱状图(Histogram) :代表 MACD 线与信号线之间的差值。当柱状图位于零轴上方且不断伸长时,表示市场处于多头动能增强状态;反之,在零轴下方且持续变长,则反映空头动能占优。柱状图的长短变化直观地显示了市场买卖力量的对比和变化程度。 安装 安装步骤 :在 MT4 平台上,点击 “文件” 菜单,选择 “打开数据文件夹”。进入 “MQL4” 文件夹,再进入 “Indicators” 文件夹,将下载好的双线 MACD 指标文件(.mq4 或.ex4 格式)复制粘贴到该文件夹内。关闭并重新打开 MT4 平台,在 “插入” 菜单中选择 “指标”,然后在自定义指标列表中找到刚刚安装的双线
AI Supertrend timely alerts MT4 超级趋势及时提醒指标介绍 一、指标概述 MT4 超级趋势及时提醒指标是一款专门为 MetaTrader 4 平台设计的技术分析工具,旨在帮助交易者精准地捕捉市场趋势的变化,并及时发出信号提醒交易者潜在的交易机会。它基于独特AI的算法,综合考虑价格波动、趋势强度以及市场波动性等因素,绘制出直观的趋势线和发出明确的交易信号,无论是新手还是经验丰富的交易者都能从中受益。 二、指标构成与原理 趋势线 :该指标通过对价格数据的深入分析,绘制出一条动态的趋势线,清晰地展示当前市场的主要趋势方向。当趋势线向上倾斜时,表明市场处于上升趋势;反之,当趋势线向下倾斜时,市场处于下降趋势。这条趋势线的计算方法结合了多种技术分析理论,能够有效过滤掉市场的短期噪音,准确反映市场的中期和长期趋势。 信号系统 :超级趋势及时提醒指标配备了一套先进的信号系统,包括买入信号和卖出信号。当市场条件满足特定的趋势反转或延续条件时,指标会在图表上及时弹出信号提示,以箭头、图标或文字等形式明确告知交易者应该采取的交易行动。这些信号的生成基于对价格走势、趋势线突破、
MT4CandleTime 指标介绍 MT4CandleTime 是用于 MT4 平台的指标,能以直观数字倒计时形式,显示当前 K 线的剩余时间,方便交易者把握交易节奏。 精准时间把控 :MT4CandleTime 指标为交易者提供了极为精确的 K 线剩余时间数据,使他们能够在交易过程中对时间节奏进行精细管理,避免因时间因素导致交易决策的仓促或延误,从而显著提升交易决策的精准度和计划性。 安装时,下载好.ex4 格式文件,放入 MT4 的 “MQL4/Indicators” 文件夹,重启后在 “插入 - 指标” 里添加。一般无需复杂设置,也可右键点指标选 “属性” 调整显示位置、字体等。 在日内交易、波段交易、重大事件交易等场景中都能发挥作用,帮助交易者更好地决策,精准把握进出时机,提升交易效率和成功率,且适用于不同交易风格。 使用时要注意结合所选的时间框架制定策略,同时考虑市场流动性变化对交易的影响,避免盲目操作。
MT4 平台 AI Color Gradient Volume 指标使用介绍 一、指标概述 AI Color Gradient Volume 是一款基于人工智能技术,用于 MT4 平台的创新型成交量分析指标。它通过将成交量数据转化为直观的颜色渐变图形,帮助交易者更敏锐地洞察市场中资金的流入流出情况以及买卖力量的强弱对比,从而为交易决策提供有力支持,适用于外汇、股票、期货等各类 MT4 交易市场。 二、安装与设置 安装步骤 :首先,下载 AI Color Gradient Volume 指标文件,通常为.ex4  格式。然后,在 MT4 平台上,点击 “文件” 菜单,选择 “打开数据文件夹”,进入 “MQL4” 文件夹,接着找到 “Indicators” 文件夹,将下载好的指标文件复制粘贴到该文件夹内。关闭并重新打开 MT4 平台,在 “插入” 菜单中选择 “指标”,在自定义指标列表中找到 AI Color Gradient Volume 指标并点击,即可将其添加到图表上。 参数设置 :安装完成后,指标可能会有一些默认参数设置,一般情况下这些默认设置已能满足基本交易需求,但交易者也可
MT4 ATR Stops指标介绍: 这是一个基于​​平均真实波幅(ATR)的动态支撑阻力指标​​,通过计算价格的波动性,在K线图上绘制出通道,并以直观的颜色和点状信号提示交易时机。 ​​开仓与平仓位置​​ ​​1. 开多仓(做多)​​ ​​信号特征​​:K线颜色变为​​绿色​​,且图表上出现一个​​绿色的圆点​​。 ​​逻辑​​:价格突破了由ATR计算出的动态上轨阻力,表明短期上升动能强劲。 ​​2. 开空仓(做空)​​ ​​信号特征​​:K线颜色变为​​红色​​,且图表上出现一个​​红色的圆点​​。 ​​逻辑​​:价格跌破了由ATR计算出的动态下轨支撑,表明短期下跌动能强劲。 ​​3. 平仓(多单或空单)​​ ​​信号特征​​:当出现与您当前持仓方向​​相反​​的信号时,即为平仓时机。 ​​平多仓​​:当出现​​红色​​K线和红点(即开空仓信号)时,应平掉多单。 ​​平空仓​​:当出现​​绿色​​K线和绿点(即开多仓信号)时,应平掉空单。 ​​指标特性总结​​ ​​核心设置​​:使用ATR周期10和移动平均周期2来构建一个反应灵敏的动态通道。 ​​视觉直观​​:通过Display
This "MT4 Auto Delete Pending Orders by Timeframe" EA is a high-tech trading efficiency tool designed for modern traders. It does not perform any trading or decision-making. ​ It fundamentally solves the core pain point in traditional trading where forgotten pending orders or sudden market changes lead to tied-up capital and missed new opportunities, by automatically managing order expiration . ️ Core Working Principle: Intelligent Pending Order Management The core of this EA lies in its intell
MT4 Time-Based Auto Close System EA ​ is an intelligent time-algorithm-based automated order management trading tool. Utilizing a high-tech decision-making engine, it automatically executes precise closing operations when preset holding periods expire, designed to help traders maintain strict trading discipline and avoid emotional interference   . Core Closing Modes The five core closing modes you mentioned form the cornerstone of this EA's strategic logic, allowing flexible configuration base
本EA主要功能:利用AI快速捕捉订单的价格,批量修改止盈止损到指定的价格位置。例如:你有5个XAUUSD的buy订单,开仓价格分别为2510、2508、2506、2504、2495,你可以通过本EA批量统一修改止盈为2530,止损为2480。祝你交易顺利! 微信:FX-AIEA QQ:2813871972 邮箱:lxy284628@163.com 微信公众号:鑫有金科FXAIEA.com   欢迎关注 (鑫有金科(FXAIEA.com)围绕A1、大数据、云计算区块链等前沿科技,为交易员、投资者和金融机构提供创新解决方案,助其在复杂市场中创造更大价值。资讯:市场动态、技术分析、交易策略和交易心态,技术:MT4/MT5指标、EA和脚本)
Arrow Trend indicators Trading with the trend is often one of the most basic pieces of advice given by experienced traders. In addition, experienced traders will often advise traders to prioritize the long-term trend, as prices usually follow the direction of the long-term trend. Arrow trend indicators are tools that traders can use to determine the direction of a trend toward a long-term trend. What is an arrow trend indicator? An arrow trend indicator is a trend-following technical indicator
This EA will not automatically open the position, open the position needs the user manually!! MT5 position profit/loss up to the set amount of automatic closing EA\n will open the position is the apprentice, will close the position is the master, when all your order profit reaches the amount you set, the ea will automatically help you to close the position in bulk, the loss value will also be all closed Recommended time frame: Any time frame will work, but we like to use the M5, M15, M30 and H1
This "MT5 Auto Delete Pending Orders by Timeframe" EA is a high-tech trading efficiency tool designed for modern traders. It does not perform any trading or decision-making. ​ It fundamentally solves the core pain point in traditional trading where forgotten pending orders or sudden market changes lead to tied-up capital and missed new opportunities, by automatically managing order expiration . ️ Core Working Principle: Intelligent Pending Order Management The core of this EA lies in its intell
MT5 Time-Based Auto Close System EA ​ is an intelligent time-algorithm-based automated order management trading tool. Utilizing a high-tech decision-making engine, it automatically executes precise closing operations when preset holding periods expire, designed to help traders maintain strict trading discipline and avoid emotional interference   . Core Closing Modes The five core closing modes you mentioned form the cornerstone of this EA's strategic logic, allowing flexible configuration base
筛选:
无评论
回复评论