AI Color Gradient Volume

  • 指标
  • Xin You Lin
    Xin You Lin
    • 金融从业者、经济师、EA开发工程师 在  粤港澳大湾区
    • 中国
    • 1318
    大家好!我是一名金融从业者、经济师、EA开发工程师,外文名:Golden Wings
  • 版本: 1.12
  • 激活: 5
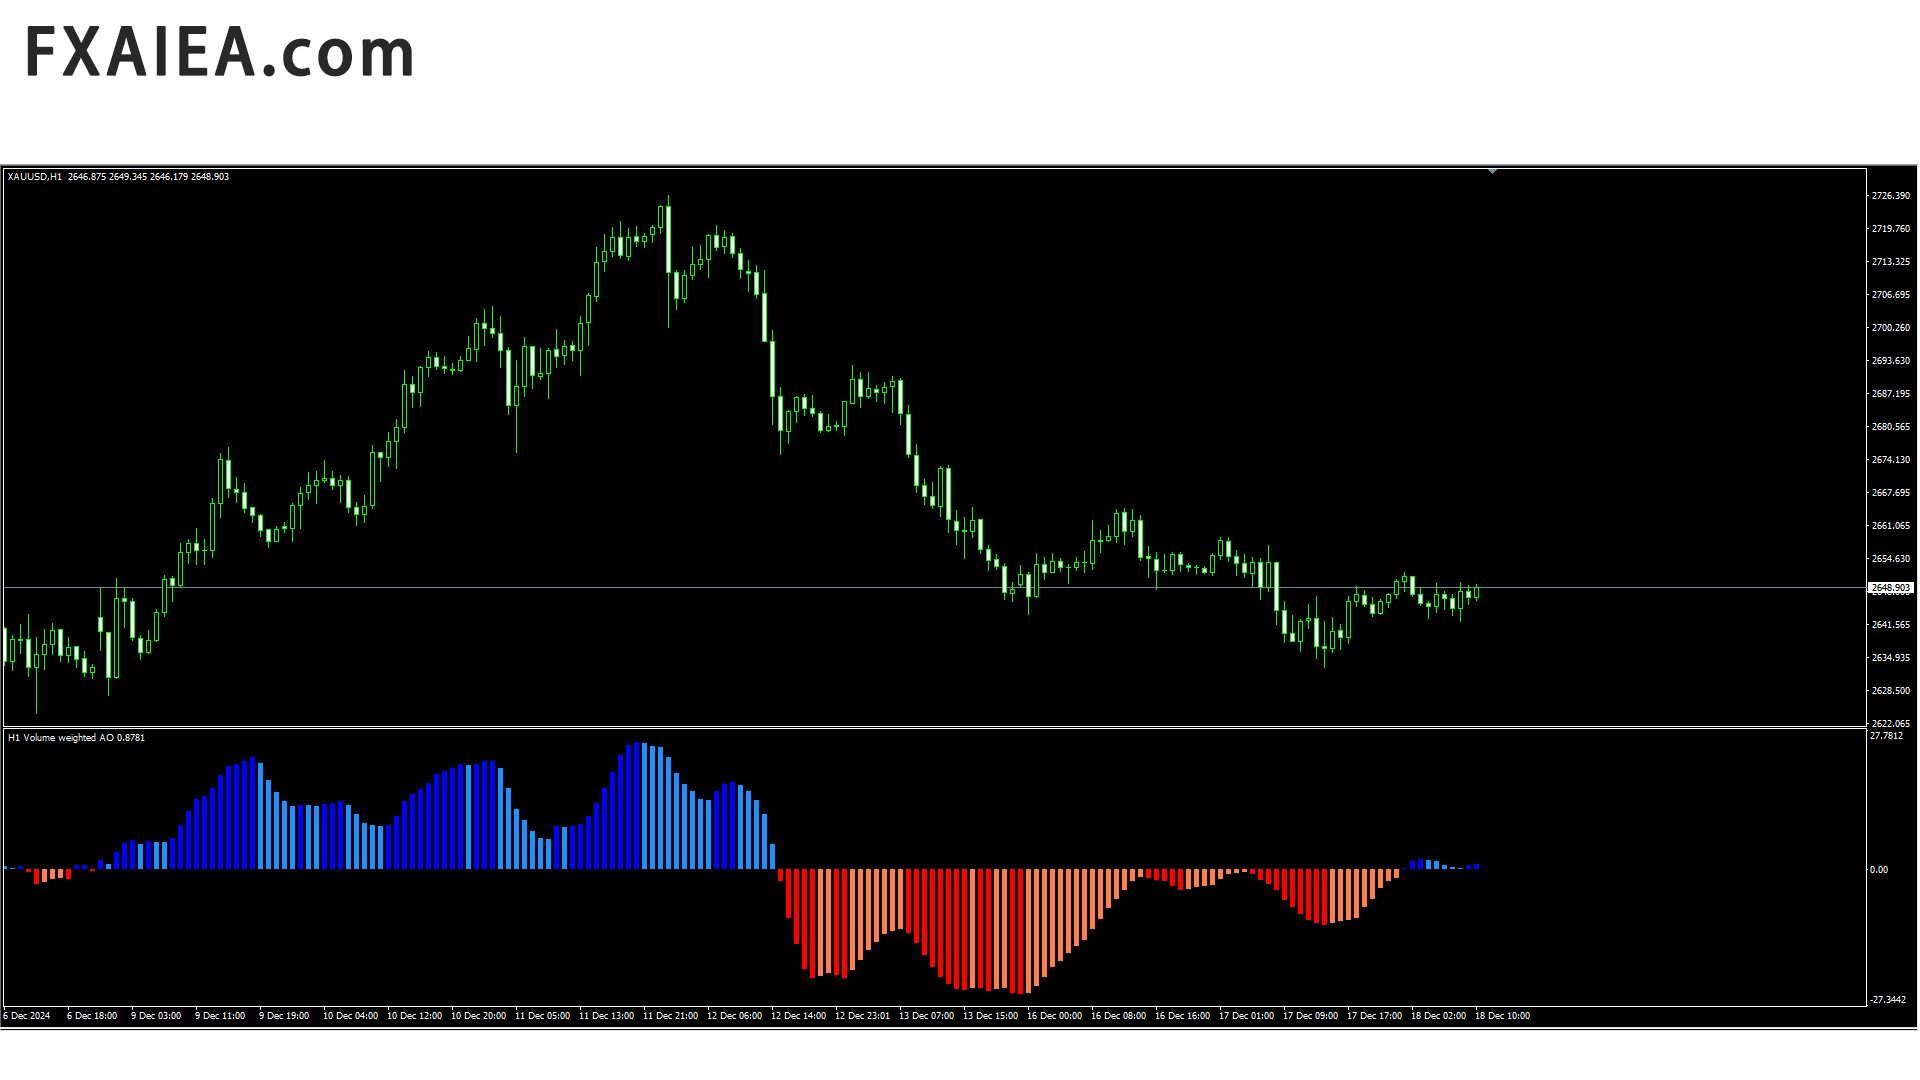
MT4 平台 AI Color Gradient Volume 指标使用介绍

一、指标概述


  1. AI Color Gradient Volume 是一款基于人工智能技术,用于 MT4 平台的创新型成交量分析指标。它通过将成交量数据转化为直观的颜色渐变图形,帮助交易者更敏锐地洞察市场中资金的流入流出情况以及买卖力量的强弱对比,从而为交易决策提供有力支持,适用于外汇、股票、期货等各类 MT4 交易市场。

二、安装与设置


  1. 安装步骤:首先,下载 AI Color Gradient Volume 指标文件,通常为.ex4  格式。然后,在 MT4 平台上,点击 “文件” 菜单,选择 “打开数据文件夹”,进入 “MQL4” 文件夹,接着找到 “Indicators” 文件夹,将下载好的指标文件复制粘贴到该文件夹内。关闭并重新打开 MT4 平台,在 “插入” 菜单中选择 “指标”,在自定义指标列表中找到 AI Color Gradient Volume 指标并点击,即可将其添加到图表上。
  2. 参数设置:安装完成后,指标可能会有一些默认参数设置,一般情况下这些默认设置已能满足基本交易需求,但交易者也可以根据自己的交易策略和市场情况进行进一步优化。

三、指标解读

  1. 颜色渐变含义:指标主要通过颜色渐变来反映成交量的变化。一般来说,较浅的颜色(如浅蓝色、淡红色等)代表相对较低的成交量,意味着市场交易活跃度较低,买卖力量相对平衡或较弱;而随着颜色逐渐加深(如深蓝色、深红色等),表示成交量不断增大,这可能暗示市场情绪正在发生变化,买卖力量对比开始失衡,有更多的资金流入市场推动价格变动。例如,在外汇市场中,如果欧元 / 美元货币对的图表上,AI Color Gradient Volume 指标的颜色从淡红色逐渐转变为深蓝色,这可能预示着该货币对的交易活跃度大幅提升,反之下跌。市场关注度增加,可能即将出现较大的价格波动,交易者需要密切关注价格走势和其他技术指标的变化,以寻找合适的交易机会。
  2. 与价格走势的配合:观察指标的颜色渐变与价格走势的关系是使用该指标的关键。当价格上涨时,如果成交量的颜色也同步变深,即成交量随着价格上升而放大,这通常是一个积极的信号,表明市场多头力量较强,上涨趋势可能具有一定的持续性,交易者可以考虑顺势做多或继续持有多头头寸;反之,若价格上涨但成交量颜色变浅甚至保持在较低水平,这可能暗示上涨动力不足,市场可能即将面临回调或反转,此时交易者应保持谨慎,考虑适当减仓或设置紧密的止损位。同样,在价格下跌过程中,成交量颜色的变化也能为判断下跌趋势的可靠性提供参考。如果价格下跌伴随着成交量颜色的加深,说明空头力量占优,下跌趋势可能延续;若价格下跌但成交量没有明显增加,可能意味着下跌趋势并不稳固,市场可能随时出现反弹。

四、交易信号与策略


  1. 趋势判断与跟随:根据指标的颜色渐变趋势,交易者可以判断市场的整体趋势方向。如果在一段时间内,成交量颜色持续保持在较深的区域,且价格呈现出明显的上升或下降趋势,这表明市场处于较强的单边趋势中。此时,交易者可以采用趋势跟随策略,在趋势确认后,沿着趋势方向进行交易,即当颜色持续加深且价格上涨时逢低买入,当颜色持续加深且价格下跌时逢高做空,并根据指标颜色的变化情况和价格的波动节奏合理设置止损和止盈位,以获取趋势行情带来的利润。
  2. 反转信号识别:当指标的颜色渐变出现明显的反转迹象时,例如从深色快速转变为浅色,或者从持续的浅色突然开始变深,这可能预示着市场趋势即将发生反转。特别是当这种颜色反转与价格走势出现背离时,反转信号的可靠性更高。例如,价格不断创出新高,但成交量的颜色却逐渐变浅,形成顶背离形态,这可能是市场顶部即将形成的信号,交易者可以考虑逐步平掉多头头寸,并在合适的时机建立空头头寸;反之,当价格不断创出新低,但成交量颜色开始变深,形成底背离形态时,可能是市场底部的信号,交易者可以寻找机会逢低买入。
  3. 震荡市场策略:在市场处于震荡区间时,指标的颜色通常会在一个相对狭窄的范围内波动,且没有明显的持续变深或变浅趋势。此时,交易者可以采用区间交易策略,在震荡区间的上下边界附近进行高抛低吸操作。当价格接近震荡区间上边界且成交量颜色没有明显放大时,可以考虑卖出;当价格接近震荡区间下边界且成交量颜色也没有明显变化时,可以考虑买入。同时,要密切关注指标颜色的突然变化,一旦出现颜色突破震荡区间的迹象,可能预示着市场将突破震荡格局,进入新的趋势行情,此时需要及时调整交易策略,跟随新的趋势方向进行交易。

五、优势与局限性


  1. 优势
    • 直观的可视化效果:通过颜色渐变将成交量数据直观地展示在图表上,使交易者能够迅速、直观地了解市场的资金动态和交易活跃度,无需复杂的数据分析即可快速把握市场情绪的变化,大大提高了交易决策的效率。
    • 智能算法适应性强:指标基于人工智能算法,能够自动适应不同市场条件和交易品种的成交量变化特征,无论是在流动性高的主流市场还是流动性相对较低的小众市场,都能准确地反映成交量的真实情况,并及时发出有效的交易信号,减少了交易者因市场变化而需要频繁调整指标参数的麻烦。
    • 综合分析能力:将成交量分析与颜色渐变的视觉效果相结合,使交易者能够更全面地分析市场信息,不仅仅关注成交量的数值大小,还能从颜色的变化趋势中获取更多关于市场买卖力量对比和趋势演变的线索,从而制定出更精准、更具前瞻性的交易策略。
  2. 局限性
    • 虚假信号风险:尽管指标采用了智能算法,但在市场出现异常波动或受到突发重大事件影响时,仍然可能会产生一些虚假的信号。例如,在突发的地缘政治事件导致市场瞬间恐慌性抛售或抢购时,成交量可能会急剧放大,指标的颜色也会迅速变深,但这种情况可能只是短期的市场异常反应,并不一定代表市场趋势的真正改变,如果交易者盲目根据这些信号进行交易,可能会遭受损失。
    • 对成交量数据的依赖:该指标的有效性在很大程度上依赖于准确的成交量数据。然而,在一些市场中,成交量数据可能存在一定的误差或不完整,特别是在外汇市场的场外交易(OTC)中,成交量数据的统计相对不如股票市场等集中交易市场精确。此外,一些交易平台可能会对成交量数据进行平滑处理或存在数据延迟等问题,这些因素都可能影响指标的准确性和可靠性,导致交易者做出错误的交易决策。


推荐产品
BoxProfile MT4
Evgeny Shevtsov
4.92 (12)
The indicator displays volume profiles based on the nesting principle. Profiles periods are pre-set so that each subsequent profile has a length twice as long as the length of the previous profile. In addition to profiles, the indicator displays volume clusters sorted by color, depending on the volume they contain. Indicator operation features The indicator works on typical timeframes from M5 to MN, but for calculations uses historical data from smaller timeframes: M1 - for timeframes from M5
FREE
该指标基于离散哈特利变换。使用此转换允许您在处理金融时间序列时应用不同的方法。该指标的一个显着特点是它的读数不是指图表上的一个点,而是指指标周期的所有点。 处理时间序列时,指标允许您选择时间序列的各种元素。过滤的第一种可能性是建立在这种方法上的——所有不必要的高频分量都被简单地丢弃。第一个图展示了这种方法的可能性,选择CutOff参数,可以选择原始时间序列的细节(红线-只剩下主要信息CutOff = 0,黄色-主要和最低频率周期CutOff = 1 , 蓝色 - 所有最高频的噪声都被丢弃 CutOff = 4 )。然而,这不是唯一的可能性——噪声分量可以通过额外的过滤来抑制。 这两个选项都在该指标中实施。它的参数是: iPeriod - 指标周期 Shift - 指标相对于当前柱的偏移。通过更改此参数,您可以评估指标过去的表现。 NoiseReduction 是一种降低噪音的方法。可能的值:none - 不抑制噪声(在这种情况下只有 CutOff 参数起作用),constant - 噪声通过常数衰减,linear - 线性噪声抑制,对数 - 对数衰减,square - 根据平方根进行
SX Supply Demand Zones accurately identifies and draws high-probability Supply and Demand zones using a sophisticated algorithm. Unlike traditional indicators that clutter your chart, this indicator is designed with a focus on performance and a clean user experience. New Unique Feature: Interactive Legend System What truly sets this indicator apart from everything else is the Interactive Control Legend. You have a professional dashboard directly on your chart that allows you to: Show/Hide: Ins
FREE
Moving VVC mt4
Andriy Sydoruk
The   Visual Volatility Clustering   indicator clusters the market based on volatility. The indicator does not redraw and gives accurate data, does not use closing prices. Uses the opening prices or the highs or lows of the previous completed bar. Therefore, all information will be clear and unambiguous. The essence of the indicator is to divide the price market into certain areas according to a similar type of volatility. This can be done in any way. In this example, the indicator is configure
Simple QM Pattern
Suvashish Halder
4.5 (2)
Simple QM Pattern is a powerful and intuitive trading indicator designed to simplify the identification of the Quasimodo (QM) trading pattern. The QM pattern is widely recognized among traders for effectively signaling potential reversals by highlighting key market structures and price action formations. This indicator helps traders easily visualize the QM pattern directly on their charts, making it straightforward even for those who are new to pattern trading. Simple QM Pattern includes dynamic
FREE
Hurst Buy and Sell Mt4
Victor Alfonso Molina Botello
Hurst Buy and Sell  This innovative indicator, inspired by xAI Grok intelligence, uses the Hurst exponent to identify the nature of the market and generate buy/sell signals. The EA for this indicator (Hurst Razer PRO EA MT5) is now available, you can see it by clicking here!  https://www.mql5.com/es/market/product/153441?source=Site+Profile+Seller  If you want more signals from the indicator, change the minimum number of bars between consecutive signals. The lower the value, the more signals it
FREE
Indicator (includes Volume Profile + Order Blocks) - a revolutionary indicator that combines two of the most powerful concepts of modern technical analysis: volume profiles and institutional players' order blocks. This tool allows you to see what is hidden from most traders and gives you a significant advantage in the market. Key benefits of the indicator: Visualization of "smart money": Clearly shows the areas of concentration of large players, highlighting areas with maximum volume in bright
Power Bears Rich
Pham Trong Khanh
Everyday trading represents a battle of buyers ("Bulls") pushing prices up and sellers ("Bears") pushing prices down. Depending on what party scores off, the day will end with a price that is higher or lower than that of the previous day. Intermediate results, first of all the highest and lowest price, allow to judge about how the battle was developing during the day. It is very important to be able to estimate the Bears Power balance since changes in this balance initially signalize about possi
DracoAI
Hua Manh Hung
DracoAI is a revolutionary automated forex trading robot based on neural network.  Loss coverage is our premium exclusive feature. DracoAI IS: THE BEST MONEY MAKING SERVICE & STABLE PASSIVE INCOME PROFIT, EVEN IF YOU DO NOT PARTICIPATE IN BIDDING FINANCIAL INDEPENDENCE AND STABILITY DracoAI IS SAFE, BECAUSE: WE GUARANTEE THE SAFETY OF YOUR FUNDS NEGATIVE RESULTS OF TRADING ARE COVERED BY OUR RESERVE FUND 100% CONFIDENTIALITY Monitoring  - most popular signal at MQL5 :  https://www.mql5.com/en/s
Market Profile 3
Hussien Abdeltwab Hussien Ryad
3 (2)
Market Profile 3 MetaTrader 4 indicator  — is a classic Market Profile implementation that can show the price density over time, outlining the most important price levels, value area, and control value of a given trading session. This indicator can be attached to timeframes between M1 and D1 and will show the Market Profile for daily, weekly, monthly, or even intraday sessions. Lower timeframes offer higher precision. Higher timeframes are recommended for better visibility. It is also possible t
FREE
The indicator allows you to trade binary options. The recommended time frame is М1 and the expiration time is 1,2,3 minutes. The indicator suitable for auto and manual trading. A possible signal is specified as a arrows above/under a candle. You should wait until the candle closes! Arrows are not re-painted Trade sessions: TOKYO section (Half-end) Currency pairs: USD/JPY Working time frame: M1 Expiration time: 1,2,3 minutes. The indicator also shows good results when using the martingale strateg
FREE
TPO Profile MT4
Kyra Nickaline Watson-gordon
5 (1)
Definition : TPO is a Time Price Opportunity. Instead of using bars or candles with an Open, High, Low, and Close price, each "bar" in a Market Profile is represented by horizontal bars against the price It is called Market Profile terminology. In other words time-price-opportunity (TPO) profiles are histograms of how much time was spent at each price within the span of the profile. By using a TPO chart, you are able to analyze the amount of trading activity, based on time, for each price level
Deep Analyst Expert Advisor    (mt5  https://www.mql5.com/en/market/product/163998 ) Deep Analyst   is a professional analytical tool powered by a specialized algorithm designed for deep analysis of market cycles and price amplitude fluctuations. By analyzing market conditions over a specific timeframe, the Expert Advisor determines price strength and amplitude using a unique indicator system based exclusively on real-time data. When the global trend and its vector shift, the algorithm automati
Buy Sell Signal Pro Looking for a precise and efficient swing detection tool that clearly identifies market structure turning points? Need consistent and easy-to-read buy and sell signals across different timeframes and instruments? Buy Sell Signal Pro  is designed to deliver accurate swing identification with a clean and practical approach, helping traders interpret price structure with confidence. Overview This indicator detects key market structure points, including: Higher Highs (HH) Higher
Effect Volume
Ivan Simonika
Volume indicator Effect Volume , in the Forex market volumes are unique (tick). This volume indicator demonstrates the level of financial and emotional involvement. When the indicator forms a new top, it indicates that buyers are stronger than sellers over a certain period of time. If the indicator decreases, this indicates that the bears are stronger. Why is it impossible to track normal volumes in Forex? The fact is that this is an over-the-counter market. Consequently, it is practically imp
Ugenesys AI MT4
Odaine Ramon Mcmillan
5 (1)
uGenesys AI - 90% Accurate Daytrading Indicator Introducing the ultimate forex trading indicator system, uGenesys AI, powered by cutting-edge AI technology and advanced analytical techniques, including Time-Series Analysis and Genetic Algorithms. Our AI-powered trading system leverages the power of time-series analysis to identify trends and patterns in historical price data, allowing traders to make informed predictions about future market movements. By analyzing vast amounts of data, our syst
Introducing the Delta Volume Profile Indicator - Unleash the Power of Institutional Precision!  Technical Indicator: Are you ready to trade like the pros? The Delta Volume Profile Indicator is no ordinary tool. It’s a high-precision, cutting-edge indicator that puts the power of institutional-grade trading in your hands. This unique indicator analyses delta volume distribution in real-time, revealing the market's hidden buy/sell imbalances that the biggest financial institutions rely on to antic
Market voleum profile
Israr Hussain Shah
Here   our more valuable tools SMC Trend Trading   ,  Easy SMC Trading  ,  Institutional SMC Architect Volume Analysis Tools  ,  Volume flow Profile  ,  Market volume profile  , FVG with Volume  , Liquidity Heatmap Profile  ,  Volume Spread Analysis The Market Profile & Volume Profile Indicator is a powerful technical analysis tool designed to visualize market activity and price distribution over specific timeframes. Unlike standard technical indicators that focus solely on price over time, th
Blahtech Supply Demand
Blahtech Limited
4.58 (36)
Was: $299  Now: $99   Supply Demand uses previous price action to identify potential imbalances between buyers and sellers. The key is to identify the better odds zones, not just the untouched ones. Blahtech Supply Demand indicator delivers functionality previously unavailable on any trading platform. This 4-in-1 indicator not only highlights the higher probability zones using a multi-criteria strength engine, but also combines it with multi-timeframe trend analysis, previously confirmed swings
Enhanced Volume Profile: The Ultimate Order Flow & Liquidity Analysis Tool Overview Enhanced Volume Profile   is an indicator for MetaTrader 5 that displays the traded volume at specific price levels over a defined period. It separates the total volume into buy and sell components, presenting them as a side-by-side histogram on the chart. This allows users to observe the volume distribution and the proportion of buy and sell volumes at each price level. Graphics Rendering The indicator uses t
FREE
Volume Profile Sniper v11.1是一款全面的市场分析工具 专业的交易方法 Volume Profile Sniper v11.1在一个指标中结合了超过15个关键过滤器,根据对市场情况的全面评估提供清晰的信号。 主要特点 成交量不平衡分析-该算法计算每个蜡烛中买家和卖家的份额,表明其中一方的优势(可配置阈值从50%到90%)。 多级信号滤波-指标考虑到: 趋势指标(EMA9/21) Rsi不包括超买/超卖区域 蜡烛图案(针杆,吸收,锤子) 支持/阻力水平(自动检测) 音量峰值,以确定主要参与者的活动 经典和放大的RSI分歧 波动率评估的ATR 用于确定趋势强度的ADX 价格行动(内部和外部酒吧) 多时间帧确认 市场结构(高点/低点) 会话过滤器(亚洲,伦敦,纽约会话) 防止新闻排放 灵活的配置系统-MinFiltersRequired参数允许您设置生成信号所需的最小数量的滤波器。 这使得可以使指标适应任何交易策略,从激进到保守。 可视化设置-您可以通过将指示器集成到图形样式中来更改箭头的大小和颜色(ArrowSize,BuyArr
AllTrendLines
Evgeniy Zhdan
4 (1)
Brief Description of the All Trend Lines Indicator The indicator analyzes the wave structure of the market. What it displays on the chart: First. Wave pivots (semaphores) • Red markers – wave highs • Yellow markers – wave lows • Yellow-green markers – additional local extremes Second. Trend lines • Purple/blue lines – trends based on highs (resistance/support) • Beige/green lines – trends based on lows • Lines are built automatically by connecting wave pivots of the same type Third. Main trend
Reverse side scalper is the manual trading system, that works on choppy(anti-trend) market. As a rule markets are on 80% choppy and only 20% is trend phase. System is based on custom step Moving and RSI and reverse pattern. System defines up movement, down movement, trend / choppy phases. Indicator plots Buy signal arrow when current direction is down and phase is trend, Sell signal arrow is plotted when currently is up movement and phase is trend. As a rule it allows to "catch" local maximum/mi
High Low Open Close MT4
Alexandre Borela
4.81 (21)
如果你象这个项目一样,就有5个饥饿审查。 这项指标采用了既定价格的公开、高、低价和关闭价格 可以对特定时间区加以调整。 许多机构和专业人士都认为这些是重要的。 贸易商可以为你了解他们可能更进一步的地点, 积极。 现有期间为: 前一日。 前一星期。 曾任Month。 曾任。 前一年。 或: 目前日。 目前周。 目前 Month。 目前配额。 今年。
FREE
Volume Delta Panel
Chantal Sala
4.8 (10)
Volume DeltaPanel is a very powerful indicator that read the supply on Market. It calculates the Delta from movement of the price and the difference of BUY volumes and SELL volumes. The Volumes are added to price and normalized to symbol points. Its special structure allows you to get all Time Frames values available on the platform MT4. Panel can show 28 instruments simultaneously all customizable according to the offer of the Broker. A good observation of this instrument can suggest great ent
Ska ZigZag BuySell
NKATEKO VUKOSI LEROY MASANGO
Ska ZigZag BuySell indicator determines the overbought and oversold regions within a trend. The indicator determines the overbought region by the candlestick high and the oversold region by the candlestick low. This indicator only gives signals with arrow and audible alerts each and every time when a new candlestick appear. To utilize the full strategy i recommend using "Ska ZigZag BuySell" together with "Ska ZigZag Line". The Ska ZigZag Line indicator is available for free. NOTE: Indicator is h
Night ghost
Dmitriy Kashevich
Night Ghost - Arrow indicator for binary options. This is a reliable assistant to you in the future! - No redrawing on the chart -Works great on EUR/USD currency pairs! -Indicator accuracy up to 90% (Especially at night) -No long setup required (Perfectly set up for Binary Options) - Not late signals - The appearance of a signal on the current candle -Perfect for M1 period (No More!) - Eye-friendly candle color (Red and Blue) -Installed Alert Working with it: - Blue arrow shows signa
Scorpion Scalper Pro
Mohamed Amine Talbi
In the age of speed, everyone wants to gets what he/she wants quickly. Trading is all about gaining money, and scalping is a way of doing it in a short time. The "Scorpion Scalper Pro" has been named on the scorpion because of its speed. The indicator serves to provide signals for the M15 timeframe. It also sends Alerts (window alert, email alert, push notification alert) whenever a buy/sell signal occurs, and the alerts are customizable (they can be turned ON or OFF). Indicator inputs : - Buy
NEXT price Actions - Daily Pivots 1. Auto Mapping Projection Price Action XAUUSD to get the most accurate setup for each Entry Lines. 2. The tool used has been customized according to Swap Pivots setup. 3. The setup that results after Mapping is suitable for Intraday 4. This setup does not need a marking and depends on SNR & SND. 5. This setup only depends 100% on the tool used. 6. This setup is very suitable for getting an Entry in a shadow candle stick. 7. This setup will also follow th
TMA AI Bands
Monique Ellen Miranda Dos Santos
该产品的买家也购买
Miraculous 指标 – 100% 不重绘的外汇和二元期权工具,基于江恩九方图 这个视频介绍的 Miraculous 指标 是一款专为外汇和二元期权交易者开发的高精度、强大交易工具。该指标的独特之处在于它建立在传奇的 江恩九方图 和 江恩振动法则 之上,使其成为现代交易中可用的最精确预测工具之一。 Miraculous 指标 完全不重绘 ,这意味着它的信号在 K 线收盘后不会改变或消失——你看到的就是你得到的。这为交易者提供了可靠且一致的基础,让他们能够自信地进出场交易。 主要特点: 基于江恩九方图和江恩理论构建 100% 不重绘的信号系统 适用于所有时间周期(M1、M5、H1、H4、日线、周线) 适用于外汇和二元期权交易 清晰的买卖信号,准确率高 可用于剥头皮、日内交易或波段交易 兼容大多数 MT4 平台 这款工具旨在帮助初学者和专业交易者做出更好、更明智的决策。无论您是交易货币、指数还是二元期权,Miraculous 指标都将为您在市场中提供所需的优势。
Breakout Arrows Mt4
Michael Oko Oboh
5 (1)
Trend Breakout Arrows Indicator The Trend Breakout Arrows Indicator is a momentum-based signal tool designed to identify potential bullish and bearish breakout opportunities. It displays clear arrow signals directly on the price chart, helping traders quickly recognize possible trend changes and continuation setups. Up Arrow (Buy Signal) A magenta up arrow appears below a candle when bullish momentum begins to strengthen. This signal indicates that buying pressure may be overtaking selling press
WanaScalper MT4
Isaac Wanasolo
1 (1)
A scalping indicator based on mathematical patterns, which on average gives signals with relatively small SL, and also occasionally helps to catch big moves in the markets (more information in the video) This indicator has three main types of notifications: The first type warns of a possible/upcoming signal on the next bar The second type indicates the presence of a ready signal to enter the market/open a position The third type is for SL and TP levels - you will be notified every time price re
Rtc ML Ai Predictor MT4
Muhammad Faisal Sagala
Rtc ML Ai | Predictor CORE MACHINE LEARNING ENGINE Adaptive ML Market Predictor – Multi-Bar Trend & Candle Forecast What This Indicator Does This indicator is a  real-time market prediction engine  designed to analyze price behavior and estimate  future market tendencies . Unlike conventional indicators, this system  does not rely on static parameters or historical curve-fitting , but adapts its internal state dynamically during live market operation. Instead of using static rules, the indic
FFx Engulfing Setup Alerter gives trade suggestions with Entry, Target 1, Target 2 and StopLoss. Below are the different options available: Entry suggestion - pips to be added over the break for the entry 3 different options to calculate the SL - by pips, by ATR multiplier or at the pattern High/Low 3 different options to calculate the 2 TPs - by pips, by ATR multiplier or at Risk/Reward Offset the dashboard - any place on the chart Remove the suggestion once the price reached the SL line Lines
FFx InsideBar Setup Alerter gives trade suggestions with Entry, Target 1, Target 2 and StopLoss. Below are the different options available: Entry suggestion - pips to be added over the break for the entry Minimum candle size - to avoid too close buy/sell entry suggestions 3 different options to calculate the SL - by pips, by ATR multiplier or at the pattern High/Low 3 different options to calculate the 2 TPs - by pips, by ATR multiplier or at Risk/Reward Offset the dashboard - any place on the c
FFx OutsideBar Setup Alerter gives trade suggestions with Entry, Target 1, Target 2 and StopLoss. Below are the different options available: Entry suggestion - pips to be added over the break for the entry. 3 different options to calculate the SL - by pips, by ATR multiplier or at the pattern High/Low. 3 different options to calculate the 2 TPs - by pips, by ATR multiplier or at Risk/Reward. Offset the dashboard - any place on the chart. Remove the suggestion once the price reached the SL line.
FFx PinBar Setup Alerter gives trade suggestions with Entry, Target 1, Target 2 and StopLoss. Below are the different options available: Entry suggestion - pips to be added over the break for the entry Minimum candle size - to avoid too small candles 3 different options to calculate the SL - by pips, by ATR multiplier or at the pattern High/Low 3 different options to calculate the 2 TPs - by pips, by ATR multiplier or at Risk/Reward Offset the dashboard - any place on the chart Remove the sugges
FFx MACD Divergences
Eric Venturi-Bloxs
The purpose of this new version of the MT4 standard indicator provided in your platform is to display in a sub-window multiple timeframes of the same indicator with its divergences. See the example shown in the picture below. But the display isn't like a simple MTF indicator. This is the real display of the indicator on its timeframe. Here's the options available in the FFx divergences indicator: Select the timeframes to be displayed (M1 to Monthly) Define the width (number of bars) for each tim
FFx RSI Divergences
Eric Venturi-Bloxs
The purpose of this new version of the MT4 standard indicator provided in your platform is to display in a sub-window multiple timeframes of the same indicator with its divergences. See the example shown in the picture below. But the display isn't like a simple MTF indicator. This is the real display of the indicator on its timeframe. Here's the options available in the FFx divergences indicator: Select the timeframes to be displayed (M1 to Monthly) Define the width (number of bars) for each tim
FFx CCI Divergences
Eric Venturi-Bloxs
The purpose of this new version of the MT4 standard indicator provided in your platform is to display in a sub-window multiple timeframes of the same indicator with its divergences. See the example shown in the picture below. But the display isn't like a simple MTF indicator. This is the real display of the indicator on its timeframe. Here's the options available in the FFx divergences indicator: Select the timeframes to be displayed (M1 to Monthly). Define the width (number of bars) for each ti
The FFx Dashboard MTF alerter will show you on a single chart all the timeframes (M1 to Monthly) with their own status for the indicator. 2 Alert Options: Single timeframe: each selected timeframe alert separately when a signal occurs Multi timeframes: all selected timeframes must agree for an alert to be triggered Both options have an input to select the timeframes to be used for the alert(s). How to Understand the Status: Green/Red square: histogram above/below 0 line Green square + Red bord
The FFx Dashboard MTF alerter will show you on a single chart all the timeframes (M1 to Monthly) with their own status for the indicator. 2 Alert Options: Single timeframe: each selected timeframe alert separately when a signal occurs Multi timeframes: all selected timeframes must agree for an alert to be triggered Both options have an input to select the timeframes to be used for the alert(s). How to understand the status: Green/Red square: RSI above/below 50 line Green square + Red border: R
The FFx Dashboard MTF alerter will show you on a single chart all the timeframes (M1 to Monthly) with their own status for the indicator. 2 Alert Options: Single timeframe: each selected timeframe alert separately when a signal occurs Multi timeframes: all selected timeframes must agree for an alert to be triggered Both options have an input to select the timeframes to be used for the alert(s). How to understand the status: Green/Red square: Stoch above/below 50 line Green square + Red border:
The FFx Dashboard MTF alerter will show you on a single chart all the timeframes (M1 to Monthly) with their own status for the indicator. 2 Alert Options: Single timeframe: each selected timeframe alert separately when a signal occurs Multi timeframes: all selected timeframes must agree for an alert to be triggered Both options have an input to select the timeframes to be used for the alert(s). How to understand the status: Green/Red square: Price above/below Cloud (Kumo) Green square + Red bo
The FFx Dashboard MTF alerter will show you on a single chart all the timeframes (M1 to Monthly) with their own status for the indicator. 2 Alert Options: Single timeframe: each selected timeframe alert separately when a signal occurs Multi timeframes: all selected timeframes must agree for an alert to be triggered Both options have an input to select the timeframes to be used for the alert(s). How to understand the status: Green/Red square: MA pointing Up/Down Green square + Red border: MA po
The FFx Dashboard MTF alerter will show you on a single chart all the timeframes (M1 to Monthly) with their own status for the indicator. 2 Alert Options: Single timeframe: each selected timeframe alert separately when a signal occurs. Multi timeframes: all selected timeframes must agree for an alert to be triggered. Both options have an input to select the timeframes to be used for the alert(s). How to understand the status: Green square: Price above PSAR Red square: Price below PSAR Options
The FFx Dashboard MTF alerter will show you on a single chart all the timeframes (M1 to Monthly) with their own status for the indicator. 2 Alert Options: Single timeframe: each selected timeframe alert separately when a signal occurs Multi timeframes: all selected timeframes must agree for an alert to be triggered Both options have an input to select the timeframes to be used for the alert(s). How to understand the status: Green/Red square: CCI above/below levels (ie. 100/-100) Grey square: C
The FFx Dashboard MTF alerter will show you on a single chart all the timeframes (M1 to Monthly) with their own status for the indicator. 2 Alert Options: Single timeframe: each selected timeframe alert separately when a signal occurs Multi timeframes: all selected timeframes must agree for an alert to be triggered Both options have an input to select the timeframes to be used for the alert(s). How to understand the status: Green/Red square: ADX above level Grey square: ADX below level Red bor
The FFx Dashboard MTF alerter will show you on a single chart all the timeframes (M1 to Monthly) with their own status. 2 Alert Options: Single timeframe: each selected timeframe alert separately when a signal occurs Multi timeframes: all selected timeframes must agree for an alert to be triggered Both options have an input to select the timeframes to be used for the alert(s). How to understand the status: Green/Red square: bullish/bearish candle Options available in the FFx Dashboard Alerter
THE GRAFF III
Charles Harper
The [GRAFF] III manual trading system is based on multiple MetaTrader (MT4) indicators. Together, the entire PACK of GRAFF III indicators makes an advanced trading tool. The system consists of over 20 different custom-built indicators which have been carefully selected and tested in the long term to produce strong and efficient trading signals. The particular indicators are based on different mathematical formulas, so the entire system is calibrated to remove false signals from its own indicator
FFx Universal Strength Meter PRO is more than a basic strength meter. Instead of limiting the calculation to price, it can be based on any of the 19 integrated strength modes + 9 timeframes. With the FFx USM, you are able to define any period for any combination of timeframes. For example, you can set the dashboard for the last 10 candles for M15-H1-H4… Full flexibility! Very easy to interpret... It gives a great idea about which currency is weak and which is strong, so you can find the best pai
THIS IS AN INTERMARKET, NON-MOMENTUM INDICATOR THAT SPECIFICALLY PREDICTS MOVES IN EURUSD, AND EURUSD ONLY, WITH EXTREMELY HIGH ACCURACY. WE HAVE SEVERAL DIFFERENT VERSIONS, VARIANATS OF THIS INDICATOR. THEY ALL USE 6 CURRENCY PAIRS TO PREDICT THE NEXT DAILY TREND IN EURUSD LONG BEFORE IT STARTS.  THE OVERALL ALGORITHM HAS BEEN WORKING GOOD SINCE 2020. This indicator identifies reversal conditions by monitoring intermarket relationships that historically precede price turning points. Rather th
Pan PrizMA CD Phase is an analogue of the МetaТrader 5 indicator , and is an option based on the Pan PrizMA indicator. Details . Averaging by a quadric-quartic polynomial increases the smoothness of lines, adds momentum and rhythm. Extrapolation by the sinusoid function near a constant allows adjusting the delay or lead of signals. The value of the phase - wave status parameter (which is close in meaning to the trigonometric phase or the angle of the radius-vector rotation in the trigonometric p
Ticks Size
Viktor Kolmakov
This indicator displays in a separate window the difference between the number of points which increased the price, and the number of points that decreased the price during the time interval specified in the settings. The time interval for calculation is expressed as the number of bars of the chart the indicator is attached to. This approach allows you to evaluate the movement direction (growth or fall) of the instrument's price, the strength of the movement and the size of the movement in point
FFx Basket Scanner
Eric Venturi-Bloxs
MetaTrader 5 version available here : https://www.mql5.com/en/market/product/24882 FFx Basket Scanner is a global tool scanning all pairs and all timeframes over up to five indicators among the 16 available. You will clearly see which currencies to avoid trading and which ones to focus on. Once a currency goes into an extreme zone (e.g. 20/80%), you can trade the whole basket with great confidence. Another way to use it is to look at two currencies (weak vs strong) to find the best single pairs
NostradamusMT4
Andrey Spiridonov
1 (1)
NostradamusMT4 is a powerful indicator from the set of professional trader. The indicator is based on Andrei Spiridonov's original price calculation method (ESTIMATED PRICE) for the current candle price. Advantages The indicator does not redraw. It works on any timeframes. Works with any trading instruments. Perfectly suitable for scalping and trading binary options. Parameters Color - color of the ESTIMATED PRICE FUTURE line. How to work with the indicator The indicator forms the ESTIMATED P
FFx Pivot SR Suite PRO
Eric Venturi-Bloxs
MetaTrader 5 version available here: https://www.mql5.com/en/market/product/25794 FFx Pivot SR Suite PRO is a complete suite for support and resistance levels. Support and Resistance are the most used levels in all kinds of trading. Can be used to find reversal trend, to set targets and stop, etc. The indicator is fully flexible directly from the chart 4 periods to choose for the calculation: 4Hours, Daily, Weekly and Monthly 4 formulas to choose for the calculation: Classic, Camarilla, Fibonac
作者的更多信息
本EA通过智能AI程序筛选符合条件的订单,以毫秒级极速按使用者任意条件进行平仓; 帮助交易员快速 平盈利单:平仓该图表品种所有盈利的单,获得利润; 帮助交易员快速 平亏损单:平仓该图表品种所有亏损的单,截断亏损; 帮助交易员快速 SELL平仓:平仓该图表品种所有SELL的单,快速解套锁仓; 帮助交易员快速 BUY平仓:平仓该图表品种所有BUY的单, 快速解套锁仓; 帮助交易员快速 全部平仓:平仓该图表品种所有单,快速落袋为安。 智能快速平仓面板:共五个按钮 平盈利单:平仓该图表品种所有盈利的单 平亏损单:平仓该图表品种所有亏损的单 SELL平仓:平仓该图表品种所有SELL的单 BUY平仓:平仓该图表品种所有BUY的单 全部平仓:平仓该图表品种所有单
自动止盈止损: 该EA使用先进人工智能化程序, 实时跟踪图表订单情况, 精确捕捉有加载EA的图表上的成交订单, 该EA自动按设置的止盈止损给订单添加止盈止损, 大幅节省交易员下单时间,下单后EA自动添加止盈止损 也给忘记设置止盈止损的交易员添加一道保护资金的屏障。 建议: 货币对:货币 时间范围:任何 最低存款:无要求 经纪商时间:GMT +3 账户类型:ECN、Raw 或 Razor,点差极低。 重要的: 使用低点差账户以获得最佳结果非常重要! 规格: 止损SL 止盈TP 魔术号Magic Number 安装非常简单,   不需要对设置进行任何更改,默认设置非常适合大多数使用 GMT+2 和 DST 服务器时间的经纪商。 使用 VPS 让 EA 全天候 (24/7) 工作(强烈推荐) 注意: 不管是手动开仓的订单还是其他EA开启的订单, 该EA只要识别到加载图表的品种有订单, 即会给订单修改新的止盈止损, 所以建议不要同时打开其他EA,以免影响EA正常效果 免责声明: 个人账户盈亏情况,本EA概不负责
本EA主要功能:利用AI快速捕捉订单的价格,批量修改止盈止损到指定的价格位置。例如:你有5个XAUUSD的buy订单,开仓价格分别为2510、2508、2506、2504、2495,你可以通过本EA批量统一修改止盈为2530,止损为2480。祝你交易顺利! 微信:FX-AIEA QQ:2813871972 邮箱:lxy284628@163.com 微信公众号:鑫有金科FXAIEA.com   欢迎关注 (鑫有金科(FXAIEA.com)围绕A1、大数据、云计算区块链等前沿科技,为交易员、投资者和金融机构提供创新解决方案,助其在复杂市场中创造更大价值。资讯:市场动态、技术分析、交易策略和交易心态,技术:MT4/MT5指标、EA和脚本)
江恩理论 江恩理论是金融市场分析中的一种重要工具,它基于市场周期性和自然法则的假设,通过特定的技术分析工具来预测市场走势。江恩理论的主要内容包括: 市场周期 :江恩认为市场存在周期性波动,这些周期可以通过特定的时间周期和价格周期来识别。 价格和时间 :江恩理论强调价格和时间之间的相互作用,认为两者是市场分析的关键要素。 江恩角度线 :这是江恩理论中的一种重要技术分析工具,用于识别市场的支撑和阻力水平。 江恩轮中轮 :又称“江恩圆形图”,是江恩发明的另一种重要技术分析工具,用于预测市场的未来走势。 量化分析 :T3指标可能通过特定的数学模型或算法来量化市场的行为或特征。 趋势识别 :T3指标可能用于识别市场的趋势方向,包括上升趋势、下降趋势或横向整理。 交易信号 :基于T3指标的分析,投资者可能能够获得买入或卖出的交易信号。
Arbitrage Indicators 是一个专业且易于使用的外汇交易指标,它使用最新AI的套利模型的最佳交易原则。 该指标提供准确的买入和卖出信号。只适用于货币对。 它共有六个不同的指标选项, MACD、KDJ、RSI、CCI、RVI、DEMARK。 可供用户自由切换。 它直观展示了货币对的走向及反转信号,当两线交叉颜色时货币即有很大概率发生反转。 推荐时间框架: 任何时间框架都有效,但我们喜欢使用   M5、 M15、M30 和 H1   也是不错的选择! 推荐交易品种: 我们喜欢使用的最佳交易品种是   M15 时间框架上的 EURUSD 、GBPUSD 、USDJPY、 USDCAD、 AUDUSD 、USDCHF 有问题可联系:QQ:2813871972 微信: FX-AIEA 邮箱:2813871972@qq.com
AI Fibonacci Indicators (非重绘)  是一个专业且易于使用的AI全自动斐波那契生成器外汇交易指标,它使用最新AI的技术自动识别图表准确的斐波那契位置并自动在图表描绘出来。 该指标提供准确的斐波那契重要价格位置和其他高低价位置。适用于任何货币对和其他产品。 它共有七个功能切换,其中五个不同的斐波那契类型("斐波那契回调线", "斐波那契弧线", "斐波那契扇形线", "斐波那契时间区间", "斐波那契扩展线")和一个基于zigzag的填充功能以及一个生成显示(昨日高低价、上周高低价、上个月高低价)功能可供选择或组合。 推荐时间框架: 任何时间框架都有效,但我们喜欢使用   M5、 M15、M30 和 H1   也是不错的选择! 推荐交易品种: 任何品种 我们喜欢使用的最佳交易品种是   M15 时间框架上的XAUUSD、 EURUSD 、GBPUSD 、USDJPY、 USDCAD、 AUDUSD 、USDCHF 有问题可联系:QQ:2813871972 微信: FX-AIEA 邮箱:2813871972@qq.com
TwoLineMACD
Xin You Lin
双线MACD 指标构成 MACD 线(快线) :通常由 12 周期的 EMA 减去 26 周期的 EMA 计算得出,它对价格变化较为敏感,能快速反映近期价格趋势的变化情况,其波动相对频繁,用于捕捉短期市场趋势的动态。 信号线(慢线) :一般是 MACD 线的 9 周期 EMA,它的作用是对 MACD 线进行平滑处理,过滤掉一些短期的噪音和虚假信号,使指标信号更加稳定可靠,能更清晰地展现市场的主要趋势方向。 柱状图(Histogram) :代表 MACD 线与信号线之间的差值。当柱状图位于零轴上方且不断伸长时,表示市场处于多头动能增强状态;反之,在零轴下方且持续变长,则反映空头动能占优。柱状图的长短变化直观地显示了市场买卖力量的对比和变化程度。 安装 安装步骤 :在 MT4 平台上,点击 “文件” 菜单,选择 “打开数据文件夹”。进入 “MQL4” 文件夹,再进入 “Indicators” 文件夹,将下载好的双线 MACD 指标文件(.mq4 或.ex4 格式)复制粘贴到该文件夹内。关闭并重新打开 MT4 平台,在 “插入” 菜单中选择 “指标”,然后在自定义指标列表中找到刚刚安装的双线
AI Supertrend timely alerts MT4 超级趋势及时提醒指标介绍 一、指标概述 MT4 超级趋势及时提醒指标是一款专门为 MetaTrader 4 平台设计的技术分析工具,旨在帮助交易者精准地捕捉市场趋势的变化,并及时发出信号提醒交易者潜在的交易机会。它基于独特AI的算法,综合考虑价格波动、趋势强度以及市场波动性等因素,绘制出直观的趋势线和发出明确的交易信号,无论是新手还是经验丰富的交易者都能从中受益。 二、指标构成与原理 趋势线 :该指标通过对价格数据的深入分析,绘制出一条动态的趋势线,清晰地展示当前市场的主要趋势方向。当趋势线向上倾斜时,表明市场处于上升趋势;反之,当趋势线向下倾斜时,市场处于下降趋势。这条趋势线的计算方法结合了多种技术分析理论,能够有效过滤掉市场的短期噪音,准确反映市场的中期和长期趋势。 信号系统 :超级趋势及时提醒指标配备了一套先进的信号系统,包括买入信号和卖出信号。当市场条件满足特定的趋势反转或延续条件时,指标会在图表上及时弹出信号提示,以箭头、图标或文字等形式明确告知交易者应该采取的交易行动。这些信号的生成基于对价格走势、趋势线突破、
MT4 平台 AI T3 MA Super Fill 指标使用介绍 一、指标概述 AI T3 MA Super Fill 指标是一款融合了先进算法和 T3 移动平均线技术的强大分析工具,旨在为 MT4 平台的交易者提供精准的市场趋势判断和交易信号。它利用智能算法对价格数据进行深度处理,并通过独特的方式展示 T3 移动平均线的变化情况,帮助交易者更有效地把握市场动态,无论是在趋势市场还是震荡市场中,都能辅助交易者做出更明智的交易决策,适用于外汇、股票、期货、贵金属等多种金融交易市场。 二、指标构成与原理 T3 移动平均线组合 :该指标基于 T3 移动平均线构建,通过计算不同周期的 T3 均线,如短线(13 周期)、和长线(20 周期)均线,来反映市场不同时间跨度的趋势。这些均线的交叉、分离和汇聚等情况是判断市场趋势变化的关键要素。T3 均线相较于传统均线,对近期价格数据赋予了更合理的权重,使其能够更灵敏地捕捉价格趋势的变化,同时减少了滞后性带来的影响。 智能填充区域 :指标在均线之间的区域进行智能填充,形成独特的视觉效果。当市场处于多头趋势时,填充区域呈现出蓝色,直观地展示多头趋势的
MT4CandleTime 指标介绍 MT4CandleTime 是用于 MT4 平台的指标,能以直观数字倒计时形式,显示当前 K 线的剩余时间,方便交易者把握交易节奏。 精准时间把控 :MT4CandleTime 指标为交易者提供了极为精确的 K 线剩余时间数据,使他们能够在交易过程中对时间节奏进行精细管理,避免因时间因素导致交易决策的仓促或延误,从而显著提升交易决策的精准度和计划性。 安装时,下载好.ex4 格式文件,放入 MT4 的 “MQL4/Indicators” 文件夹,重启后在 “插入 - 指标” 里添加。一般无需复杂设置,也可右键点指标选 “属性” 调整显示位置、字体等。 在日内交易、波段交易、重大事件交易等场景中都能发挥作用,帮助交易者更好地决策,精准把握进出时机,提升交易效率和成功率,且适用于不同交易风格。 使用时要注意结合所选的时间框架制定策略,同时考虑市场流动性变化对交易的影响,避免盲目操作。
MT4 ATR Stops指标介绍: 这是一个基于​​平均真实波幅(ATR)的动态支撑阻力指标​​,通过计算价格的波动性,在K线图上绘制出通道,并以直观的颜色和点状信号提示交易时机。 ​​开仓与平仓位置​​ ​​1. 开多仓(做多)​​ ​​信号特征​​:K线颜色变为​​绿色​​,且图表上出现一个​​绿色的圆点​​。 ​​逻辑​​:价格突破了由ATR计算出的动态上轨阻力,表明短期上升动能强劲。 ​​2. 开空仓(做空)​​ ​​信号特征​​:K线颜色变为​​红色​​,且图表上出现一个​​红色的圆点​​。 ​​逻辑​​:价格跌破了由ATR计算出的动态下轨支撑,表明短期下跌动能强劲。 ​​3. 平仓(多单或空单)​​ ​​信号特征​​:当出现与您当前持仓方向​​相反​​的信号时,即为平仓时机。 ​​平多仓​​:当出现​​红色​​K线和红点(即开空仓信号)时,应平掉多单。 ​​平空仓​​:当出现​​绿色​​K线和绿点(即开多仓信号)时,应平掉空单。 ​​指标特性总结​​ ​​核心设置​​:使用ATR周期10和移动平均周期2来构建一个反应灵敏的动态通道。 ​​视觉直观​​:通过Display
This "MT4 Auto Delete Pending Orders by Timeframe" EA is a high-tech trading efficiency tool designed for modern traders. It does not perform any trading or decision-making. ​ It fundamentally solves the core pain point in traditional trading where forgotten pending orders or sudden market changes lead to tied-up capital and missed new opportunities, by automatically managing order expiration . ️ Core Working Principle: Intelligent Pending Order Management The core of this EA lies in its intell
MT4 Time-Based Auto Close System EA ​ is an intelligent time-algorithm-based automated order management trading tool. Utilizing a high-tech decision-making engine, it automatically executes precise closing operations when preset holding periods expire, designed to help traders maintain strict trading discipline and avoid emotional interference   . Core Closing Modes The five core closing modes you mentioned form the cornerstone of this EA's strategic logic, allowing flexible configuration base
VWAP FX-AIEA — 机构级动态价值区,让“聪明钱”为你引路 告别普通 VWAP,体验多周期锚定的精准博弈 大多数交易者使用的 VWAP 只是一个单日线条,而   VWAP FX-AIEA   将这一传统工具彻底升维。它不仅仅是一条加权平均线,更是一套   动态、多维、可深度定制的智能支撑阻力系统 。通过独创的多周期锚定技术与三重标准差通道,你无需再猜测市场的“公允价值”在哪里——它直接呈现在图表上,清晰、直观、毫无歧义。 核心杀手锏 —— 为什么它是你从未见过的 VWAP? 智能多时间框架锚定 指标会根据你当前图表周期, 自动挂载更高维度的 VWAP 。例如: H4 及以上周期→月线 VWAP,H1→周线 VWAP,M30 及以下→日线 VWAP 。 你也能手动指定任意周期(MN1 / W1 / D1 / H4 等), 让波段、趋势、日内交易者都能在同一张图表上看到真正影响价格的核心价值区 ,而不是被当日噪声迷惑。 三重标准差通道(±1σ / ±2σ / ±3σ),让超买超卖可视化 基于实际成交量加权计算出的标准差,形成了六条对称的通道线。价格触及 ±2σ
本EA主要功能:利用AI快速捕捉订单的价格,批量修改止盈止损到指定的价格位置。例如:你有5个XAUUSD的buy订单,开仓价格分别为2510、2508、2506、2504、2495,你可以通过本EA批量统一修改止盈为2530,止损为2480。祝你交易顺利! 微信:FX-AIEA QQ:2813871972 邮箱:lxy284628@163.com 微信公众号:鑫有金科FXAIEA.com   欢迎关注 (鑫有金科(FXAIEA.com)围绕A1、大数据、云计算区块链等前沿科技,为交易员、投资者和金融机构提供创新解决方案,助其在复杂市场中创造更大价值。资讯:市场动态、技术分析、交易策略和交易心态,技术:MT4/MT5指标、EA和脚本)
Arrow Trend indicators Trading with the trend is often one of the most basic pieces of advice given by experienced traders. In addition, experienced traders will often advise traders to prioritize the long-term trend, as prices usually follow the direction of the long-term trend. Arrow trend indicators are tools that traders can use to determine the direction of a trend toward a long-term trend. What is an arrow trend indicator? An arrow trend indicator is a trend-following technical indicator
This EA will not automatically open the position, open the position needs the user manually!! MT5 position profit/loss up to the set amount of automatic closing EA\n will open the position is the apprentice, will close the position is the master, when all your order profit reaches the amount you set, the ea will automatically help you to close the position in bulk, the loss value will also be all closed Recommended time frame: Any time frame will work, but we like to use the M5, M15, M30 and H1
This "MT5 Auto Delete Pending Orders by Timeframe" EA is a high-tech trading efficiency tool designed for modern traders. It does not perform any trading or decision-making. ​ It fundamentally solves the core pain point in traditional trading where forgotten pending orders or sudden market changes lead to tied-up capital and missed new opportunities, by automatically managing order expiration . ️ Core Working Principle: Intelligent Pending Order Management The core of this EA lies in its intell
MT5 Time-Based Auto Close System EA ​ is an intelligent time-algorithm-based automated order management trading tool. Utilizing a high-tech decision-making engine, it automatically executes precise closing operations when preset holding periods expire, designed to help traders maintain strict trading discipline and avoid emotional interference   . Core Closing Modes The five core closing modes you mentioned form the cornerstone of this EA's strategic logic, allowing flexible configuration base
VWAP FX-AIEA MT5— 机构级动态价值区,让“聪明钱”为你引路 告别普通 VWAP,体验多周期锚定的精准博弈 大多数交易者使用的 VWAP 只是一个单日线条,而   VWAP FX-AIEA   将这一传统工具彻底升维。它不仅仅是一条加权平均线,更是一套   动态、多维、可深度定制的智能支撑阻力系统 。通过独创的多周期锚定技术与三重标准差通道,你无需再猜测市场的“公允价值”在哪里——它直接呈现在图表上,清晰、直观、毫无歧义。 核心杀手锏 —— 为什么它是你从未见过的 VWAP? 智能多时间框架锚定 指标会根据你当前图表周期, 自动挂载更高维度的 VWAP 。例如: H4 及以上周期→月线 VWAP,H1→周线 VWAP,M30 及以下→日线 VWAP 。 你也能手动指定任意周期(MN1 / W1 / D1 / H4 等), 让波段、趋势、日内交易者都能在同一张图表上看到真正影响价格的核心价值区 ,而不是被当日噪声迷惑。 三重标准差通道(±1σ / ±2σ / ±3σ),让超买超卖可视化 基于实际成交量加权计算出的标准差,形成了六条对称的通道线。价格触及
FX-AIEA 供给需求区智能识别指标( Supply and demand indicators MT5 ) 版本:2.51   | 适用平台:MetaTrader 5  为什么交易需要供给需求区? 供给需求区是机构订单流的核心体现,比传统支撑阻力更精准地反映真实买卖力量。但手动绘制不仅耗时,而且主观性强、容易错过关键区域。 FX-AIEA 供给需求区指标   采用自适应 ZigZag 算法,自动识别高概率供需区域,并将它们以彩色矩形直观标注在图表上,让您一眼看清当前市场的“禁区”与“机会区”。 ️ 核心特性 全自动绘制 + 实时刷新 基于改良版 ZigZag 动态提取有效波峰波谷,精准定位潜在供给区(红色)与需求区(天蓝色)。 新 K 线自动更新 :指标使用 MQL5 原生   prev_calculated   机制,每出现一根新 K 线即重新计算并重绘区域,永远不会“卡住不刷新”。 支持手动刷新(双击图表或切换周期),确保数据始终同步。 灵活的时间框架 Forced_TimeFrame   参数 :可强制指标运行在任意周期(如小时图加载指标,但基于日线计
RockFirm FX-AIEA V5.18 —— 专为2026年高波动的XAUUSD M5打造的“自适应AI智慧黄金算法” 交易品种:XAUUSD (黄金) 时间周期:M5 以上(5分钟图以上) 核心亮点: 融合最新AI机器学习技术:模型并非简单的固定网格或马丁策略,而是基于海量黄金历史数据进行过专项训练的AI决策模型。 2026高波动行情专属调校:默认参数已经针对2026年XAUUSD的剧烈波动特征进行了深度优化。这绝非市面通用的“傻瓜EA”,而是具备季节性市场理解力的“智能适应者”。 无损风控-利润拦截系统:独创的“利润平仓+追踪止损”双重智能护盾,为你的资金筑起防火墙。 完整详细描述(可直接用于商城或推广页面): 核心技术:算法与AI的融合 FX-AIEA Rock-Firm V5.18 摒弃了传统EA死板的数学公式。它集成了一套基于强化学习与时间序列预测的AI逻辑。针对黄金(M5)级别的数据特性,EA内置了动态波动率感知模块。它能够“看懂”市场的脾气——利用截图中的【风险系数(1-10)】作为AI的执行抓手,让高频率的黄金震荡不再成为拦
筛选:
无评论
回复评论