 MetaTrader 5
 专家
专家
 指标
指标
 程序库
程序库
 实用工具
实用工具
 窗口小部件
窗口小部件
 规则
规则
适用于MetaTrader 4的免费技术指标 - 30
 下面列出的技术指标信号对MetaTrader 4平台的开仓交易和平仓交易起着至关重要的作用。
指标的本质就是一种交易品种的数学转换,旨在预测价格变化。
下面列出的技术指标信号对MetaTrader 4平台的开仓交易和平仓交易起着至关重要的作用。
指标的本质就是一种交易品种的数学转换,旨在预测价格变化。 
Multi-TF MA Levels plots a single moving average across multiple timeframes directly on your chart, giving you instant context at every level of the market. No switching charts. No mental maths. Just clean, flat lines showing exactly where the MA sits on M15, M30, H1, H4 and D1 — all updated on confirmed bar close so there is no repainting. Features
Plots the local timeframe MA plus up to 5 higher timeframe MAs simultaneously
HTF lines only update on confirmed bar close — no repainting
Higher ti
FREE

Supporting file (1 of 2) for T3 Cloud MA
Trend indicator derived from T3 moving averages. The cloud is bounded by a fast T3 and slow T3 lines. Buying/Selling opportunities above/below cloud. The fast and slow T3 MA lines can also be used as dynamic support/resistance for more aggressive entries. Use default values for best settings. The number of look back bars is user defined. This indicator can be used in combination with other strategies such as price action. Suitable for all time frames. Pr
FREE

Session Killzone Indicator
Indicator that helps you to identify the killzone times of both London and NewYork sessions which usually is the most times for high volatility and taking liquidity from the market. Killzone times are configurable through indicator parameters. The indicator adjusts the range of the killzones based on the daily trading range.
FREE

你好!
我是Tatsuron,日本个人投资者。 我在外汇市场经营超过 10 亿日元。 所以,让我介绍一个我使用的非常有用的指标。
环境确认类型指标。 我们已将世界市场所知道的支点缩小到每日和每月两个支点。 Daily 是每日交易的指南,而 Monthly 是快攻市场中突破或逆转的材料。
作为积累证据的基础非常有用,例如当它与自信的趋势线重叠时! 与其他指标一起使用!
请检查指标实际运行的视频。 Jpivot 大约在 1:48 开始。
Hello!
I'm Tatsuron, a Japanese individual investor. I was operating over 1 billion yen in Forex. So, let me introduce a very useful indicator that I use.
Environmental confirmation type indicator. We have narrowed down the pivots that the world market is aware of to tw
FREE
The purpose of this new version of the MT4 standard indicator provided in your platform is to display in a sub-window multiple timeframes of the same indicator. See the example shown in the picture below. But the display isn’t like a simple MTF indicator. This is the real display of the indicator on its timeframe. Here's the options available in the FFx indicator: Select the timeframes to be displayed (M1 to Monthly) Define the width (number of bars) for each timeframe box Alert pop up/sound/ema
FREE
Introduction The ST Cross indicator is based on the traditional Moving Average (MA) Cross which uses a fast and slow moving average. Entry signals to buy and sell are given when both moving averages cross. However with the basic strategy there are a lot of false signals. In order to filter the trades we use the 200 (MA) to identify the overall direction of the trend. Input Settings Master Trend Period - 200 Period moving average used to get the trend direction. Fast
FREE

AI Hidden Activity Meter MT4 — is an adaptive tool based on advanced artificial intelligence algorithms that reveals hidden market activity. Key features: No redraws — no guesswork, only facts. Works in real time and in the strategy tester (every tick mode). Requires absolutely no setup — works on any instrument out of the box, automatically adapting to any market and timeframe.
FREE

The indicator is a multifunctional tool for automating the analysis and visualization of the trading process. Main features:
News display — the indicator automatically loads and displays economic news on the chart, allowing you to take into account important events when trading. Dynamic timeframe change — during the news release, the chart switches to a preset period for more detailed analysis. Adapting to the number of orders — the timeframe can change automatically depending on the number of
FREE
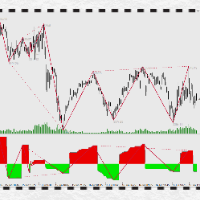
万能背驰指标简介(DivergenceLines) 注意注意,这个指标不能单独运作,对以下两个指标有依赖,请确保先获得以下两个指标后才购买本指标! 1) 动力之梯(PowerTrapezoid) (力度评估副图指标,本指标) 2) 万能分段(LinesSegment) (线段划分主图指标) 。 3)万能背驰(DivergenceLines,本指标) (比较力度背离主图指标)。 指标原理: 通过获取动力之梯指标的筹码堆积值,依照万能分段指标为依据,对同向线段向前回朔,进行一一对比,当后面线段力度比前面力度小时,定义为背驰(背离),背驰的两个高点(或两个低点)之间可以连接一条背驰线,当某个高点(或低点)连接的背驰线越多,这个点就构成了多个单级别背驰区间套。
FREE

indicator that numbers the bars (candles) in a custom trading session.
The indicator allows: Defining the session start time (StartHour and StartMinute) Displaying numbers only on odd bars (if AfficherUniquementImpairs is true) Displaying numbers on the last N days (NbJours) Customizing the color and font size of the text The indicator will loop through the bars of the last N days and, for each day, start counting from the session start time.
It will display the bar number (starting at 1) belo
FREE

The implementation of the impulse system described by Dr. Alexander Elder. The indicator generates signals according to the following pattern: Moving average and MACD histogram increase - green bar, it is forbidden to sell; Moving average and MACD histogram have different directions - gray (or empty) bar, the ban is removed; Moving average and MACD histogram decrease - red bar, it is forbidden to buy.
Indicator Parameters EMA - period of the indicator's moving average MACD Fast - period of the
FREE

MultiFiboDynamicMT4 is a powerful, professional indicator for estimating the most important support and resistance levels. The main advantage is that it plots the Fibonacci levels at all timeframes simultaneously, which allows the trader to see the full picture of the possible price movement of the trading instrument!
Advantages of the indicator The indicator is perfect for scalping and trading binary options. Suitable for beginners and experienced traders. Works on all timeframes. Works on any
FREE

"Giant" is a flexible system in relation to trading strategies. It consists of two high-quality indicators that are installed on five different timeframes of the same currency pair (see screenshot). It monitors the trend and gives signals to open. The system passed a large number of checks and showed high accuracy. Indicators are sold separately. The second word in the main name is the indicator itself. This issue sells the indicator "Attention" .
FREE

Secured Profits, 即时查看您真正锁定的收益 您知道每笔交易中实际保护了多少利润吗?
Secured Profits 是一款智能且强大的 MT4 指标,可实时显示您通过止损实际锁定的 利润金额 ,基于您当前的未平仓交易。 与其他工具不同, Secured Profits 不仅仅汇总“可见”的浮动利润或止损保护的利润。它更进一步,通过 比较所有未平仓头寸 来计算真正锁定的利润。例如,如果一笔交易锁定了 $10 的利润,但其他交易的止损风险为 -$5,那么只有 $5 是真正被保护的,这就是您在屏幕上看到的金额。 主要特点: 显示您真正锁定的利润 ,考虑所有未平仓交易当前的止损值 排除虚假的安全感 ,仅显示在考虑仍有风险的头寸后真正被保护的部分 在图表上显示清晰且可自定义的标签 ,默认位于左下角,用户可自行调整位置和样式 灵活的过滤选项 ,提供三种操作模式: 所有交易 (默认),包括所有符号和魔术编号 仅当前符号 ,仅限于当前图表符号的交易 特定魔术编号 ,按一个或多个用户定义的魔术编号过滤交易 即插即用,只需附加指标即可立即开始工作 兼容所有交易工具和时间框架 适用于手动交
FREE

MT4 的 R 2EMA 颜色指标基于 2 个 EMA 的交叉提供可靠的交易信号。
关键点 当价格交叉并收于两条绿色 EMA 上方时,它会产生买入交易信号。 当价格交叉并收于两条红色 EMA 上方时,它会产生卖出交易信号。 R 2EMA Color Forex 指标使确定何时买卖变得更加容易
当 2 条 EMA 线变为绿色时,出现买入信号。 当 2 条 EMA 线变为红色时,出现卖出信号。 如何与之交易? 一旦两条 EMA 信号线从红色变为绿色,就开始买入交易,现在趋势是积极的。 一旦两条 EMA 信号线从绿色变为红色,就开始卖出交易,现在趋势是负面的。 当图表上出现相反的交易信号时退出交易。
随意使用您自己喜欢的交易方法通过 R 2EMA 颜色指标打开和关闭交易。
规格 交易平台:Metatrader 4 (MT4)
货币对:适用于任何货币对
时间范围:适用于任何时间范围
输入参数:快、慢、模式、价格、信号条、警报消息、警报声音、警报电子邮件、警报移动、颜色设置和样式
指标类型:价格行为
FREE

Double Price Channel 设置中指定的特定数量柱的价格通道指标。
指标线代表动态支撑或阻力位。上限为一定周期数的最高价,下限为最低价。与基于收盘价的移动平均线不同,该指标不会因小幅波动而“分心”。仅当边界发生变化时才会重新计算。如果是后者,那么值得认真思考一个新趋势的走向。有些策略是在一张图表上同时使用两个不同时期的指标。在这种情况下,周期较短的指标位于第二个指标内。 指标设置说明: Width_Bars - 指标周期 高度 - 高度,以磅为单位 Double Price Channel 设置中指定的特定数量柱的价格通道指标。
指标线代表动态支撑或阻力位。上限为一定周期数的最高价,下限为最低价。与基于收盘价的移动平均线不同,该指标不会因小幅波动而“分心”。仅当边界发生变化时才会重新计算。如果是后者,那么值得认真思考一个新趋势的走向。有些策略是在一张图表上同时使用两个不同时期的指标。在这种情况下,周期较短的指标位于第二个指标内。 指标设置说明: Width_Bars - 指标周期 高度 - 高度,以磅为单位
FREE

本指标绘制两条 简单移动均线 ,使用最高价和最低价。 MA_High 线当均线指向下行时显示。它可以用于设置空头订单的止损位。 MA_Low 线当均线指向上行时显示。它可以用于设置多头订单的止损位。 本指标用于 TrailingStop EA。 参数 Period - 移动均线的计算周期。 Deviation - 线间聚合/离散率。 缓存区索引: 0 - MA_High, 1 - MA_Low。
FREE
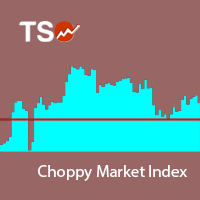
The Choppy Market Index (CMI) is an indicator of market volatility. The smaller the value of the indicator, the more unstable the market. It calculates the difference between the closing of the last bar and a bar n periods ago and then divides that value by the difference between the highest high and lowest low of these bars.
Features Easily separate trends from the market noise The indicator is non-repainting. Returns CMI values through buffer. (see below)
Inputs Period: The number of periods
FREE

Are you tired of having many open charts and watching many different currency pairs? MCTSI will monitor the strengths of 56 currency pairs and show you the best pairs to trade, no more guessing which currency is stronger/weaker, no more trading a pair that is not moving positively. This is the BASIC version. MCTSIP is the more advanced version and can be found here: https://www.mql5.com/en/market/product/20994 You may have many charts open trying to determine the best currency pair to trade on
FREE

"Giant" is a flexible system in relation to trading strategies. It consists of two high-quality indicators that are installed on five different timeframes of the same currency pair (see screenshot). It monitors the trend and gives signals to open. The system passed a large number of checks and showed high accuracy. Indicators are sold separately. The second word in the main name is the indicator itself. This issue sells the indicator "Nicely" .
FREE

This is an implementation of the market cycle indicator described by Raghee Horner in the book "Forex Trading for Maximum Profit" . The current state of the market can be determined by analyzing the inclination angle of the exponential moving average (EMA) running on a period of 34 bars. If the EMA inclination is defined as the direction of the hour hand on the dial from 12 to 2 hours, then an uptrend is considered to be present; from 2 to 4 hours, the market consolidates; from 4 to 6 hours, a d
FREE
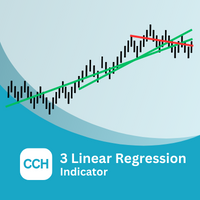
The TLR indicator is a market trend identification indicator. The idea behind this indicator is to use 3 linear regression lines, one short-term, one medium-term, and one long-term. The UPTREND will be determined when: The long-term linear regression line and the medium-term linear regression line have an uptrend. The long-term linear regression line has an uptrend, the medium-term linear regression line has a sideway, and the short-term linear regression line has an uptrend. The DOWNTREND will
FREE

PipStartex 是一款剝頭皮交易指標。它以通道的形式在圖表上繪製超買/超賣價格區域。當價格超出通道時,它也會在圖表上繪製黃點。當價格超出該頻道時,它總是試圖回落。了解了這種模式,每個交易者都可以用它來進行交易。當超賣區域的價格超出紅色區域下方的通道時,我們開立買入交易。當超買區域的價格超出藍色區域上方的通道時,我們開立賣出交易。在 97% 的情況下,價格總是會迅速嘗試回到舒適圈。舒適區是指價格位於通道內。當價格超出通道時,價格會感到不舒服。為了了解其工作原理,請下載該指標的演示版,並在策略測試器的可視化模式下進行測試。 為何您應該使用此指標: 此指標在圖表上顯示的形態在 97% 的情況下都有效。 此指標不會重新繪製其值。 適用於日內時間框架 M5、M15、M30 和 H1。 此指標對於新手和專業人士都非常易於使用。
如何測試此指標: 從您的電腦造訪此頁面,然後點擊「免費演示」按鈕。 然後,指標將出現在您的 MT4 中。 運行策略測試器,並從指標清單中選擇此指標。 選擇 GBPUSD 或 EURUSD 貨幣對。 選擇週期,例如 M5。 點選「開始」按鈕,觀察指標如何在圖表上繪製
FREE

What is the Market Sessions Indicator? The Market Sessions Indicator is a technical analysis tool designed for the MetaTrader 4 platform. It visually represents the trading hours of major financial markets (Asia, Europe, USA, and other key sessions) on the chart. By marking each market session with colored rectangles, it helps traders understand which markets are active and their impact on price movements. What Does It Do? Visualizes Market Sessions : Displays key trading sessions such as Asia,
FREE
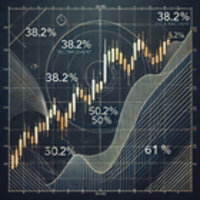
Indicador de Fibonacci Semanal para MT4 Maximize suas operações no mercado financeiro com o Indicador de Fibonacci Semanal para MetaTrader 4 (MT4) , a ferramenta essencial para traders que buscam identificar pontos estratégicos de suporte e resistência com base na ação do preço da última semana. Principais Recursos: Atualização Automática : O indicador recalcula os níveis de Fibonacci automaticamente a cada novo candle semanal. Níveis Personalizados : Traça apenas os níveis essenciais de Fibonac
FREE

Multi Timeframe Indicator includes a lot of functions and can be considered as a universal helper for a trader. It's main objective is to display up to 10 indicators at a time using just one small brick per each of them. These indicators involve Awesome Oscillator, CCI, DeMarker, MACD, RSI, RVI, Stochastic, Larry Williams' Percent Range, Bulls Power and Bears Power. An important function of the indicator is an ability to monitor signals from different timeframes. You can choose different combina
FREE
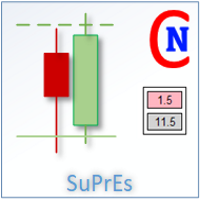
The SuPrEs indicator indicates the distance to the next horizontal line whose name begins with the configured prefix (see Options).
usage Draw support & resistance in the chart and let the indicator warn you, as soon as a configured distance is undershot. Use the prefix to provide alarms for other lines as well as standard lines (see screenshot with pivot indicator).
Display of the indicator The indicator displays the distance to the next line above and below the current (Bid) price. Not more
FREE

历史订单统计 (Advanced History Collector Panel) 历史订单统计 是一款专为 MetaTrader 平台设计的高级账户分析与可视化工具。它能够深度复盘您的交易历史,将枯燥的成交数据转化为直观的图表与详细的统计报表。 核心功能: 多维度数据统计 :精准计算每日/周/月的盈亏、订单总量、多空对比及手数分布。 可视化图表系统 :内置盈亏折线图、净值曲线、持仓品种分布柱状图等多种统计视图,支持实时动态绘制。 深度风险分析 :自动统计最大浮盈、最大浮亏及账户余额变动,助您洞察资金管理中的薄弱环节。 高度自定义 UI :支持字体、颜色、面板尺寸及统计时间范围的完全自定义,适配各种分辨率屏幕。 数据自动化 :支持历史数据导出与自动加载,确保统计结果的连续性与实时更新。 无论是复盘交易策略还是日常资金监控,本指标都是您提升交易纪律、优化风控的得力助手。
FREE
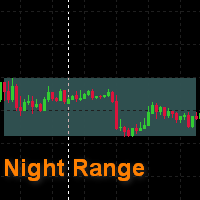
This is a simple indicator that draws a night range. The start and the end of a working day are specified in hours, color rectangles are adjusted as well. It helps to view the history in search for regularities , excluding unpredictable night time. It can be used to search for a breakthrough of the night range. It is drawn as a background , and does not cover a chart and other indicators .
FREE

free only until the end of the week
The following indicator must be used and contextualized according to your trading methodologies. It provides excellent trading insights and identifies rejection zones on the drawn lines. Several parameters can be customized. The indicator will plot three levels above and below the opening price on D1, W1, and MN1. It will provide the daily ADR and display two additional daily sessions (EUROPE session and USA session). The colors of the various lines can be cu
FREE

A ratio between 0 and 1 with the higher values representing a more efficient or trending market, It is used in the calculation of Perry J. Kaufman Adaptive Moving Average (KAMA), dividing the price change over a period by the absolute sum of the price movements that occurred to achieve that change. The Fractal Efficiency or also known as Efficiency Ratio was first published by Perry J. Kaufman in his book ‘Smarter Trading‘. This is mostly considered a filter for volatile markets none the less
FREE

5/35 Oscillator to be used with our Elliott Wave Indicator as part of the overall strategy on trading the 5th wave. The Elliott Wave Indicator Suite is designed around a simple but effective Swing Trading Strategy. The Indicator Suite is great for Stocks, Futures and Forex trading on multiple timeframes You can find the main Elliott Wave Indicator here https://www.mql5.com/en/market/product/44034
FREE
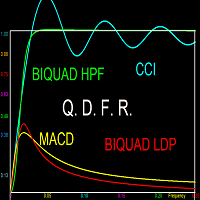
This indicator does not process the price chart data and does not provide trading signals. Instead, it is an application to compute and display the frequency response of many conventional indicators. Moving averages like the SMA, LWMA and EMA, and oscillators like the MACD, CCI, Awsome Osc, all have the form of digital filters. Electronic engineers use a special method to characterise the performance of these filters by studying their frequency response. Two important quantities of the freque
FREE
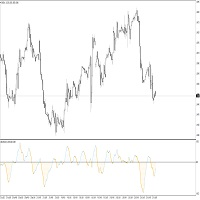
This indicator idea comes from Tushar Chande called Qstick.
Technical indicators quantify trend direction and strength in different ways.
One way is to use the difference between close and open for each bar and to sum it up over a period of time.
The formual is:
Qstick (period ) = Average ((close-open ), period )
In this indicator, we can choose how to calculate body by two famous chart types. The first and default indicator settings are based on Heiken Ashi chart, and the second is based
FREE
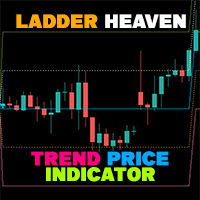
If you have difficulty determining the trend as well as entry points, stop loss points, and take profit points, "Ladder Heaven" will help you with that. The "Ladder Heaven" algorithm is operated on price depending on the parameters you input and will provide you with signals, trends, entry points, stop loss points, take profit points, support and resistance in the trend That direction.
Helps you easily identify trends, stop losses and take profits in your strategy!
MT5 Version: Click here
FREE

This indicator is based on the Channel . Input Parameters channel_One- show trend line One on or off. timeFrame_One - time Frame of channel One . ColorChannel_One - color of trend line One. channel_Two- show trend line Two on or off. timeFrame_Two - time Frame of channel Two . ColorChannel_Two - color of trend line Two. channel_Three- show trend line Three on or off. timeFrame_Three - time Frame of channel Three . ColorChannel_Three - color of trend line three. channel_Four- show trend line F
FREE

Lisek Stochastic oscillator indicator with Alarm, Push Notifications and e-mail Notifications. The Stochastic indicator is a momentum indicator that shows you how strong or weak the current trend is. It helps you identify overbought and oversold market conditions within a trend. The Stochastic indicator is lagging indicator, which means it don't predict where price is going, it is only providing data on where price has been !!!
How to trade with Stochastic indicator: Trend following: As long
FREE
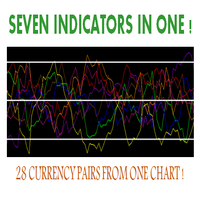
Hello, This indicator is a unique high reliability 7-in-1 multicurrency indicator comprising these sub-indicator’s: A Trend Power Crossover Indicator. A Percent Change Crossover Indicator. A Currency Overbought/Oversold Indicator. A Currency Deviation Indicator. A Currency Impulse Signal Indicator. A Trend Power Indicator. A Currency Volatility Indicator. The main advantage of this indicator is that it's reasoning by currency and not by currency pair. The values of each sub-indicator are calcul
FREE
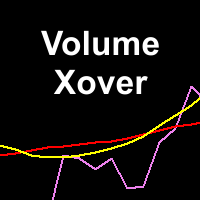
This indicator determines minimum volumes needed during a candle formed so that it would be higher than current volume's average. Although you can place MAs on your volume indicator, this indicator has non-repaint characteristic so you may not to worry about sudden volume increase. This indiator also draw volume indicator for its own. Input Description: period: Period used for indicator. Must be higher than 1. Output Description: VolumeXover: This indicator's main feature. During the time the vo
FREE

Symbol Cycler is a lightweight on-chart utility that lets you quickly switch between symbols in your Market Watch list using two simple arrow buttons (). With a single click, you can scroll forward or backward through your predefined symbols without leaving the chart. Key Features: One-click symbol switching from the chart Works with your Market Watch list order Buttons can be placed in any chart corner or even the center Timeframe remains locked while switching symbols Clean, responsive UI
FREE

The SDX Chart is a free additional indicator which can be used in combination with SDX Dashboard .
Features Ability to review the history of each symbol and time frame. Ability to change symbols and time frames with one click. Works perfectly in combination with SDX Dashboard and helps you to understand the system better. Settings
MA Period - number of periods for the calculation of the moving average and the standard deviation. Number of Bars - how far back to draw the indicator. Buttons Size
FREE

This is a trend following indicator that identifies optimal entry points in the direction of a trend with an objective stop loss to manage the trade. The indicator allows you to catch trend early and ride it. The Indicator draws resistance line as it detects an Uptrend and draws support line when it detects a Downtrend on the chart. When those levels are broken, that allows you to identify the Trend Direction and Momentum in the direction of prevailing trend which offers optimal entry points in
FREE
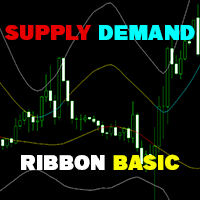
Supply Demand Ribbon is an indicator with moving supply and demand lines that help you identify price zones more easily. The indicator helps you determine flexible entry, stop loss, and take profit areas. There are also strategies for algorithmically changing ribbon colors. From there you can come up with many trading strategies for yourself! MT5 Version: Click here!
You can explore many feature in Advanced version here ! You can combine it with our indicators below to make your tradin
FREE

The indicator "Elvis A" is designed for a very strict determination of the reversal. With the author's settings, it is installed on the D1 chart. It will skip many signals and choose only the most reliable ones. Therefore, it is better to set it on several currency pairs.
The screenshot shows an example of this indicator in the form of an expert Advisor on a currency pair with a very large spread.
FREE

这是免费产品,欢迎您随意使用!
如果您喜欢这个指标,请留下简短的好评!非常感谢!
点击这里查看高质量的交易机器人和指标! ............................................................................................... Crypto_Forex 指标“余额和净值显示”适用于 MT4,是一款出色的辅助交易工具。 ............................................................................................... - 该指标显示账户当前余额和净值。 - 可以将显示值放置在图表的任意角落。 - 还可以设置颜色和字体大小。 这是 MQL5 网站上提供的原创产品。
FREE

A new interpretation of the classical indicator in the form of an oscillator for a more accurate representation of the situation on the market. Less lagging than the standard Alligator. All settings are fully accessible, such as the type and prices for which it is built. Thanks to the additional parameters, it became possible to fine tune.
Distinctive features Does not redraw. Additional parameters for fine tuning. Works on all timeframes and symbols. Suitable for manual trading and developmen
FREE

High-Precision Volatility Notifier V1.10 Developed by: Grazia-system-com Title: Stop Chasing Volatility: Get Notified Only When the Real Breakout Starts. The professional, noise-filtered tool that transforms your MT4/MT5 into a smart, proactive monitoring system. Never miss an institutional-level move again. Why This Detector Is Different (Dual-Layered, Noise-Filtered Intelligence) Most volatility tools use fixed thresholds that fail in dynamic markets. Our Notifier eliminates false signals
FREE

产品标题 Smart Williams' %R (MT4) – SmartView 系列的一部分 简短描述 具有独特用户体验的 Williams' %R 指标,在 MetaTrader 平台上提供。提供以前不可用的高级功能,例如双击打开设置、隐藏和显示指标而无需删除它们,以及以全图表大小显示指标窗口。设计用于与 SmartView 指标系列的其余部分无缝协作。 概述 SmartView 系列通过创新功能为 MetaTrader 平台上的指标提供独特且与众不同的用户体验,使指标管理更快、更轻松。每个指标都配备了图表上的智能控制面板,显示基本信息并提供对所有重要功能的快速访问。 以前不可用的独特功能 SmartView 系列提供使指标工作更简单、更快速的高级功能: 双击打开设置: 无需在指标列表中搜索,双击面板上的指标名称即可直接打开设置窗口。 隐藏和显示指标: 一键隐藏和显示指标,无需从指标列表中删除和重新添加它们。 以全图表大小显示指标窗口: 在子窗口中,您可以最大化指标窗口以全图表大小显示,并临时隐藏其他窗口。 折叠和展开子窗口: 折叠子窗口以减少其高度并节省屏幕空间,然后在需要时将
FREE

Stonehill Forex 发布了我们首个自主研发的指标,该指标于 2025 年 3 月在 Stonehill Forex 网站上进行了介绍。最初的版本是为 MetaTrader 4 (MT4) 编写的,后来根据社区兴趣,又为 MT5 和 TradingView 编写了代码。这个指标免费提供给您,也是我们指标库的开山之作。
它是一个双线交叉价格叠加指标,其核心是使用两条加权移动平均线,并经过一个非常精准的滤波器。结果显示的信号非常准确。我们对其进行了三年的测试,测试结果可以在博客中查看,点击此处。此外,我们还附带一个技术分析视频,向您展示如何使用它。为了方便起见,视频嵌入在博客中。
它有两种设置:
StartLen:数学开始收集数据的起点。默认值为 2。
关于“StartLen”的设置,我们想提两个注意事项:
“StartLen”设置变量不得小于零。
“StartLen” 设置必须小于“LOOKBACK_period”。
LOOKBACK_period:这是生成信号线时数学运算将包含的历史数据周期数。默认值为 24。
使用方法:
长线:当绿色信号线向上穿过洋红色
FREE
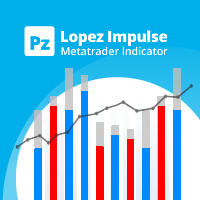
该指标同时评估波动率和价格方向性,从而发现以下事件。 [ 安装指南 | 更新指南 | 故障排除 | 常见问题 | 所有产品 ] 决定性和突然的价格变动 大锤子/流星图案 大多数市场参与者都支持强劲的突破 犹豫不决但动荡的市场形势 这是一个非常易于使用的指标... 蓝色直方图代表看涨的冲动 红色直方图代表看跌冲动 灰色直方图表示当前的波动率 移动平均线是平均波动率 该指标实施各种警报 指示器不重涂或重涂 ...具有直接的交易含义。 当看涨冲动超过平均波动率时,您可以购买 当看跌冲动超过平均波动率时,您可以卖出 该指标跟踪市场波动以及每个单个柱的看涨和看跌冲动。如果看涨的冲动超过平均波动率,那可能是做多空头的好机会。这些强劲的价格走势是可靠的,因为其他市场参与者可能会补仓。如果使用得当,此指示器功能非常强大。
作者 ArturoLópezPérez,私人投资者和投机者,软件工程师和Point Zero Trading Solutions的创始人。
FREE
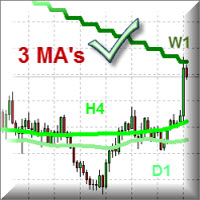
目的:
该指标的功能是在主要的MT4价格图表上绘制3条移动平均线。
MA来自用户指定的3个不同的时间范围,与当前显示的图表无关。
当您在不同的时间范围内切换图表视图时,3个MA将继续显示属性中指定的时间范围的MA线。
例:
默认设置为H4,D1和W1时间帧绘制了三个50条的MA。 在M5 / M15的日内交易期间,默认设置(H4,D1,W1的MA50)可以帮助您发现较高时间范围的“硬”支撑/阻力。
好处:
始终可以在3个不同的时间范围内对所有三个MA进行可视访问,可以更好地指导您进行交易。
目的:
该指标的功能是在主要的MT4价格图表上绘制3条移动平均线。
MA来自用户指定的3个不同的时间范围,与当前显示的图表无关。
当您在不同的时间范围内切换图表视图时,3个MA将继续显示属性中指定的时间范围的MA线。
例:
默认设置为H4,D1和W1时间帧绘制了三个50条的MA。 在M5 / M15的日内交易期间,默认设置(H4,D1,W1的MA50)可以帮助您发现较高时间范围的“硬”支撑/阻力。
好处:
始终可以在3个不同的时间范围内对所有三个MA进行可视访问,可以
FREE

A BB indicator with MA options
You're no longer limited to the built in default of using BB off a SMA method, now you can choose from SMA-EMA-SMMA-LWMA. You now also have up to 3 standard deviation levels, with price labels.
Options: - MTF - moving average type SMA-EMA-SMMA-LWMA - 3 adjustable deviation levels
- separate coloring to lines and texts
Troubleshooting: - If there are any issues or suggestions for the indicator, please comment and let me know. The feedback will be noted and consid
FREE
VR Ticks 是基于剥头皮策略的特殊指标。借助该指标,交易者可以直接在金融工具的主图表上看到即时图表。分时图表允许您尽可能准确地在市场上建仓或平仓。 VR Ticks 以线条的形式绘制刻度数据,这些线条根据方向改变颜色 - 这使您可以直观地了解和评估刻度的情况。分时图表的优点是它们不考虑时间范围,并且是根据价格变化构建的。 VR Ticks 构建尽可能最小的图表。 设置、设置文件、演示版本、说明、问题解决,可以在 [博客] 中找到
您可以在 [链接] 阅读或撰写评论
[MetaTrader 5] 版本 一个价格变动是一次价格变动。对于一次价格变动,价格可能会改变一个或几个点。重要的是要理解一次 蜱虫是一种运动 。 该指标在右下角显示卖价和买价,以及当前的点差值。指标的程序代码逐笔在 MetaTrader 窗口中构建图表。根据指标设置,图表中的增长时刻可以用一种颜色绘制,价格下跌的时刻可以用另一种颜色绘制。这种方法可以帮助交易者清楚地看到当前趋势的变化。该指标监控每个价格变动,并在图表上显示所有绝对所有价格变动。如果卖价或买价没有变化,指标将构建水平图表。 优点 使用倒卖策略进行交易
FREE

Multi-Timeframe ATR 指标是 MetaTrader 4 标准 ATR 指标的增强版,它允许交易者在当前图表上查看 任意时间框架 的波动性。与只显示当前图表时间框架 ATR 的普通版本不同,本指标可让您选择其他时间框架,例如在 M15 或 H1 图表上直接展示 日线 ATR 。 运行原理:
本指标从您选定的时间框架(如 H1、H4 或 D1)提取 ATR 值,并以与标准 ATR 相同的方式在独立窗口中绘制。它会自动将较高时间框架的条形对齐当前图表,使您在分析短周期走势时,了解更高周期的波动情况。同时,图表上还会显示一个 以点(pips)为单位 的当前 ATR 值标签,该值根据您的经纪商报价精度(2–6位小数)自动转换并四舍五入。 交易者实用用途: 跨时间框架波动性背景 — 在操作低周期图表时,监控高周期如日线或周线的 ATR,以判断市场何时处于扩张或收缩状态。 仓位规模制定 — 使用以 pips 表示的当前 ATR 值来设置止损或计算仓位规模,使其与市场波动性成比例。 交易时机把握 — ATR 上升时可确认突破或趋势阶段;ATR 下降时可警示合并阶段。 策略过滤器 —
FREE
Chart Time Indicator is very simple and easy, but it can be very important to control the time before opening any manual trade. This indicator shows the time on the chart between 3 different options.
Input parameters Show Time : Select all the time options that you want to see. Local Time (Personal Computer Time), Server Time (Broker Time) or GMT Time. Recommendations: Use only one Chart Time Indicator for each chart.
FREE
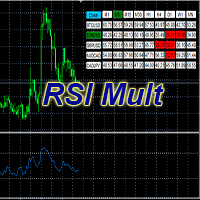
Standard Oscillator RSI (Relative Strength Index) with some additions.
Allows you to select up to 5 instruments.
Displaying indicator data from selected instruments for all time frames.
Fast switching to the selected instrument or time frame.
The RSI indicator shows good signals, but its readings still need to be filtered.
One such possible filter could be RSI from a higher period.
This version of the Oscillator is designed to make it easier to work with charts, namely, to reduce the numb
FREE
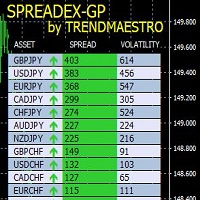
SPREADEX is an indicator for MT4 and MT5 that indicates the distance of an asset from the GP. The GP is the price of the true value of the underlying asset, obtained by estimation. The GP is like a magnet; it attracts the asset's price with a high probability and within the same trading day. Therefore, SPREADEX indicates which assets are currently furthest from the GP in real time. This provides traders with a point of view on which assets to focus on and look for price reversal signals to obtai
FREE
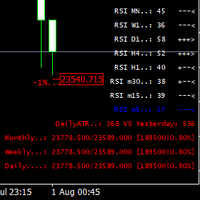
This indicator was created most for personal use. I decided to look up the last 3 bars of RSI, it is good for scalping or for weekly trading and looks as universal fx-toy. In menu you can turn on daily percentage gain info, it is good for crypto as for me, weekly and monthly gains also included as informers. Short ATR helps to determine when price was stopped and entry for pulse pump/dump. The filter of numbers of RSI can be tuned for overbought/oversold values with colors you needed. Exam
FREE
Supreme Stoploss is an indicator for metatrader 4 that is based on the ATR indicator , it gives stoploss/takeprofit as lines drawn above and below the price , this indicator does not repaint/back paint and is not delayed. can be used to determine the stop loss or take profit of a trade using ATR value multiplied by the number set by user. ====================================================================================================== Parameters : ATR SL period : ATR period identity : leave
FREE
Range Cycle Indicator. Gives signal on price range cycling smoothed by moving average. It is better to use it on H1+ timeframes and avoid side markets. Because if market is flat this indicator will give too many zero profit or even losing signals. Parameters: PopUpAlert - to allow it to alert when trend changes; EMailAlert - for email alerts; period - this is a smoothing criteria, use higher values on lower timeframes; TimeFrame(new) - higher timeframe (or the same) to use for calculation, defa
FREE

It's a simple but useful tool for creating a grid based on Envelopes.
Only 2 parameters can be set: 1) "Period" - the period of all visible Envelopes (i.e. 4) and 1 Moving Average (Envelopes axis), 2) "Deviations Distance" - the distance between Envelopes.
Naturally, the colors of all 9 lines can be changed as desired. It works with everything that is available in your Market Watch.
Good luck!
FREE

Long Term trend analyzer according to proprierty Algorithm and multiple EMA. Works best on H1-H4 Time Frame. We are using this indicator in our Main Fund. Ready to use.
- Setup in any Pair, Equity - H1-H4 Timeframe - Best during main Trading times like Asian-European-American Time - NON REPAINTING
Analyze long term trend. Comes with Alarm, Notifications, Push Signals. Get a signal and enter the Markets.
FREE

RaysFX WPR Strategy Indicator RaysFX WPR Strategy è un indicatore di strategia di trading basato sul calcolo del WPR (Williams Percent Range). Questo indicatore utilizza tre lunghezze diverse per il calcolo del WPR e pesa i risultati per fornire un valore complessivo del WPR.
Caratteristiche: - Calcola il WPR utilizzando tre lunghezze diverse (9, 33, 77) - Utilizza un sistema di pesi per combinare i tre valori del WPR in un unico valore - Genera alert in base al numero di alert impostato dall'
FREE

Supporting file (2 of 2) for T3 Cloud MA
Trend indicator derived from T3 moving averages. The cloud is bounded by a fast T3 and slow T3 lines. Buying/Selling opportunities above/below cloud. The fast and slow T3 MA lines can also be used as dynamic support/resistance for more aggressive entries. Use default values for best settings. The number of look back bars is user defined. This indicator can be used in combination with other strategies such as price action. Suitable for all time frames. Pr
FREE

The purpose of this new version of the MT4 standard indicator provided in your platform is to display in a sub-window multiple timeframes of the same indicator. See the example shown in the picture below. But the display isn’t like a simple MTF indicator. This is the real display of the indicator on its timeframe. Here's the options available in the FFx indicator: Select the timeframes to be displayed (M1 to Monthly) Define the width (number of bars) for each timeframe box Alert pop up/sound/ema
FREE
The oscillator indicator " AngDistPer " is one of a series of three calculators of the angular deviation of the price chart of a trading instrument.
INPUT PARAMETER: DRAWs =128 - Number of bars to display the indicator in the chart history; DistPER =14 - calculation period of the indicator in the number of bars.
The values of the indicator indicators are degrees . The presence of a Strong price Movement begins with a value of +-45 degrees, and can not exceed +-90 degrees.
A Good Trading Rese
FREE
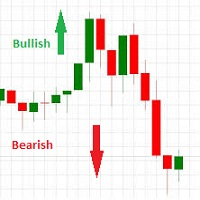
This indicator works on this way: Trader should provided the n period "Number of Candle" ( the default period is 6) Then the indicator will calculate the number of pips in the last n period (not the current candle) And that is display on the chart With that the should confirmed his up trend or down trend analyse according to the number of pips in the last n candles( bullish or bearish) he has provided
FREE

Ska ZigZag Line indicator determines the overbought and oversold regions within a trend. The indicator determines the overbought region by the candlestick high and the oversold region by the candlestick low in a form of a line. To utilize the full strategy i recommend using "Ska ZigZag Line" together with "Ska ZigZag BuySell". NOTE: This indicator is a line based indicator. HOW TO USE: Sell Signal; Place a sell trade when the Ska ZigZag BuySell indicator arrow appear on top of the Ska ZigZag Lin
FREE
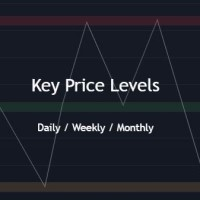
Key Price Levels Indicator Indicator that shows the highs and lows for the significant price levels for past periods that could be potentially considered as reaction levels. The indicator displays the following price levels: Yesterday high and low The day before yesterday high and low Two days back high and low Last week high and low Last month high and low Last three month high and low (Quarter) Last year high and low
FREE

RSI Bands is a powerful indicator which displays an upper and lower band corresponding to the RSI overbought and oversold levels. The band shows what price must be reached during that specific candle in order for the RSI overbought/oversold level to be reached. This is an extremely useful tool for spotting when a trend has begun and when a trend is about to end. The indicator provides buffers, allowing you to use it in your own Expert Advisor. Please message me if you have any questions.
CURREN
FREE
学习如何在MetaTrader AppStore上购买EA交易,MetaTrader平台的应用程序商店。
MQL5.community支付系统支持通过PayPay、银行卡和热门付款系统进行交易。为更好的客户体验我们强烈建议您在购买前测试EA交易。
