 MetaTrader 5
 专家
 指标
 程序库
 实用工具
 窗口小部件
 规则
适用于MetaTrader 4的免费EA交易和指标 - 18
 EA交易自动执行市场交易,而指标可使您更准确地分析报价并预测价格行为。
通过这些应用程序,您将能够更明智地在MetaTrader 4执行交易,抓住更多的交易机会。
#1 Copy Signals from Signals Copier Telegram to MT4 & Never miss a trade again Time saving and fast execution Whether you’re traveling or sleeping, always know that Telegram To Mt4 performs the trades for you. In other words, Our Telegram MT4 Signal Trader will analyze the trading signals you receive on your selected Telegram channels and execute them to your Telegram to MT4 account. Reduce The Risk Telegram To Mt4 defines the whole experience of copying signals from Telegram signal copi
FREE
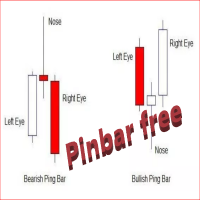
The Free Pin Bar MT4 indicator identifies Pin Bars It will even give you sound or email alerts if want them. If you download it and like it please leave a review! It would be wonderful
Pin Bars are purely based on price action as reflected by the candle formations created by Forex price movements. input Parameters are maximum allowed body/length ratio for the Nose bar. Nose body should be position in top (bottom for bearish pattern) part of the Nose bar. tells the indicator that the Left Ey
FREE

MA Assistant MT4 介绍 可视化趋势识别 – 通过平滑且多彩的图表区域,快速识别市场的多头和空头走势 MA 交叉提醒 – 当快慢均线发生交叉时,提供实时提醒 多周期 MA 热力图 – 在一个清晰的表格中分析不同周期的均线状态 MA 差值测量 – 每10根K线显示两条均线之间的差值,帮助衡量趋势强度和动量 专业版本可用 – 包含 16+ 交易策略 的高级工具可在 Strategy Assistant 立即体验 保持更新 – 加入我们的 MQL5 社区 频道 @hdtradinglab 获取最新更新和免费工具 观看 YouTube 视频: 请观看 YouTube 视频以获取有关 MA Assistant 的完整信息,并订阅我的频道以获取更多免费产品视频。 简短描述 :
MA Assistant 是一款强大且免费的交易工具,通过简洁直观的方式简化均线分析。它使用彩色区域突出显示 多头 和 空头 趋势,提供交叉提醒,并包含 多周期 MA 热力图 以提升决策能力。 独特功能是 MA 差值概念 ,可直接在图表上显示动量强度,帮助交易者快速
FREE
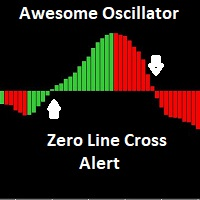
The Awesome Oscillator (AO) is an indicator used to measure market momentum. AO calculates the difference between a 34 Period and 5 Period Simple Moving Average. The Simple Moving Averages that are used are not calculated using closing price but rather each bar's midpoints. This indicator has email and pushup "mobile" features Alert, for any suggestions, please don't hesitate, thanks
FREE

Fractal is one of the main indicators in a number of strategies. Volume Fractals has expanded the functionality of the standard indicator version. The product features fractals sorting and displaying fractals representing both price and volume extreme points.
Application Stop losses Reversal signals Placing pending orders for a fractal breakout
Options Bars of history - number of chart bars the indicator is displayed for Left side minimum bars - minimum number of bars to the left of the fracta
FREE

This indicator calculates and draws lines over the chart. There are two types of trends: Trend A: the line is drawn using local lows for uptrends and local highs for downtrends Trend B: the line is drawn using local highs for uptrends and local lows for downtrends There are a few conditions, which have to be fulfilled and can be changed by the parameters (see also picture 4): MinBarAge : the count of bars to the last base point of a line is called BarAge and has to be greater than the parameter
FREE

My Fibonacci An automated Fibonacci indicator that combines ZigZag swing detection with comprehensive Expert Advisor integration through a 20-buffer system. More details about data specification and EA integration: https://www.mql5.com/en/blogs/post/764109 Core Features Automated Fibonacci Detection The indicator identifies swing points using configurable ZigZag parameters and draws Fibonacci retracements and extensions automatically. It updates levels as new swing formations develop. Market Ad
FREE
LINK : https://linktr.ee/ARFXTools ;
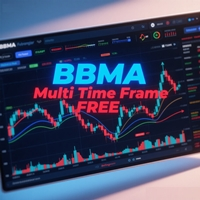
BBMA + SMC TRADING FLOW (Smart & Simple) 1. IDENTIFY THE MAIN TREND (Multi Time Frame) Use indicators: BBMA MTF PANEL (check trend direction on MN, W1, D1, H4) Only trade when D1 and H4 are in the same direction Example :
If D1 = Buy and H4 = Buy → Focus on Reentry Buy only 2. WAIT FOR CSA + CSM (Valid Entry Setup) CSA Buy : Candle closes outside lower Bollinger Band + MA5 low > MA10 low CSM Buy : Candle re-enters BB + MA5 low crosses above MA10
FREE

This indicator allows you to manage your exposure and see how the lot changes. You can choose the optimal lot value for your deposit without opening real positions. And also evaluate new trading instruments. If you trade manually, then risk management will help you avoid unexpected losses. The indicator includes the ability to receive a sound signal when a specified level is reached, as well as send push notifications and a message to the mail.
FREE
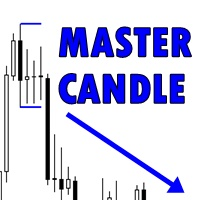
Master Candle (MC) Indicator automatically detects "Master Candles", also known as "Mother Candles", i.e. candle that engulf several candles that follow them. See screenshots. You can choose how many candles Master Candle should engulf. By default it is set to 4. Feel free to change colour and thickness of lines as it suites you.
I find this indicator to be very useful to identify congestions and breakouts, especially on 60 minutes charts. Usually if you see candle closing above or below "Maste
FREE

MacdScapler is an automatic expert advisor with two section of martingale strateges with automation takeprofit. The MACD indicator with adjustable parameters is used as inputs. If parameters of the entry points goes wrong, the EA changes them automaticly. General recommendation
The minimum recommended deposit is 1000 cents for 0.01 lot. Spread is recommended less then 2 points. The martingale parameter can be set from 0.1 to any value in two steps - the first for the four trades and the second
FREE

这是免费产品,欢迎您使用以满足您的需求!
如果您喜欢这个指标,请留下简短的好评!非常感谢! .............................................................. 点击这里查看高质量的交易机器人和指标! ......................................................... Crypto_Forex MT4 版“CCI 带警报”指标,无需重绘。 - CCI 是最受欢迎的交易震荡指标之一。 - 内置电脑和移动设备警报,适用于:进入超卖/超买区域以及退出超卖/超买区域。 - 警报触发级别可调。 - 商品通道指数 (CCI) 衡量当前价格与历史平均价格之间的差值。 - 重要级别:+/-200,+/-100。 - 非常适合在退出超买区域时进行卖出入场,在退出超卖区域时进行买入入场。 - 指标适用于任何时间周期。 - 该指标非常适合与趋势市场的价格行为技术结合使用。 这是仅在此 MQL5 网站上提供的原创产品
FREE

Metavers V2
https://www.nxfx.c
Scalper Base on Many indicator No Grid No Martingale one just open Trade per Day This Expert is not working on all Broker you need low Spread broker with Low Slippage
Broker is Tickmill or TMGM Symbol USD CHF ,EURAUD,EURCAD,USDAUD,USDCAD,EURGBP.AUDCA
FREE

Click SLTP Manager for MetaTrader 4 is a simple and practical trade management utility designed to help manual traders set Stop Loss and Take Profit levels directly from the chart. Instead of opening the order modification window and manually typing SL and TP prices, traders can manage their existing open orders or pending orders with a clean visual panel and a click-based workflow. The tool is made for traders who want faster, clearer, and more convenient order protection management in MetaTra
FREE

The " Countdown Candle Timer " indicator is a visual tool for the MetaTrader 4 platform that displays an accurate countdown of the time remaining until the next candle on the chart. It provides real-time information about the remaining duration of the current candle, allowing traders to track time precisely and optimize their trading decision-making. The indicator can be customized in terms of color, font size, and position on the chart, providing flexibility and convenience to the user. You can
FREE
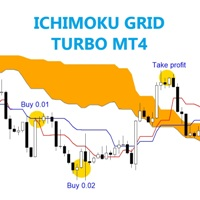
The EA trades reverse trend which T cross K line and take over from B line . Best time frame 30 mins, Any pair any broker no limited, recommend minimum deposit 500$
SETTING Symbol - Set symbol to trade. Tenkan_sen - Tenkan_sen value. Kijun_sen - Kijun_sen value. Senkou_Span_B - Senkou_Span_B value. Lots - start lot. Multiple_lots - Multiply lot for next order. Max_lots - maximum lot. Grid_boost - Frequency of opening position (Less = more order). Grid_minimum_pips - Check distance grid from la
FREE
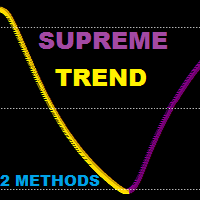
Supreme Trend is a reversal/continuation type Oscillator type indicator that is based on Moving average and stochastic indicators this indicator can be used in two methods : Reversal Method : short when golden arrow appear after arrows were above upper level (e.g 70) Reversal Method : long when Purple arrow appear after arrows were below lower level (e.g 30) Trend Method : long when arrows cross above 50 level line , short when arrows cross below 50 level line. use higher ma and stochastic peri
FREE
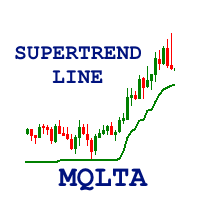
The Supertrend Line indicator shows you the trend using calculation based on the ATR.
How does it work? The Supertrend draws a line following the current trend, this line is the result of calculation made with the ATR. A Line under the candle means a likely bullish trend A Line above the candle means a likely bearish trend
How to trade with CSL indicator Buy when the Supertrend line is below the price, Sell when the Supertrend line is above the price. It is strongly suggested to use this indic
FREE

The presented product is a trend indicator of technical analysis that builds dynamic support/resistance levels based on the volatility of a financial instrument. The indicator allows you to determine the entry points into the market at the moment the price overcomes dynamic support/resistance level and to set a reasonable level for fixing a loss/profit. The indicator is a simple and effective tool that (depending on the parameter settings) can be used in almost any market and for any trading st
FREE

RSI TrendGate 3MA 是一款用于图表显示的指标,通过结合 RSI 与三条移动平均线(MA)来帮助更清晰地确认趋势方向。
当根据设定条件判断市场处于“偏多(上升)”或“偏空(下降)”状态时,指标会在图表上绘制箭头。 本产品不用于将箭头作为单独的进出场信号。推荐用法是:在较高周期确认方向,在较低周期依据用户自己的规则选择入场时机。 概述 本指标根据以下要素进行方向判定。 三条 MA 的排列判定(方向基础)
指标计算短期/中期/长期三条 MA,并按其排列关系对市场状态分类: 上升状态:MA Short > MA Mid > MA Long 下降状态:MA Short < MA Mid < MA Long 其他:无状态(MA 交织,方向不明确) 短期 MA 斜率过滤(可选)
通过比较短期 MA 在两个指定 shift 上的差值(例如 Shift1 与 Shift3)判断短期 MA 是否具有足够斜率。
可设置以点(points)为单位的最小斜率阈值,用于减少接近横盘的状态。 RSI 平滑(对 RSI 数组进行移动平均)
先计算 RSI,然后对 RSI 数组应用移动平均(MA on
FREE

至于“ReverseGear EA”的高级交易功能,“Step Up”和“Step Down”功能尤为突出。 这些功能会根据市场价格趋势自动追加订单,是交易者主动从市场波动中获取利润的强大工具。
升压功能 随着价格上涨,此功能会自动执行额外的买单。 我们的目标是通过逐步增加仓位来实现利润最大化,尤其是在趋势持续的情况下。 例如,每次超过某个设定点时,都会触发新的买入订单,以充分利用市场动力。
降压功能 相反,在空头头寸中,每当市场下跌一定数量的点时,就会下达额外的卖单。 这使您能够利用下跌趋势并不断积累利润。 如果市场朝着预期的方向发展,则进一步扩大你的仓位,扩大你的盈利机会。
灵活的资金管理选项 交易者可以将固定手数或账户余额的一定比例设置为风险。 这种可定制的资金管理设置允许每个交易者根据自己的风险承受能力进行交易。
交易结果可视化 通过直接在图表上显示交易结果,EA 帮助交易者立即查看表现并在必要时调整策略。 这一特性极大地提高了分析评估的效率。
丢失恢复功能(Turn) 如果前一笔交易发生亏损,该功能会自动增加下一笔交易的手数,旨在有效挽回损失。 这样可以在暂时损失
FREE

我在学习 Rob Smith 的 TheStrat 时创建了这个简单的指标,发现它非常有用,我想与您分享。如果您觉得它有用,请查看我在 MQL5 上发布的其他指标。 该指标只是在图表上绘制一条线,显示您从较高时间范围内选择的价格水平。 使用设置,您可以完全控制它显示的时间范围,但默认 情况下,它会自己计算更高的时间范围,只是将刻度向上移动一级。例如,如果您打开 H1 图表,它将显示 H4 图表中的数据。
设置
跟踪时间表 选择绘制价格水平的时间范围。如果您将其保留为当前的默认设置,它将为您选择合适的时间范围。如果您正在查看图表并在时间范围之间进行更改,这将非常有用,因为该线将始终向上调整。 跟踪值 您可以从以下标准价格值中选择一个。默认为开盘价。 PRICE_CLOSE 收盘价 PRICE_OPEN 开盘价 PRICE_HIGH 期间最高价 价格_低 期间最低价 PRICE_MEDIAN 中位数价格,(高 + 低)/2 PRICE_TYPICAL 典型价格,(最高价+最低价+收盘价)/3 PRICE_WEIGHTED 加权收盘价,(最高价+最低价+收盘价+收盘价)/4
FREE
A personal implementation of the famous Bollinger bands indicator as a trend following mechanism, which uses a moving average and the standard deviation to define what a trend is and when it changes. Bollinger bands are usually used as an oversold/overbought indicator only, but in my opinion, the trading approach is more complete using the trend variant as an exit strategy. [ Installation Guide | Update Guide | Troubleshooting | FAQ | All Products | Get Help ] Easy to trade Customizable col
FREE
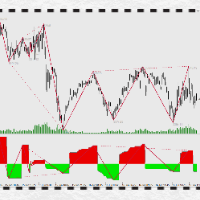
动力之梯简介: 市场动力系统的应用,不是什么秘密,比如:量价背离、macd背离、缠论背驰等。但如何更正确地理解与计算,准确判断动力增减这点却是应用上的一个门槛,这个门槛很难用常规盯盘系统跨越。如何避免背了又背?如何多级别背驰并行计算?如何直观展现背驰的区间套?是几何结构服从于动力,还是动力服从于几何结构?区间套与几何结构的关系怎样? 正确计算一个走势的力度,是动力系统能被正确应用的基础。我们最常用来考察力度的方法有:1.使用macd指标高低点或面积; 2.走势的趋势线斜率等。这两种方式一般人都能够轻易学会并应用起来。我们表面上来看,这些力度比较评估的逻辑貌似都非常合情合理。实事上,这两种方式都存在重大缺陷,这些缺陷对于操盘来讲很可能会引起严重的后果。 Macd高低点或面积来评估力度是缠论学人的标准方式。这种方式的缺限是:在一个线段高低点之间,红绿柱往往是一部份在零轴之下,一部份在零轴之上,如果我们只将其中一部份拿来进行力度比较,那自然是不完整的。所以这种方案是一种极不准确的。拿着这个不准确的数值来评估走势的力度,就不可能获得可靠的结果,而这种不可靠结果不但会影响你对《缠论》应用的信心,
FREE

Dear Friend.. I share with you this simple Expert Adviser .. it is full automatic this Expert Adviser following the trend of the pair you install on or any stocks or indices , it is works like that: - when the trend on H4 chart show a start of up trend the expert will wait till the 15M & 1H charts show an up trend the EA will open a buy order directly , and do the same for down trend and open a sell order the buy or sell order lot size and take profit and stop loss will measured manually by
FREE

Forex Trade Manager Grid MT4 helps you to managing orders and achieve the goal. You only need to place first order with Take Profit, run EA and set in params profit (pips) you want to get. EA will be managing your positions, as will gather appointed amount of pips. It’s a strategy for management of manual trades opened on current pair. The strategy adds positions to currently opened trades in a grid management (with chosen distance in pips between trades) - up to 15 trades (or less). First up to
FREE

Principles of construction of the indicator. The Absolute Bands (AB) indicator is reminiscent of the Bollinger Bands indicator with its appearance and functions, but only more effective for trading due to the significantly smaller number of false signals issued to them. This effectiveness of the Absolute Bands indicator is due to its robust nature. In the Bollinger Bands indicator, on both sides of the moving average - Ma, there are lines spaced from Ma by the standa
FREE

Grid Engulfing is a trading strategy that combines grid trading with engulfing patterns. Grid Trading: A grid trading strategy involves placing buy and sell orders at regular intervals (grid size) above and below a set price level. The goal is to profit from small price movements within a range-bound market.
Engulfing Patterns: Engulfing patterns are a type of candlestick pattern that indicates a potential reversal or continuation of a trend. A bullish engulfing pattern occurs when a small
FREE

MAs COMBO - 探索MT4平台简单而强大的移动平均线指标!
这款自定义指标巧妙地结合了简单移动平均线,能够以最小的努力识别高概率的交易机会。
即使您是交易新手,也能凭借该指标简洁明了的逻辑快速发现清晰且有利可图的交易信号。其模式识别非常直观,无论是新手还是经验丰富的交易者都能立即上手!
您会爱上这款指标的理由:
1. 预设输入设置,无需复杂设置即可立即使用。
2. 可自定义颜色,让您根据个人风格定制图表。
3. 内置参数处理所有繁琐的移动平均线设置,节省您的时间和精力。
适用于所有交易风格:
1. 长期交易?在高时间框架下使用,以获得更强的趋势确认和更高的利润。
2. 短线剥头皮交易?将其应用于较低的时间框架(H1 以下)——只需注意市场噪音,即可获得最佳效果。
全新!更新功能:
1. 移动平均线交叉时实时发出警报——绝不错过任何交易机会!
2. 可执行的交易信号——在交叉点立即判断买入或卖出时机。
3. 精准的入场信息——获取精确的价格水平(卖价或买价)警报,助您自信下单。
无论您是初次开设交易账户,还是正在完善专业交易策略,此指标都是一款可靠的
FREE

AC Pivot Panel – Your Ultimate Pivot Trading Tool The AC Pivot Panel is a powerful yet user-friendly pivot point indicator designed to help traders identify key support and resistance levels with ease. Whether you’re a beginner or an experienced trader, this indicator simplifies pivot trading and enhances your decision-making process. Key Features : Interactive Selection Panel : Easily adjust pivot settings directly on the chart with a compact and intuitive panel. Multiple Pivot Methods : C
FREE
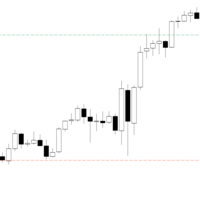
PDHL – simply displays the highs and lows of previous days directly on your chart, providing a quick and visual reference of past key levels. The indicator is lightweight and easily customizable , allowing you to adjust the number of days displayed, the colors, as well as the style and thickness of the lines to suit your preferences. It is designed to be simple and practical, but may not work on all instruments or platforms .
Only teste Tested only with CFDs
FREE

It is a system with many options to help each user find their own settings. There are possibilities to use a filter based on two averages, as well as the choice of whether the system will work at certain hours of the market. The default settings are tested for the eurusd pair. I would recommend that each user do their own testing and find settings that suit their preferences. This is not a ready-made system that you will use without working on it. But it is a good tool to build each user a strat
FREE
The indicator is designed for fast scalping. The principle of operation of the indicator is based on the direction of the Moving Average.
The period and sensitivity of the Moving Average can be adjusted for yourself in the indicator settings. I recommend watching my advisor - Night Zen EA
Subscribe to my telegram channel, link in my profile contacts. Advantages of the indicator: The free version is full, there are no additional purchases The arrows are not redrawn, the signal comes after co
FREE
If you need an advisor on any arrow indicator signals - this utility will definitely help you.
What does the utility do?
It creates a EA file with your indicator signals in a few easy steps: install the indicator with the needed settings on the chart; Select a signal for buy; Select a signal for sell; get the clicker file ! Then you install the file of the EA in the folder Experts and update the terminal. Attention! Set the indicator settings as you need and the same settings will be tak
FREE

STOCH AND RSI ALERT https://www.mql5.com/en/users/earobotkk/seller#products (I have created a dashboard from this product, please take a look by clicking here ) (I have also created an EA from this product, NOW user can go automation, click here ) P/S: If you like this indicator, please rate it with 5 stars in the review section, this will increase its popularity so that other users will be benefited from using it. This indicator notifies and draws an arrow on the chart whenever the main sto
FREE
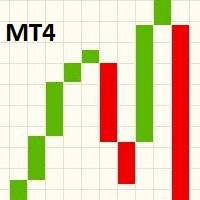
这款指标在主图表窗口里显示一个线突破图表。 为了在主图表窗口里查看线突破图表自己,在主图表窗口里显示一个线突破图表,之后按 F8 在属性对话框里改变 "线图表" 颜色为 "无"。当滚动, 缩放或改变图表的时间帧, 指标将在下一个报价来临时调整积木大小以适合主图表视野。 线突破图表发明于日本,类似于点数图表和 Renko 图表。一位日本交易员描述三线突破图表为 "点数图的更微妙的形式,由市场决定反转而非随意的规则"。线突破图表忽略时间,并仅在收盘价格移动了一定数量后改变。这些图表显示一序列大小变化的垂直线 (或 "积木") (Renko 使用固定积木大小)。绿色积木 (传统的白色) 代表价格上升, 红色积木 (传统黑色) 代表价格下跌。积木在同一方向上连续,直到必要的反转。 当收盘价超过了前期 "X" 根线的最高或最低时,会发生逆转。传统上,"X" 为 3;这个指标允许让您设置不同数量,令您在分析价格走势时更灵活。在网络上有大量资源描述如何构造并使用线突破图表。 还 (选项) 显示了一个 "序列频率" 直方图。直方图显示一系列高低点的分布频率,这些点是过去生成的 "X" 方向的变化。直方
FREE
成交量分解指数 (VDI) VDI 是一种专有的成交量分析指标,用于根据成交量中买卖活动的分解,识别价格走势的强度与方向。 该指标通过将K线价格数据映射到其对应的成交量,直观展示买方与卖方之间的比率,从而帮助交易者更全面地理解市场行为——即有多少成交量来自买方,有多少来自卖方。 计算基于全部可用的交易所数据,使得该指标在分析上更加完整,能够深入揭示市场趋势。 了解交易量是理解市场价格变动的关键因素。该指标为您提供了正是这样的信息。
主要特性 唯一可调参数 : period (默认值为18),用于设定计算买卖成交量所覆盖的K线数量。 核心计算公式 :
买方成交量 ÷ 卖方成交量 ,
用于判断在指定周期内是买方还是卖方占主导。 灵活的周期设置 :
可根据不同交易策略,自由调整统计周期。 1.0的水平参考线 :
表示买卖力量的平衡点,用于判定当前市场情绪。 兼容所有时间周期与交易品种 信号解释 数值 > 1.0 :表示买压占优(看涨信号) 数值 < 1.0 :表示卖压占优(看跌信号) 数值 ≈ 1.0 :买卖力量平衡(中性
FREE

Make no mistake, this is not just another indicator; it's much more than that!
Welcome to a groundbreaking approach! Sunrise Divergence is not just another tool; it represents a deep understanding in how market dynamics are analyzed and traded. This indicator is crafted for traders who seek to navigate the markets with precision, leveraging the powerful concept of asset correlation, both positive and negative, to unveil trading opportunities that many overlook. In the markets, understanding th
FREE

First 50 Downloads Free
AutoLineSaver for 448 Save and restore your chart workspace automatically. | User Manual
1. Overview
AutoLineSaver automatically saves every line you draw on the chart and restores them the next time you open it.
No more redrawing your analysis from scratch. Drop AutoLineSaver onto your chart once, and your workspace is always preserved.
What it saves: • Horizontal lines • Trendlines • Rays (extended trendlines) • Vertical lines • Rectangles • Fibonacci retra
FREE
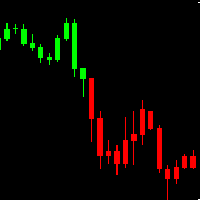
AH Candles MT4 AH Candles MT4 is a new product that allows identifying the current market phase (uptrend and downtrend ).
This indicator paints bars in different colors depending on the current state of the market trend ( Green and Red )
AH Candles MT4 is use for trading currencies
Advantages Suitable for intraday and swing trading. The indicator base on EMA method to calculate Period Parameters It can be used as a standalone tool or together with other indicators.
How to use the prod
FREE
描述: 该指标通过之字形指标衡量趋势或修正水平。 它在图表中显示了检测到的每个低或高电平。
该指标有何用处? 该指标根据之字形参数确定趋势是开始,发展还是结束 该指标确定趋势的方向 组件 水平为正数或负数,取决于趋势的方向和回撤的数量。 其他建议指标 CEF计数水平旨在通过以下指标来工作和补充其信号: 一般指标 选择最佳货币进行交易(CEF点差货币点差) 趋势指标 确定趋势级别(CEF计数级别)(实际指标) 确定趋势强度(CEF趋势力) 信号工具 完整的策略信号指示器(CEF Scalper Pro) 查找订单块模式(CEF订单块信号) 查找市场市场格局(CEF TDI Pro信号) 其他非常有用的工具 确定范围扩展或收缩的概率(CEF范围预测器)
FREE

你的模拟账户在骗你。 在模拟账户上,订单会按你要求的价格精确成交。真实账户却不是这样。新闻时点差扩大,佣金不断累积,滑点悄悄吞掉每笔交易的一部分——而这些在 MetaTrader 的历史记录中都不明显。 TravaRisco Real Cost Monitor 直接在图表上告诉你,交易这个品种实际要花多少钱。 显示内容 1. 点差 当前点差:以点数、价格以及参考手数对应的金额表示 平均点差:近期、当前小时和总体 点差异常偏高时变为红色 2. 每笔交易成本(开仓+平仓) 平均点差成本 每笔交易佣金(根据你的历史自动计算,或手动设置) 平均滑点:请求价格与成交价格之差,基于你自己的订单测量 以账户货币计的每笔交易总成本 “价格需要朝你有利的方向移动 X 点才能保本” 3. 最近 N 天 交易次数和交易手数 佣金、隔夜利息、费用和估算滑点 扣除成本前的结果和净结果 “成本吃掉了你毛利润的 X%” 4. 按小时的点差热力图 24 个方格,每个对应一个服务器小时:绿色 = 便宜,红色 = 昂贵 鼠标悬停可查看数值 数据会被保存,指标运行越久越准确 5. 高点差提醒 当点差超过平均值的 X 倍时提
FREE

Trade Analyzer MT4 Trade Analyzer MT4 是一款专为 MetaTrader 4 用户设计的网页交易分析和账户监控平台。 该平台可同步 MetaTrader 4 的交易活动,并将账户信息整理到结构化仪表板中,用于监控、分析、报告、策略跟踪和交易日志记录。 Trade Analyzer MT4 允许用户通过受支持的桌面和移动网页浏览器查看其交易活动。 连接受支持的 MT4 账户后,您可以使用集中式仪表板监控未平仓交易、查看交易历史、分析账户统计数据、整理交易策略以及维护详细的交易记录。 主要功能 • MT4 账户仪表板
• 未平仓交易监控
• 交易历史分析
• 交易日历
• 策略跟踪
• 交易日志
• 账户绩效统计
• 绩效报告
• 交易通知
• 多账户支持
• 可分享的只读报告 MT4 账户仪表板 在一个结构化的仪表板中查看 MetaTrader 4 交易账户的重要信息。 仪表板可显示: • 账户余额
• 净值
• 可用保证金
• 保证金水平
• 未平仓交易
• 浮动盈亏
• 交易量
• 经纪商信息
• 账户详情 账户信息通过结构化界面进行整理,便于监控
FREE

As a trader you are looking for to enter trades at the perfect time. This indicator takes advantage of any price action and indicates when a certain level has been made and a potential break out is going to be made. THIS IS BEST USED ON THE 1DAY CHART WITH WE TREND LIVE MAX Check LTF (Check Long time frame) feature added to 5mins , 15mins, 30mins 1hr & 4Hr chart which will check the trend on all frames times in particular the 4hr trend. so if a alert is received to buy or sell and the trend is
FREE
Simple but powerfull Trend and Hedge EA for Lisek Levels and Channels Indicator . 1. Download Lisek Levels and Channels Indicator . 2. Backtest and optimize in Strategy Tester. 3. For Agressive Tick Mode set your Chart to M1 Time Frame. 4. To speed up Strategy Tester, set "Show Info" to false ! 5. After backtesting, it’s important to analyse the test results (best profit and smallest drawdown). 6. Test your EA settings on Demo Account. Happy Trading !!!
FREE

as the name suggest Trend Maker Master is a trend scalping indicator that give long and short trading opportunity based on price action and ma style trend filter, the indicator Trend Period and Trend Extra Filter will change arrows signals quality and frequency, this leave a space for trader to come out with good combos for each pair. How to trade : Buy : when white buy arrow prints, set sl below recent swing low, and set tp to 1-1 Risk to reward ratio. Sell : when white Sell arrow prints, set
FREE
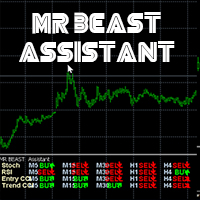
MRBEAST Assistant El indicador MR BEAST Assistant para MetaTrader es un indicador multitemporal que se basa en tres indicadores estándar: el oscilador estocástico, el RSI (Índice de Fuerza Relativa) y el CCI (Commodity Channel Index). Muestra las direcciones de la tendencia actual para los marcos temporales M1, M5, M15, M30, H1, H4, D1, W1 y MN1. Cuando se sigue un indicador de este tipo se tiene una visión clara de las tendencias en todos los marcos temporales importantes. No imp
FREE
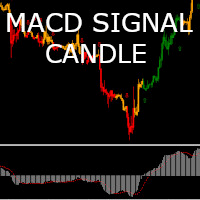
The MACD Signal Candle indicator changes color according to the MACD trends. Colored Candles, based on MACD.
HOW IT WORKS
For a Buy: -If the indicator is above zero, the market is bullish. -If the market is bullish, you can take a stand with green candle signals. For a Sell: -If the indicator is below zero, the market is bearish. -If the market is bearish, you can take a stand with the red candles.
FREE
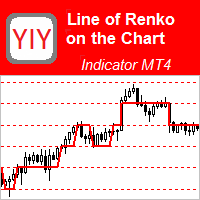
This indicator is the basis for an Expert Advisor that can be categorized as "almost Grail". See details below. This indicator displays the projection of the Renko chart on the price chart. This projection is displayed as a stepped line, not as "bricks" (rectangles). See slides 1 and 2. Abbreviated name of the indicator: LRC – L ine of R enko on the price C hart. The principle of its construction is very simple. First, a grid of horizontal lines (levels) is bu
FREE

Based on famous and useful indicator - Super Trend, we add some features to make this Indicator much easier to use and powerful. Ease to identify the trend of any chart. Suitable for both Scalping & Swing Better to use in the trending market be careful in sideway market, it might provide some fake signals Setting: ATR Multiplier ATR Period ATR Max Bars (Max 10.000) Show UP/DOWN node Nodes size Show Pull-back signals Pull-back filter ratio Period of MA1 Mode of MA1 Period of MA2 Mode of MA2 A
FREE

Rainbow MT4 is a technical indicator based on Moving average with period 34 and very easy to use. When price crosses above MA and MA changes color to green, it’s a signal to buy. When price crosses below MA and MA changes color to red, it’s a signal to sell. The Expert advisor ( Rainbow EA MT4) based on Rainbow MT4 indicator, as you can see in the short video below is now available here .
FREE

九根收盘,十三次计数,以及大多数实现悄悄省略的那份纪律。Exhaustion Count MTF运行经典的setup与countdown配对,完整保留取消与重启规则,标记完美的九,在图表上留下Setup Barrier水平线,并且从不在尚未收盘的K线上打印数字,因此这里的任何内容都不会被重绘,绝不会。免费,没有试用期,没有被锁定的功能。 它只是计数。它不预测方向,也不告诉你该往哪个方向交易。它只回答一个问题:这一波行情是否已经持续得足够久,参与者正在耗尽。 图表上运行着两个独立的阶段,一个setup和一个countdown,各自拥有自己的规则、自己的取消条件,以及在Expert Advisor可读取的缓冲区中各自的位置。 Setup 由一次价格反转开始,连续九根K线的收盘价位于四根前那根K线收盘价的同一侧。不满足条件的K线会把计数重置为零,而不是暂停计数。第八根或第九根K线若突破第六根和第七根K线的极值,就能使setup完美化,产品会在数字后面用一个点标记这一点。setup完成后会留下一条水平线,这里称之为Setup Barrier。 Countdown 十三根K线,不必连续,每一根的
FREE
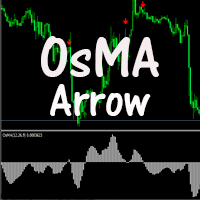
The indicator displays crossing zero level by Moving Average of Oscillator (OsMA) in the form of arrows. The indicator notifies about a signal by means of a pop-up Alert window, or sending notification to e-mail.
Parameters Fast EMA Period - fast EMA. This is an exponential moving average from a price with a short period. Slow EMA Period - slow EMA. This is also an exponential moving average of a market price but with a longer period. Signal SMA Period - MACD SMA. This is a signal line which is
FREE

Read detailed blogpost with screenshots here: https://www.mql5.com/en/blogs/post/771070
What Is "Last Time Here"? Every price move in the market has happened before — or something very similar to it has. "Last Time Here" is an indicator for MetaTrader 4 and MetaTrader 5 that asks a simple question: the last time price was in this exact zone, what did it do next? The indicator identifies the current active ZigZag leg — the most recent swing move from the last confirmed low to the last confirmed
FREE
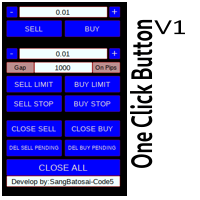
Simple button panel of trade on your chart with OneClick V1 Trial version. This trade panel will make it easier for you.
Equipped with several functions that make it very easy for you. More tools on OneClick VZ version, see here.
This version includes: Open Order Buy Open Order Sell Open Pending Order [Buy Limit - Buy Stop - Sell Limit-Sell Stop] Close ALL orders
Close Order Buy Close Order Sell Delete Pending Order [Buy Limit - Buy Stop - Sell Limit-Sell Stop] ENJOY IT!!! ONE CLICK V1 [TRIAL
FREE

MQT Lot Size Calculator 根据您选择的风险计算精确的手数——按账户净值的百分比 或固定金额——通过图表上三条可拖动的线:入场、止损和止盈。免费、轻量,且仅 用于计算:它绝不开仓、改单或平仓。 工作原理(逻辑说明): 方向由止损线的位置推断(在入场价下方为买入,上方为卖出)。 风险金额 = 账户净值 x 风险百分比(或您的固定金额)。 每手亏损 = 止损距离 / 最小变动价位 x 每跳价值。 手数 = 风险金额 / 每手亏损,始终向下取整到您经纪商的手数步长——绝不会 让您承担超过设定的风险。 面板显示:方向、入场/止损/止盈的价格与点数距离、以账户货币计的风险、计算 出的手数、取整后的真实风险、盈亏比、止盈处的潜在利润,以及所需保证金(若 超过可用保证金会发出警告)。 说明: 它只是一个计算器,绝不开仓、改单或平仓。 适用于任何品种和账户货币。 轻量:使用原生图表对象,无 DLL,无需联网。 有疑问或建议?请留言——24 小时内回复。
FREE

Range Filter - BreakOut EA
What is the Range Filter? The Range Filter is an innovative tool designed to smooth out market noise and highlight meaningful price movements. Rather than focusing on every small fluctuation, the Range Filter eliminates insignificant activity, allowing traders to see trends more clearly. The idea comes from the QQE’s volatility filter, but instead of applying it to RSI, this approach is applied directly to price action. Here’s how it works: A smoothed average of t
FREE

This indicator will show yesterday and today high low, very useful to understand the market sentiment. To trade within the range/ break out. Previous day low- can act as support- can used for pull back or break out Previous day high- can act as resistance- can used for pull back or break out The previous day high low breakout strategy refers to the day trading technique that provides traders with multiple opportunities to go either long or short . The main idea is to identify the trend in its m
FREE
Our modernized version of the popular channel TMA_TRUE indicator for MT4, which provides information on the main points of trend reversal and momentum exhaustion by drawing a channel on the chart, also draws arrows of signals for buy and sell. As a result, traders can identify bullish and bearish price reversal zones and BUY and SELL accordingly.
This indicator works well on all instruments and on all Timeframes.
This indicator is the basis of our Channel Trigger EA, which you can buy in MQL
FREE

Heiken Ashi Toggle – Instant Chart Mode Control for MT4 Heiken Ashi Toggle (Also spelled Heikin Ashi) is a small utility indicator for MetaTrader 4 that provides Heiken Ashi candles — with one key upgrade: instant ON/OFF control directly from the chart . Instead of constantly adding, removing, or reloading indicators, this tool allows traders to switch between standard candlesticks and Heiken Ashi visualization with a single click. What This Indicator Does Displays classic Heiken Ashi candles
FREE

什么是突破优化器EA? 让我们暂时完全诚实。 MQL5上有许多产品承诺会带来疯狂的回报,分享您见过的最惊人的回测等等。 但是,它们通常要么过于复杂,要么在描述中直接撒谎。 这个机器人是一个突破EA。 它是在您选择的时间范围内突破范围时买入或卖出。 它不是奇迹机器人,但如果使用一些常识,它可以带来利润,并能够仅靠自己来驾驶一个完整的投资组合。 我有2个实时信号,其中该机器人代表了90%的交易,即Sigmaset和Sigmaset2。 此外,我有一个仅包含一个版本此机器人的演示帐户。 因此,没有废话,有真正的实时可查看结果。 如果您只想拥有一个承诺您会变得富有并几乎永远不会发生亏损的机器人,请不要购买。 但是,如果您正在寻找没有欺骗的真正运行在真实价格行为上的机器人,那么它可能会在长远的未来有效。 那么我们可能在做生意。 这个机器人可以实现什么策略? 开学跑:一种利用DAX开盘价从09:15到09:30的价格走势的策略。 这是由传奇交易员汤姆·豪加德(Tom Hougaard)发明并设想的。 如果您想了解有关此策略的更多信息,应该访问他的网站,在该网站上他详细列出了此策略。 此机器人只是一
FREE

**MTF Confluence Dashboard** is a free, self-contained indicator: a compact on-chart panel that classifies trend direction (Bullish / Bearish / Neutral) across up to six timeframes (M15, M30, H1, H4, D1, W1) and shows a one-line bias summary.
Trend per timeframe is based on a fast/slow EMA relationship, confirmed by price position relative to the fast EMA (not a raw EMA cross) to cut down on whipsaw:
- **Bullish** — fast EMA above slow EMA, and price above the fast EMA - **Bearish** — fast EM
FREE

Sniper Trend Fusion This indicator is a powerful all-in-one trading tool designed to simplify chart analysis and improve decision-making. It combines multiple proven techniques into a single system, helping traders identify trend direction, volatility, key price levels, and market structure without clutter.
Instead of switching between multiple indicators, everything you need is integrated into one smooth and efficient interface. Key Advantages All-in-One System
Combines trend, volatility, sup
FREE

Of course. Here is the product description for "RenkoVP for MetaTrader 4 RenkoVP for MetaTrader 4 (EURUSD Only) RenkoVP is a powerful, fully online Renko-based indicator designed specifically for analyzing the EURUSD currency pair. It provides traders with a clean, noise-free view of market structure by combining traditional Renko bricks with advanced volume profile analysis, dynamic Fibonacci tools, and automatic pattern recognition—all without the need for problematic offline charts. Core F
FREE

Trailing Stop Manager with Break Even is a MetaTrader 4 utility that moves your stop loss automatically to protect profit as price advances. Unlike the platform's single-mode trailing stop, it offers four professional methods plus break-even handling, and it manages all matching positions on any symbol. Features Four trailing modes for different conditions: Fixed Pips, ATR-based, Step, and Break-even plus Trail (two-phase). Fixed Pips: classic trail that starts after a set profit and follows at
FREE

Title: EGO ea - MQL4 Expert Advisor Description: Unlock the full potential of automated trading with Ego ea, a powerful MQL4 Expert Advisor designed to enhance your trading experience. Developed by experienced traders and programmers, this EA incorporates advanced algorithms and smart risk management to optimize your trading strategy. Key Features: Intelligent Trading Logic: Ego EA utilizes a sophisticated trading algorithm that adapts to various market conditions, ensuring consistent performanc
FREE

This indicator is designed for binary options. Based on proprietary divergence of the CCI indicator. A sell signal: A down arrow appears on the chart. A buy signal: An up arrow appears on the chart.
Input parameters History - the number of bars in history for calculation Period CCI - period of the CCI technical indicator Up border - overbought limit for calculation of the divergence Down border - oversold limit for calculation of the divergence Price - price for the indicator calculation Alerts
FREE

Auto SLTP Pro can help you setSL & TP automatically for positions & pending orders * 2 modes: - Points - USD * Symbol Filter: Select All or a specific symbol * For pending orders: Select true to set SLTP for pending orders Note: Only valid for positions (pending orders) without SL&TP! Join my channel here for more useful management tools: * Remote Tools via Telegram: Super Assistant, Master Close, Master Control, Master Notify * Free Tools: Tele Notify, Price Alert, Quick Close
FREE

概述 真正强弱指数 (True Strength Index, TSI) 指标是一种动量振荡器,在 MT4 的独立窗口中显示。它通过两次指数移动平均 (EMA) 平滑动量 (MTM) 及其绝对值,然后计算两者的比值并乘以 100。TSI 有助于可视化市场趋势的强度和潜在的转折点。 主要功能 双重 EMA 平滑,减少噪音,呈现更清晰的曲线 信号 EMA 叠加,辅助判断买卖时机 自动缩放至 –100 至 +100 范围内 在 0 和 ±50 位置绘制水平线,提升可读性 支持自定义快速 EMA、慢速 EMA 和信号 EMA 周期 安装方法 在 MT4 中选择“文件”→“打开数据文件夹”。 将 TSI.mq4 复制到 MQL4\Indicators 文件夹。 重启 MT4,或在“导航”面板中右键单击并选择“刷新”。 在指定图表上,依次点击“插入”→“自定义”→“TSI”,调整参数后点击“确定”。 参数说明 变量 默认值 说明 FastEMAPeriod 7 第1阶段(快速)EMA 平滑 MTM 的周期 SlowEMAPeriod 7 第2阶段(慢速)EMA 进一步平滑的周期 SignalEMA
FREE

具有双线信号、多时间框架支持、可自定义视觉信号和可配置警报系统的DIDI指标(3均线比率)。
自由职业编程服务、更新及其他TrueTL产品详见 MQL5主页 。
非常欢迎您的反馈和评价!
什么是DIDI? DIDI是一个比率指标,显示三条不同周期移动平均线(MA)之间的关系:Curta(短期)、Media(中期)和Longa(长期)。指标通过将Curta和Longa均线除以Media均线来计算两条比率线,Media均线作为1.0的参考水平。 DIDI通过显示快速和慢速移动平均线与中期均线的关系,帮助识别趋势强度和潜在反转点。高于1.0的值表明均线在参考线之上(看涨),低于1.0的值表明均线在参考线之下(看跌)。Curta线和Longa线之间的交叉,以及1.0处的水平交叉,通常被用作交易信号。 功能特点: 双线比率指标:Curta(短期/中期比率)和Longa(长期/中期比率) 带有箭头和垂直线的视觉信号标记 三个独立信号缓冲区,可配置触发条件 双线信号检测选项:方向变化、画线交叉、水平交叉、峰值/谷值 每个信号可配置警报功能(电子邮件、推送、声音、弹窗) 带插值方法的多时间框架(
FREE
MetaTrader市场提供了一个方便,安全的购买MetaTrader平台应用程序的场所。直接从您的程序端免费下载EA交易和指标的试用版在测试策略中进行测试。
在不同模式下测试应用程序来监视性能和为您想要使用MQL5.community支付系统的产品进行付款。
