 MetaTrader 5
 专家
专家
 指标
指标
 程序库
程序库
 实用工具
实用工具
 窗口小部件
窗口小部件
 规则
规则
适用于MetaTrader 4的免费EA交易和指标 - 49
 EA交易自动执行市场交易,而指标可使您更准确地分析报价并预测价格行为。
通过这些应用程序,您将能够更明智地在MetaTrader 4执行交易,抓住更多的交易机会。
EA交易自动执行市场交易,而指标可使您更准确地分析报价并预测价格行为。
通过这些应用程序,您将能够更明智地在MetaTrader 4执行交易,抓住更多的交易机会。 
This is an adaptive ZigZag based on modification of HZZ indicator (original source code is available in this article ). Most important changes in this version: two additional indicator buffers added for zigzag evolution monitoring - they show cross signs at points where zigzag direction first changes; zigzag range (H) autodetection on day by day basis; time-dependent adjustment of zigzag range. Parameters: H - zigzag range in points; this parameter is similar to original HZZ, but it can take 0
FREE

Indicator description. The “ Alligator Analysis ” ( AA ) indicator allows you to build various (by averaging types and by scales) “ Alligators ” and their combinations, i.e. allows you to analyze the state of the market based on the correlation of this state with a whole range of different " Alligators ". The classic " Alligator " by Bill Williams is based on moving averages and Fibonacci numbers, which makes it one of the best indicators now. The classic " Alligator " is based on
FREE
Spread Monitoring is a unique product for analyzing a spread. Unlike most similar indicators, Spread Monitoring uses ticks rather than bars allowing you to detect abnormal spread expansions. Features
Works on ticks rather than bars. Simple and easy indicator configuration. Works on all timeframes. Works on any financial instrument. No repainting.
Parameters
Total - number of displayed ticks. clrSpread - indicator line color.
FREE

NostradamusMT4 - мощный индикатор из набора профессионального трейдера. В основе индикатора лежит авторский метод Андрея Спиридонова расчета цены (ESTIMATED PRICE) для текущей цены свечи. Данный индикатор является самостоятельной торговой системой. Индикатор подходит для работы на классическом рынке и рынке бинарных опционов.
Преимущества
Индикатор не перерисовывается; Работает на любых временных интервалах; Работает с любыми торговыми инструментами; Отлично подходит для скальпинга и торговли би
FREE

Indicador "Supply and Demand Channels" para MetaTrader: Potencia tu Trading con Claridad y Precisión El indicador "Supply and Demand Channels" para MetaTrader es una herramienta avanzada diseñada para brindar a los traders una visión nítida y precisa de las zonas clave de oferta y demanda en el mercado. Basado en el principio fundamental de la ley de oferta y demanda, este indicador ofrece una interpretación gráfica única de las fuerzas que impulsan los movimientos de precios. Características De
FREE

Indicador "Heikin Ashi Master" para MetaTrader: Transforma tu Análisis con Velas Japonesas Suavizadas El indicador "Heikin Ashi Master" es una herramienta innovadora diseñada para traders que buscan una perspectiva única del mercado a través de las Velas Japonesas. Compatible con MetaTrader, este indicador suaviza la acción del precio, ofreciendo una interpretación simplificada y visualmente atractiva de las tendencias y cambios en el mercado. Características Destacadas: Suavizado de la Acción
FREE

TH3ENG CURRENCY STRENGTH SCANNER The best currency strength reader based on more than 4 excellent modes, based on Price action and Volume with various algorithms. This indicator reads all pairs data to measure and find the best results of all currencies and arrange it in a separated dashboard panel.
You can find the strongest currency and the weakest currency, then trade on them pair. NOT COPLICATED NOT REPAINTING NOT LAGING
Input Parameters
=== SYSTEM SETTING === Calc. Mode ==> Calculation m
FREE
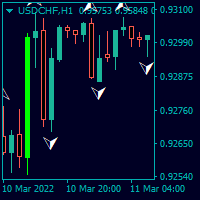
Trendfinder SMA With Zone and Alert are Colored candlesticks showing the trend based on two SMA as Signal and two SMA as a Buy and Sell Zone and the slope of the slow moving average. This indicator will give you the color change on the next bar on the confirmation candle and will provide alert on Buy and sell signal, when it enters the buy and sell zone and when the market test the buy or sell zones as support or resistance and will never repaint . This indicator has the following: 2 SMA for th
FREE
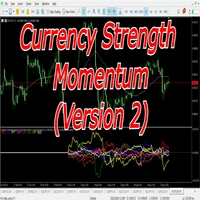
The currency strength momentum has a lot of similarities with currency strength meter presented in the previous page, but the difference are much more pronounced. You can try putting both in the same chart and see the difference in results. Currency strength momentum measures strength of a currency based on (you guess it) it's momentum relative to other currencies, while currency strength meter measures the strength of a currency based on pips it has moved in a certain direction.
FREE

The presented product is the author's implementation of the REI (Range Expansion Index) indicator developed by Thomas DeMark. REI Oscillator AM is an indicator that measures the rate of price change and signals overbought/oversold conditions if the price shows weakness or strength. The indicator value changes within the range from -100 to +100. Thomas DeMark suggests using the default period of 8 and the following algorithm for using the indicator: When the price rises above level 60 and then fa
FREE

The indicator "Elvis A" is designed for a very strict determination of the reversal. With the author's settings, it is installed on the D1 chart. It will skip many signals and choose only the most reliable ones. Therefore, it is better to set it on several currency pairs.
The screenshot shows an example of this indicator in the form of an expert Advisor on a currency pair with a very large spread.
FREE
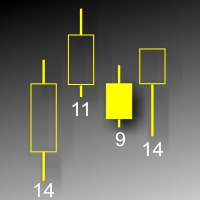

MTF (Multi-Timeframe) Countdown Timer indicator, designed for MetaTrader 4 (MT4). The indicator displays the remaining time for new candles across multiple timeframes, along with other essential trading information such as server time, local time, and the spread of custom currency pairs. Features: Multi-Timeframe Countdown : Displays the time remaining for the next candle in up to six configurable timeframes, such as M5, H1, or D1. Customizable Appearance : Background, border, and text colors ca
FREE

这是免费产品,欢迎您随意使用!
如果您喜欢这个指标,请留下简短的好评!非常感谢!
点击这里查看高质量的交易机器人和指标! ............................................................................................... Crypto_Forex 指标“余额和净值显示”适用于 MT4,是一款出色的辅助交易工具。 ............................................................................................... - 该指标显示账户当前余额和净值。 - 可以将显示值放置在图表的任意角落。 - 还可以设置颜色和字体大小。 这是 MQL5 网站上提供的原创产品。
FREE

A new interpretation of the classical indicator in the form of an oscillator for a more accurate representation of the situation on the market. Less lagging than the standard Alligator. All settings are fully accessible, such as the type and prices for which it is built. Thanks to the additional parameters, it became possible to fine tune.
Distinctive features Does not redraw. Additional parameters for fine tuning. Works on all timeframes and symbols. Suitable for manual trading and developmen
FREE
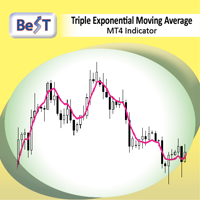
Triple Exponential Moving Average ( TEMA ) is a moving average (MA) that gives the most weight to recent price data. TEMA is more reactive to all price fluctuations than a Simple Moving Average (SMA) or an Exponential Moving Average (EMA) or even a Double Moving Average (DEMA) and surely can help traders to spot reversals sooner because it responds very fast to any changes in market activity. TEMA was developed by Patrick Mulloy in an attempt to reduce the amount of lag time found in trad
FREE

The adviser finds the trend of the currency pair on a given number of bars, then determines the time of the onset of correction. If the trend is strong enough, and the correction becomes equal to the one specified in the parameters, then the adviser can open a trade in the direction of the trend, if additional indications of indicators confirm the opening of the trade. You can set different correction values and many other parameters. This version of the Expert Advisor is free, it has limitati
FREE

The Close script is a simple tool that allows traders to close their trades by three methods. Just run the script and choose the close method.
Closing methods Symbol - Allows closing all open trades for a specific symbol. All_Trades - Allows closing all open trades. Magic_Number - Allows closing all open trades according to their magic number. Recommendation AutoTrading functions must be activated. If the AutoTrading function is disabled, the script will not work. EA should be stopped.
FREE

Tired of manually adjusting stops? This powerful EA automatically secures your profits with dynamic trailing stops, protecting gains while letting winners run. No trade openings – just effortless risk management for your existing positions. Why Traders Love This EA Never Miss Profits Again Auto-locks gains as price moves in your favor. Eliminates emotional decisions – sticks to your predefined rules. Three Smart Trailing Modes Choose the method that fits your strategy: F
FREE

产品标题 Smart RSI (MT4) – SmartView 系列的一部分 简短描述 具有独特用户体验的 RSI 指标,在 MetaTrader 平台上提供。提供以前不可用的高级功能,例如双击打开设置、隐藏和显示指标而无需删除它们,以及以全图表大小显示指标窗口。设计用于与 SmartView 指标系列的其余部分无缝协作。 概述 SmartView 系列通过创新功能为 MetaTrader 平台上的指标提供独特且与众不同的用户体验,使指标管理更快、更轻松。每个指标都配备了图表上的智能控制面板,显示基本信息并提供对所有重要功能的快速访问。 以前不可用的独特功能 SmartView 系列提供使指标工作更简单、更快速的高级功能: 双击打开设置: 无需在指标列表中搜索,双击面板上的指标名称即可直接打开设置窗口。 隐藏和显示指标: 一键隐藏和显示指标,无需从指标列表中删除和重新添加它们。 以全图表大小显示指标窗口: 在子窗口中,您可以最大化指标窗口以全图表大小显示,并临时隐藏其他窗口。 折叠和展开子窗口: 折叠子窗口以减少其高度并节省屏幕空间,然后在需要时将其展开回全尺寸。 重新排列子窗口:
FREE

ClickDrag可以轻松地在图表上画线和移动对象。
点击,然后拖动,开始绘制趋势线。
水平移动鼠标可以画出价格线。
垂直移动鼠标可画出日期线。
现有的线和对象可以通过点击和拖动来移动。
显示开始点到结束点之间的价格和时间差。
开始后点击&拖动。
左右摇动来改变颜色。
向上和向下摇动可以删除。
- 什么是Click & Drag ?
1. 按下鼠标左键(按)。
2. 松开鼠标左键(释放)
3. 按下鼠标左键(按住)
4.保持按住并移动鼠标(拖动)
这个动作允许你画趋势线,移动对象,改变颜色和擦除。
箭头、价格对象、斐波那契、吉安线、周期线和形状也可以移动。
如果你不小心画了一条线,请移动到图表外,然后释放按钮。这条线就会消失。
比中间点击更容易。比中间点击的可见性更好。
但它不能用于不可选择的对象。
外汇的PIPS和差价合约的货币。
FREE

FTU 斐波那契 该指标绘制回撤型入场系统的斐波那契水平 ** 观看视频获取策略建议 特点: 多个斐波那契水平可调 更改范围中的条形图颜色和数量 2 条线表示 50 条之前的高低回撤,2 条线表示 20 条 线显示 38 和 61 斐波那契水平 FTU fěi bō nà qì gāi zhǐbiāo huìzhì huí chè xíng rù chǎng xìtǒng de fěi bō nà qì shuǐpíng ** guānkàn shìpín huòqǔ cèlüè jiànyì tèdiǎn: Duō gè fěi bō nà qì shuǐpíng kě tiáo gēnggǎi fànwéi zhōng de tiáo xíng tú yánsè hé shùliàng 2 tiáo xiàn biǎoshì 50 tiáo zhīqián de gāodī huí chè,2 tiáo xiàn biǎoshì 20 tiáo xiàn xiǎnshì 38 hé 61 fěi bō nà qì shuǐpíng yòngtú: Mùdì shì yánjiū
FREE

交易复制器 - 投资者密码 - 复制交易 - MT4 x MT5 跨平台
注意:您需要在客户账户所跟随的主账户上安装“Mirror Copier Master”,并在跟随主账户的客户账户上安装“Mirror Copier Client”
博客: https://www.mql5.com/en/blogs/post/756897
工作原理:
https://www.youtube.com/watch?v=V7FNpuzrg5M
MT4 版本
主账户: https://www.mql5.com/en/market/product/114774
客户端: https://www.mql5.com/en/market/product/114843
MT5 版本
主账户: https://www.mql5.com/en/market/product/114775
客户端: https://www.mql5.com/en/market/product/114844
“Mirror Copier”EA 是一款功能强大的工具,旨在实现不同 MetaTrader(MT4 或 MT
FREE
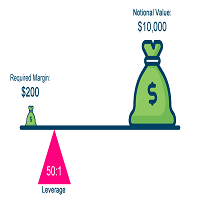
很棒的实用工具,您可以实时监控账户的平均数和交易品种的点差 这将知道如何准确地识别数据,例如,能够知道您是否有 Prop Firm 帐户、知道正确的平均数以及点差是否被操纵等,以进行精确的批量计算
杠杆和点差指标的组合。 自动检查交易账户杠杆和点差的工具。 在所有经纪商外汇股票中工作。 有助于监控外汇经纪商在经济新闻公告期间是否改变杠杆和价差。 当前交易品种的实时点差检查。 交易账户实时杠杆检查。 易于理解的设计和快速刷新 ETC
杠杆是外汇市场的一个特殊性,它可以让您通过相对较少的投资赚取大量资金。 术语“杠杆”通常被翻译为杠杆或调平。 许多外汇经纪商提供了拥有非常有趣的杠杆的可能性。 例如,1:100的杠杆是指可以以比投资金额大100倍的金额进行外汇交易。 其结果是,在外汇市场上可以获得比实际投资大得多的利润,但损失的风险也更大。
FREE

Double Price Channel 设置中指定的特定数量柱的价格通道指标。
指标线代表动态支撑或阻力位。上限为一定周期数的最高价,下限为最低价。与基于收盘价的移动平均线不同,该指标不会因小幅波动而“分心”。仅当边界发生变化时才会重新计算。如果是后者,那么值得认真思考一个新趋势的走向。有些策略是在一张图表上同时使用两个不同时期的指标。在这种情况下,周期较短的指标位于第二个指标内。 指标设置说明: Width_Bars - 指标周期 高度 - 高度,以磅为单位 Double Price Channel 设置中指定的特定数量柱的价格通道指标。
指标线代表动态支撑或阻力位。上限为一定周期数的最高价,下限为最低价。与基于收盘价的移动平均线不同,该指标不会因小幅波动而“分心”。仅当边界发生变化时才会重新计算。如果是后者,那么值得认真思考一个新趋势的走向。有些策略是在一张图表上同时使用两个不同时期的指标。在这种情况下,周期较短的指标位于第二个指标内。 指标设置说明: Width_Bars - 指标周期 高度 - 高度,以磅为单位
FREE

Download Trade Manager EA by Mr_Green76 to manage your trades on MetaTrader 4 – FREE
️ Dynamic TP/SL Control – Set dollar or percentage-based targets
️ Smart Partial Closes – Auto-lock in profits or limit losses
️ One-Click Control Panel – Manage trades visually, close charts automatically
️ Live P/L Labels – Real-time stats on your chart
️ Save/Load Presets – Seamless session-to-session trading
FREE

Divergence Reader - индикатор который поможет Вам идентифицировать на графике дивергенцию и конвергенцию.
Настройки Type - выбор типа сигнала (дивергенция, конвергенция, оба сигнала); Minimum length of divergence (Candle) - минимальная длинна сигнала (в свечах); MACD SETTINGS - настройки индикатора МАСD; Важно! Индикатор не рисует графику на истории! Для визуальной проверки индикатора рекоммендую использовать тестер.
FREE

PRO VERSION This free indicator change timeframe of charts(up to 3) at the same time,by clicking a label. If you click the label(shown below),timeframe of charts will change. If you click again,timeframe of charts restore.
You can change the position of the label.
You can change charts up to 3 charts(a paid version enables up to15 charts). You can add second,third timeframe changer label.
This indicator is very useful for speed trading.
There is a more powerful PRO VERSION . The paid versio
FREE
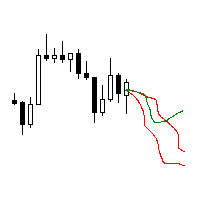
The utility searches the price history looking for the pattern similar to the one within a specified interval. The length of a pattern and a specified interval is the same and set in bars. Similarity is estimated by comparing the bars' body colors, size and shadows. The subsequent price movement is displayed as lines for all detected patterns. The color of the lines defines the degree of similarity. The movement length is set as a number of bars. Search for patterns and visualization are perform
FREE

RSI indicator with signal lines, at the intersection of which a corresponding notification will be issued, which can be in the form of a normal alert, or in the form of a user sound file.
The indicator also has the function of sending push-notifications and email notifications at the intersection of these levels.
The values of the levels can be set independently in the indicator settings, and, if desired, they can be changed and configured directly in the indicator window. This product is a
FREE
Session Timers (MT4) Session Timers adds a clean ribbon at the bottom of the chart showing the time until open and time until close for major FX sessions. While a session is open, a progress bar fills in real time. This is a charting utility; it does not provide trading signals and does not guarantee any profit. Sessions covered Sydney Tokyo Frankfurt London New York Main functions Countdown to the next session open/close for each market. Live progress bar while a session is active. Works on al
FREE

【MT4 Edition】One-Click Theme Changer: Instantly Switch Up Your Chart's Look! "If only changing chart colors wasn't such a hassle..." Sound familiar? We heard you! Introducing the "Theme Changer" for MT4 – a handy indicator that lets you instantly switch your chart's color scheme with a single click! If you need the MT5 version, please click the link below: MT5 Theme Changer No more fiddling with complicated settings windows. With just one button on your chart, you can transform its appearance i
FREE

Created for signal providers, as well as for participation in various forex contests(and not only), can independently open an unlimited number of orders on the indicators Stochastic Oscillator A series of experts: Lucky Star RSI and MACD, Lucky Star WPR, Lucky Star RSI, Lucky Star MA, Lucky Star SO, Lucky Star MACD, Lucky Star MA and SO, Lucky Star MA and MACD , Lucky Star SO and MACD the probability of winning real money in management or bonuses to real accounts ( read more on this in my bl
FREE

This Ea is for the sole purpose of protecting your account.
When the basket of operations present in the terminals reach a set profit in currency terms, the expert will close all trades.
It will replicate the same behavior if the loss limit is reached.
It is a simple but at the same time useful expert advisor for safeguarding the account and always keeping it active.
It can be placed on any time frame or graph, the important thing is that it is inserted only once.
FREE

EURUSD H1 Simple Martingale that works on daily swing levels, low DD, TP and SL defined on the basis of certain pre-set calculations in the algorithm, executes one trade at a time, weekly trading no overnight on weekends, possibility to establish customized exit times, possibility of customize money management. average return of 7.92% per year with the factory settings of the V1, it is always constantly updated, it is recommended to use it with a GMT +2 server TESTED SINCE 2003
Happy trading
FREE

Trading History - The best visual indicator of trade history.
Shows closed and current deals on the chart.
Closed deals are shown with a solid line, current ones - with a dotted line.
Positive trades are displayed in aqua color, negative ones - in red color .
The panel displays the number of closed and current pips and their profit. The indicator is perfect for trading analysis.
FREE

The script sets Fibonacci levels on the chart using maximums and minimums visible on the chart. The script names Fibo with such timeframe on which it has been launched (Fibo D1 or Fibo M30, etc.), therefore preserving previously constructed levels on different time charts. This instrument will be useful for those who start studying Fibonacci levels and those who need to form these levels in a speedy fashion. The script does not have additional settings. Fibonacci lines can be amended in standard
FREE
In the dynamic world of trading, visual acuity is paramount for making informed decisions. For traders who struggle with color blindness—a condition that affects approximately 5-10% of males and a much lower percentage of females—distinguishing between buy and sell signals can be particularly challenging. Recognizing this unique challenge, we are proud to introduce “Open Buy Sell Color”, a MetaTrader 4 script designed to enhance visual clarity for all traders. This tool offers customization o
FREE

~~~~~Product Description~~~~~ This Ea can use to modified all Sell Limit (SL) or Take Profit (TP) entry with same symbol or not to value that u entry on input box . Sell Limit (SL) can be use as Breakeven (BE) when u entry value on input box . Only if empty = True , just change all value follow input box if your order not set Sell Limit (SL) or Take Profit (TP) . May be some broker delay to use this EA Just trade with amount you dare to lose .
FREE

Indicator for the 4th strategy of the Pipsurfer EA. This indicator will allow the user to visually see the points of entry for strategy 4 of Pipsurfer. In the settings you will be able to adjust the parameters to mix and match to your trading style and find the settings that you want to either trade manually or tune the EA to do. Strategy 4 uses a market structure trend continuation approach to trading and looks for confirmed highs in downtrends and confirmed lows in uptrends to find great trend
FREE

The Cossover MA Histogram indicator is a simple tool showing the trend based on crossover of moving averages. Simply specify two mobving averages and addicional parameters like MA method and Applied price. When fast MA is above slow MA the histogram is green, indicating an uptrend. When MA fast is below MA slow the histogram is red, indicating an downtrend.
FREE
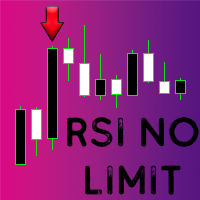
Questo indicatore personalizzato per MetaTrader 4 (MT4) genera segnali di acquisto e vendita basati sulla variazione percentuale dell'RSI (Relative Strength Index) rispetto a un periodo specifico. Ecco come funziona in breve:
1. L'indicatore calcola l'RSI per il periodo specificato (`RSI_Period`) e confronta il valore RSI corrente con quello di un numero di barre precedenti (`Bars_Back`).
2. Calcola la variazione percentuale dell'RSI tra i due periodi.
3. Se la variazione percentuale supera
FREE

基于波段交易策略,使用低风险的交易策略来最大程度地尽量及时的获取利润. 策略原理 1、进场:点差限制,时间限制,ATR限制,确保波幅不会太大,布林带上轨开空单,布林带下轨开多单。 2、出场:点差限制,点差太大了平不了仓,这个请注意,平台时间0-1点点差会很大。多单在中轨上平台,空单在中轨下平仓。中轨就是布林带用到的那根均线,不知道的,自己了解下布林带的原理. 使用说明 1、适用品种:GBPCAD,GBPAUD,GBPNZD,EURNZD,EURAUD,EURCAD,AUDCAD,AUDCHF等等. 2、适用周期:M5,或者M15. 3、时间设置:参数中设置的是平台时间,须注意GMT的偏离换算........
FREE

This is application readymade scanner for the traders, you can scan your watch list symbols, explanation timeinterval is the refresh rate of the symbols column height is the number of the symbols you want to scan, high1 and high2 are the comparison of the last two candles low1 and low2 are the comparison of the last two candles l1 is the last candle and l2 is the previous candle. other things are self explanatory, you can message me for any explanation, this indicator is more than worth 300US
FREE
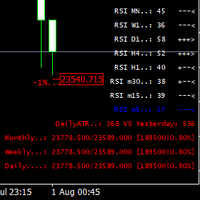
This indicator was created most for personal use. I decided to look up the last 3 bars of RSI, it is good for scalping or for weekly trading and looks as universal fx-toy. In menu you can turn on daily percentage gain info, it is good for crypto as for me, weekly and monthly gains also included as informers. Short ATR helps to determine when price was stopped and entry for pulse pump/dump. The filter of numbers of RSI can be tuned for overbought/oversold values with colors you needed. Exam
FREE

Indicator showing the breakout after at least X candles of the same sign, followed by an opposite candle. PARAMETERS: BARS TO SHOW = Story of Indicators (0 = all bars) Consecutive Bars for Breakout = How many Bars of the same direction and after a Bar with opposite direction Minimu Point between H/L = To consider a bar valid, she must have a Minimun Hi/Lw value Minimu Point between O/C = To consider a bar valid, she must have a Minimun Open/Close value Graphics are self-explanatory
FREE

Velvet RVI is intended for use with the Velvet advanced ordering layer. It is based on the algorithm for the Relative Vigor Index, provided by Investopedia here . All of the data it displays is accurate and verified against the internal API function iRVI, when it is detected by the ordering layer. In order to place orders with the Velvet RVI indicator, the ordering layer must be installed and running. Ordering from the Velvet RVI indicator requires that "Velvet Ordering Layer" ( found here ),
FREE
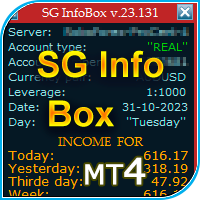
The "InfoBox" utility is designed to display the presence of open orders, the number of lots, current profit and much more in one window. The version for the MT5 platform is here .
You've probably encountered a situation where you have an advisor that works on a currency pair, but information about its operation: - orders and their number, the size of the spread for the instrument, the volume of lots on the market, drawdown and much more - are scattered in different places of the terminal and
FREE

It's a simple but useful tool for creating a grid based on Envelopes.
Only 2 parameters can be set: 1) "Period" - the period of all visible Envelopes (i.e. 4) and 1 Moving Average (Envelopes axis), 2) "Deviations Distance" - the distance between Envelopes.
Naturally, the colors of all 9 lines can be changed as desired. It works with everything that is available in your Market Watch.
Good luck!
FREE
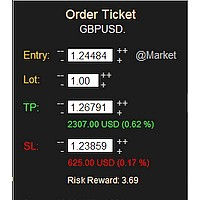
MONEY MANAGEMENT IS A CRITICAL COMPONENT OF SUCCESSFUL TRADING
One of the most important aspects of money management is risk management. YOU need to have a clear understanding of the risks associated with your trades, and mitigate those risks. This free MT4 indicator allows you to efficiently and easily protect your capital and avoid catastrophic losses. Download it and use it before every single trade! ***Please comment, rate and share it to your friends if you like it***
Tags: money managem
FREE
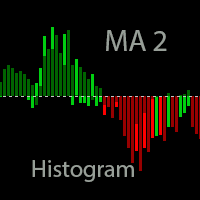
The indicator is based on two Moving Averages. Its only difference from traditional indicators is that it is presented as a histogram. The histogram has four colors; each color represents a MA with its own period. In case of a descending trend, if a price is lower than a moving average, the indicator displays a value lower than the red zero level. In case of ascending trend, the indicator value is higher than the green zero level. Parameters: Period MA 1 - Period of the first moving average. MA
FREE

This panel is designed for manual binary options trading. It is possible to set the position volume and the expiration time. Note: make sure your broker supports binary option trading via the MetaTrader 4!
Settings Ask confirmation - ask for additional confirmation before opening; Magic number - unique identifier of opened positions.
FREE
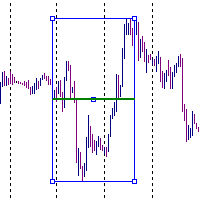
It is just an alternative fibo lines, because mt4 have is a very strange drawing of fibo lines A simple Box (Rectangle) graphic element with adjustable levels binding: it is possible to specify up to 17 custom levels, all rectangles on the chart with the given prefix in their name are processed. Levels are specified in % of the height of the rectangle. A convenient graphical element for analyzing charts by growth-correction levels. Enjoy your work!
FREE

Expert Advisor uses 2 ATR indicators and Bands for Enter trades. the trades will be closed after interaction with second Band indicator. tested and optimized from 2010 on IFCMarkets. default settings for GBPCAD 15m chart. best performance on ranging markets. can be optimize for trading more symbols and timeframes. EA uses grid and method.
trading deposit: 1000 and higher. This EA operates only once per bar opening. Fast methods of strategy testing and optimization are valid.
FREE
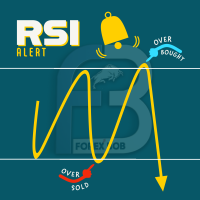
RSI PHONE ALERT RSI Alert is an amazing tool to get alerted on your mobile phone when Overbought/Oversell levels reached on RSI indicator. So that traders who doing manual trading can execute their trades from mobile phone while following their RSI strategy, as most of the traders use RSI for entering their trades. New suggessions are welcome INPUTS RSI levels RSI period Start/End time of the tool Custom text message to get on mobile phone Enable/Disable mobile alert function available Do not fo
FREE
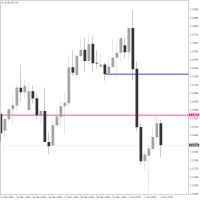
Crosshair Levels : Free version of Object Synchronizer. ** No synchronization of objects among grouped charts and no group chart features supported in this version. Are you bored to save and load template many times for the same symbol for many chart time frames? Here is the alternative. With this indicator, you enjoy creating 3 objects. All objects that you created/modified always are moved easily with clicking the object, moving cursor to the point you wanted and clicking again). Supported
FREE

Predetermination is an exit manager for trades you open yourself. It does not open positions and it does not send signals. After a manual buy or sell, it gives that trade a stop and up to six exit stages based on volatility. Three stages come from Average True Range, each with its own timeframe. Three come from completed range: daily (ADR), weekly (AWR), and monthly (AMR). Each stage can be switched on or off. Enabled stages are sorted by distance. Nearer stages trail the stop. The
FREE

Same behavior of https://www.mql5.com/en/market/product/25552 but fixed lot 0.01 The EA waits for a spike according to a specific logic and opens a position in spike direction setting stop loss and take profit. When positions are in profit they are managed with smart trailing mechanism based also on elapsed time from opened position. It works with 5-digit and 4-digit broker. Must be used on the M1 chart. Does not need historical data. It does not use Martingale Grid Hedge
Parameters spikeFilte
FREE
This EA places pending orders at the set time everyday. It is recommended for markets that trend after a breakout. Please see the youtube video to get an understanding of how the EA works. The youtube video also shows how to change the settings and optimise to get better results. It is not recommend to use this EA for ranging markets as this drastically reduces the win rate. If you encounter any issues with backtesting or EA settings you can message me on telegram for a quick response https://t.
FREE

Advanced Trade Information Dashboard – MT4
Everything I need to know about my account and open positions, right on the chart.
I got tired of clicking between the terminal, the trade tab, and the calculator just to check my margin, pip value, or total profit in pips. So I built this dashboard to put it all in one place.
What It Shows Total P&L – Real profit/loss from the positions I care about (filter by symbol, magic number, or include swap/commission).
Margin Level – The one number that k
FREE
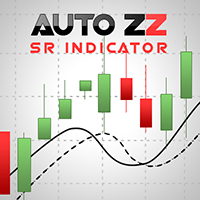
Auto ZZ SR Indicator
This indicator automatically draws trend lines using ZigZag top and bottom points. The more ZigZag tops/bottoms that are used, the greater the number of possible combinations. Therefore, the more possible trend lines can be drawn. And vice versa too. The fewer ZigZag tops/bottoms that are used, the lower the number of possible combinations. And therefore, the fewer the possible trend lines can be drawn. The indicator constantly updates the trend lines on the chart as the mar
FREE

The indicator plots a two-colored Moving Average (MA): Blue color — the previous bar’s open and close prices are above the MA line. Red color — the previous bar’s open and close prices are below the MA line. Customizable settings: MA type (Simple, Exponential, Smoothed, Linear); MA period; Alert when the MA color changes. bar cross Moving cross candle cross Moving cross bar cross MA cross candle cross MA cross bar cross Moving Average cross candle cross Mov
FREE

RangeMasterFX combines trend analysis and technical indicators based on multiple timeframes. Multi-Timeframe Analysis: Analyze trends on three timeframes: daily (D1), 4-hour (H4), and 1-hour (H1). RSI Filter: Uses the RSI (Relative Strength Index) to identify overbought and oversold market conditions and filter entries. Trailing Stop: Apply trailing stops when positions move in your favor to maximize profits. Dynamic Stop Loss and Take Profit: Dynamic stop loss and take profit depending on marke
FREE

一个简明的趋势与震荡的标示指标。 版本升级:增加预警及通知,增加买卖方向建议,优化界面显示。 更多编程服务可加微信 luolin9687
使用红黄绿三色来标示。 红色表示空头趋势(下跌)。 绿色表示多头趋势(上涨)。 黄色表示震荡区域。 从黄色转变为红色时,行情可能从震荡转变为下跌趋势。一段连续的红色,说明下跌趋势很强。 从黄色转变为绿色时,行情可能从震荡转变为上升趋势。一段连续的绿色,说明上升趋势很强。 指标的上半部分区域和下半部分区域若同步为红色,表明下跌趋势已经形成共振,接下来大概率走出一段空头趋势。 若上下 同时为绿色,表明上涨趋势已经形成共振,接下来大概率走出一段多头趋势。 若上下同时为黄色,表明当前行情为震荡。
参数可调。 //+-------------------------------------------------------------------------------------------+ 特别提示 市场行情是不确定的,任何指标都是根据行情价格的演变而来,不保证使用此指标的盈利性。
FREE

The relative strength index ( RSI ) is a technical indicator used in the analysis of financial markets . It is intended to chart the current and historical strength or weakness of a stock or market based on the closing prices of a recent trading period. The indicator should not be confused with relative strength . The RSI is classified as a momentum oscillator , measuring the velocity and magnitude of price movements. Momentum is the rate of the rise or fall in price. The RSI c
FREE

概述:
彩色抛物线 SAR 指标 是一种视觉增强的交易工具,旨在简化趋势跟随和交易识别。这个可定制的指标通过图表上颜色编码的信号为多头(买入)和空头(卖出)趋势提供清晰的视觉提示,直接在您的 MT4 图表上显示。 主要特点: 颜色编码信号: 买入信号使用亮绿色 "o" 符号显示。 卖出信号使用红色 "o" 符号显示。 可自定义输入: 可调整的步长(Step)和最大值(Maximum)参数,用于精细调整抛物线 SAR 的计算。 可自定义线条宽度和颜色,以适应您的交易风格和图表外观。 简单且有效的可视化: 通过清晰的符号轻松识别多头和空头趋势,这些符号显示在价格蜡烛上方或下方。 让您一目了然快速评估市场状况。 兼容性: 支持所有 MT4 可用的交易品种和时间框架。 适合谁使用? 寻找将抛物线 SAR 简单集成到交易策略中的交易者。 适用于趋势跟随策略,或作为其他指标的确认工具。 输入参数: 步长(Step): 定义抛物线 SAR 的灵敏度(默认值:0.02)。 最大值(Maximum): 设置指标的最大值(默认值:0.2)。 线宽(Line Width): 调整绘制信号的线条厚度。 上涨
FREE

SwingTradeMaster – a fully automated Expert Advisor based on classic Price Action and adaptive risk management.
The EA combines candlestick patterns (Pin Bar, Engulfing, Morning/Evening Star, Hammer) with RSI trend filters and ATR-based dynamic stop levels.
Transparent logic
Breakeven protection
Works on any pair and timeframe
Recommended for traders who want a professional, reliable and easy-to-use trading system. SwingTradeMaster is a fully automated Expert Advisor designed for swing and
FREE

The MA ribbon is not a single indicator but rather an overlay of multiple moving averages (typically four to eight or more) of varying lengths plotted on the same price chart. Visual Appearance: The resulting lines create a flowing, ribbon-like pattern across the price chart. Components: Traders can use different types of moving averages, such as Simple Moving Averages (SMA) or Exponential Moving Averages (EMA), and adjust the time periods (e.g., 10, 20, 30, 40, 50, and 60 periods) to suit t
FREE
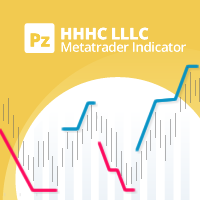
A personal implementation of a famous trend principle known as higher high, higher close, lower low, lower close (HHHC - HHHL). It uses price action alone to determine trend direction, trend changes and pullback zones. [ Installation Guide | Update Guide | Troubleshooting | FAQ | All Products ] Customizable breakout period Customizable colors and sizes It is non-repainting and non-backpainting It implements alerts of all kinds The indicator defines three price zones: Buy zones are blue Sell zo
FREE
How To Trade
Execute your trades in 3 Easy Steps!
Step 1: Trade Setup Entry Buy = If daily open market Above Line PIVOT or can Price has touched and closed the candle above Resistance1. Entry Sell = If daily open market Under Line PIVOT or can Price has touched and closed the candle above Support1. Step 2: Set Stop Loss Stop loss BUY ----> You can set stop loss on Line Pivot or Support1. Stop loss SELL ----> You can set stop loss on Line Pivot or Resistance1. Step 3: Set Take Profit Take profi
FREE
您知道为什么MetaTrader市场是出售交易策略和技术指标的最佳场所吗?不需要广告或软件保护,没有支付的麻烦。一切都在MetaTrader市场提供。
