EMA 34 vs EMA 89

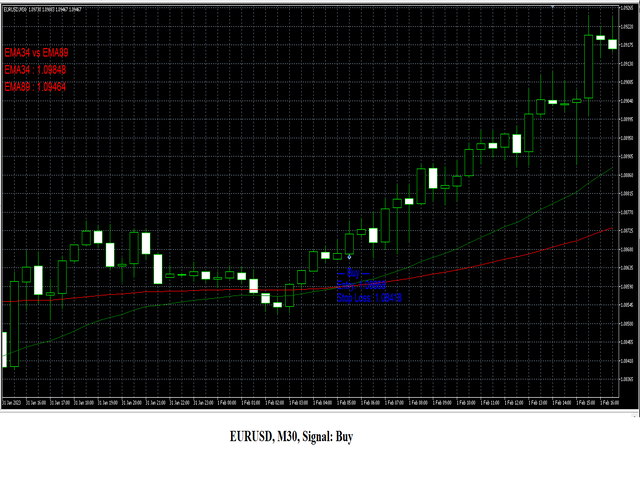
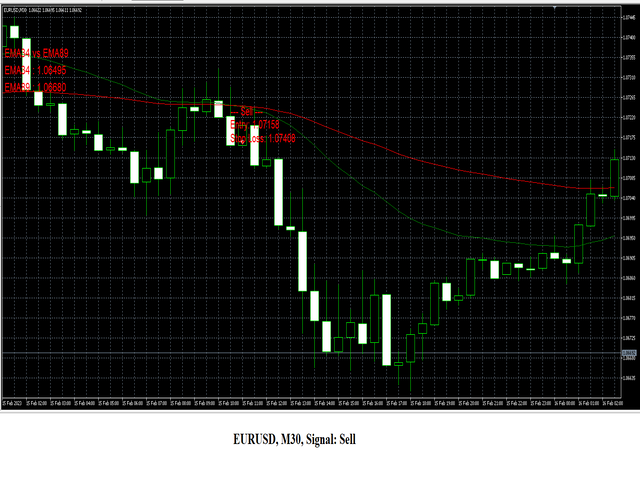
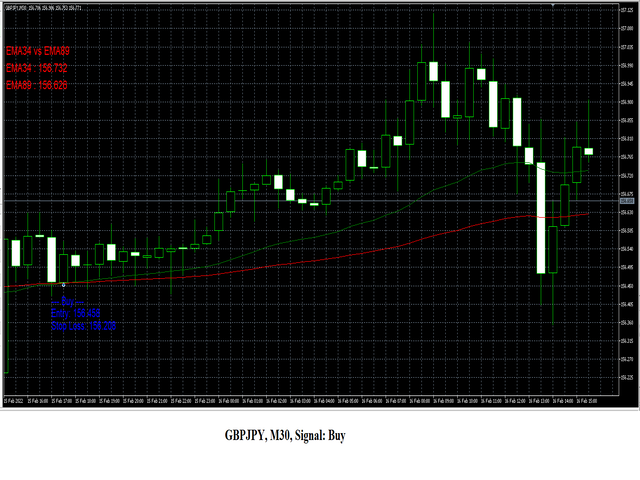
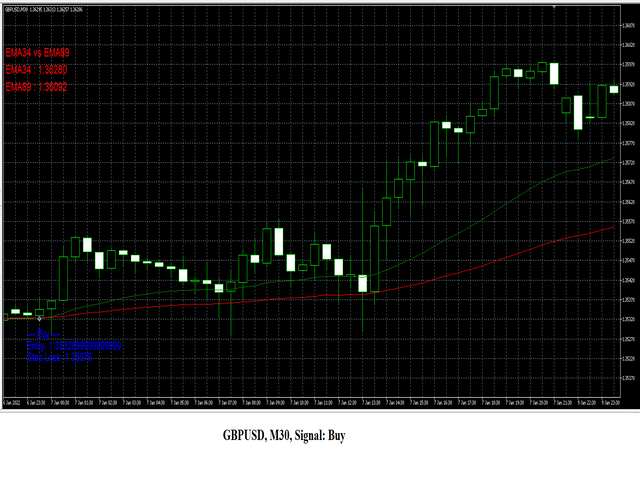
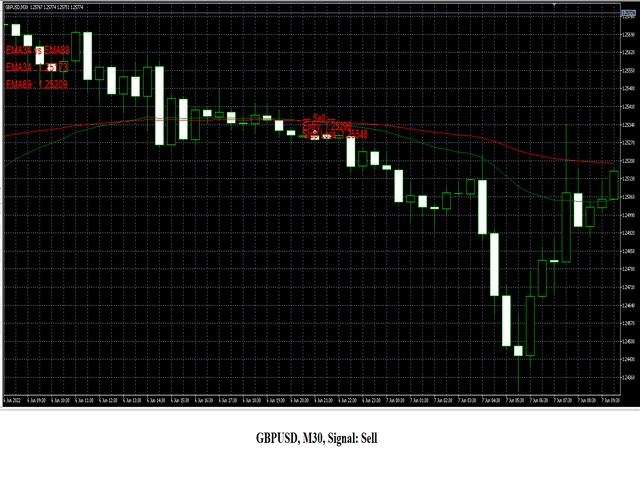
"EMA43 vs EMA89" Göstergesi, trend dönüşlerini ve potansiyel işlem fırsatlarını belirlemek isteyen tüccarlar için güçlü bir araçtır. Bu gösterge, EMA34 ve EMA89 hareketli ortalamalarını grafikte görüntüler. Bu hareketli ortalamalar kesiştiğinde, potansiyel bir trend yönü değişikliğini gösteren bir alım veya satım uyarısı oluşturulur.

Özellikler:

Kullanımı kolay: Göstergenin grafiğinize ekleyin ve EMA34 ve EMA89'un kesiştiğinde uyarılar almaya başlayın. Ayarlanabilir hareketli ortalama periyotları: EMA34 ve EMA89'un uzunluğunu ticaret stratejinize uyacak şekilde ayarlayın. Tüm zaman dilimlerinde çalışır: EMA Cross Alert Göstergesi'ni M1'den MN'ye kadar herhangi bir zaman diliminde kullanın. Nasıl kullanılır:

EMA Cross Alert Göstergesini grafiğinize ekleyin. EMA34 ve EMA89'un kesişmesini bekleyin. Bir alım veya satım uyarısı oluşturulduğunda, yeni trendin yönünde bir işleme girmeyi düşünün. Risk bildirimi: Finansal piyasalarda işlem yapmak risk içerir. Geçmiş performans, gelecekteki sonuçların göstergesi değildir. Her zaman kendi analizinizi yapın ve yatırım kararları almadan önce bir finansal profesyonelle danışın.

Not: Bu gösterge popüler EMA çaprazlama stratejisine dayanmaktadır ve garanti edilmiş bir kar yapma aracı değildir. En iyi sonuçlar için diğer teknik analiz araçları ve kendi ticaret stratejinizle birlikte kullanın."


Önerilen ürünler
Heiken Ashi Smoothed Strategy is a very simple but powerful system to get forex market trend direction. This indicator is actually 2 indicators in 1 pack, Heiken Ashi and Heiken Ashi Smoothed Moving Average both included. Because HA (Heiken Ashi) and HAS (Heiken Ashi Smoothed) are calculated in the same one system event with necessary buffers and loop only, so it is the FAST, OPTIMIZED and EFFICIENT HA having the combined indicator of MetaTrader 5. You can choose to display HA and HAS in the sam
RBreaker
Zhong Long Wu
RBreaker Gold Indicators is a short-term intraday trading strategy for gold futures that combines trend following and intraday reversal approaches. It not only captures profits during trending markets but also enables timely profit-taking and counter-trend trading during market reversals. This strategy has been ranked among the top ten most profitable trading strategies by the American magazine   Futures Truth   for 15 consecutive years. It boasts a long lifecycle and remains widely used and st
CosmiCLab SMC FIBO CosmiCLab SMC FIBO is a professional trading indicator designed for traders who use Smart Money Concepts (SMC), market structure analysis and Fibonacci retracement levels. The indicator automatically detects market swings and builds Fibonacci levels based on the latest impulse movement. It also identifies market structure changes such as BOS (Break of Structure) and CHOCH (Change of Character), helping traders understand the current market direction. CosmiCLab SMC FIBO also pr
HMA Trend Professional MT5
Pavel Zamoshnikov
4.25 (4)
Improved version of the free HMA Trend indicator (for MetaTrader 4) with statistical analysis. HMA Trend is a trend indicator based on the Hull Moving Average (HMA) with two periods. HMA with a slow period identifies the trend, while HMA with a fast period determines the short-term movements and signals in the trend direction. The main differences from the free version: Ability to predict the probability of a trend reversal using analysis of history data. Plotting statistical charts for analyzi
PipFinite Trend PRO MT5
Karlo Wilson Vendiola
4.84 (558)
Breakthrough Solution For Trend Trading And Filtering With All Important Features Built Inside One Tool! Trend PRO's smart algorithm detects the trend, filters out market noise and gives entry signals with exit levels. The new features with enhanced rules for statistical calculation improved the overall performance of this indicator. Important Information Revealed Maximize the potential of Trend Pro, please visit www.mql5.com/en/blogs/post/713938 The Powerful Expert Advisor Version Automatin
STRICTLY FOR BOOM INDEX ONLY!!!!! Here I bring the Maximum Trend Arrows OT1.0 MT5 indicator. This indicator is made up of a combination of different trend indicators for entries and exits, for entries an orange arrow will paint on the chart below the current market and a red flag for closing of trades and it produces buy arrows only. When the orange arrow appears, it will appear along with it's sound to notify you. The 1H timeframe is recommended, don't use it anywhere else than on the 1H timefr
MACD Pro Master
Itumeleng Mohlouwa Kgotso Tladi
MACD Pro Master The MACD Pro Master is your ultimate trading companion, designed to revolutionize your financial journey and unlock the doors to wealth. Here's why it's the next best thing since sliced bread: Advantages Precision Trading : The MACD Pro Master leverages the powerful Moving Average Convergence Divergence (MACD) indicator to provide accurate buy and sell trades,  ensuring you capitalize on every market opportunity. Customizable Settings : Tailor the trading strategy to your unique
Trend Monitor MT5
Pavel Zamoshnikov
4.5 (2)
The indicator generates early signals basing on ADX reading data combined with elements of price patterns. Works on all symbols and timeframes. The indicator does not redraw its signals. You see the same things on history and in real time. For better visual perception signals are displayed as arrows (in order not to overload the chart). Features The best results are obtained when the indicator works on two timeframes. For example: M30 – the indicator shows the main trend; M5 – the indicator gen
Öncelikle, bu Ticaret Aracının Non-Repainting, Non-Redrawing ve Non-Lagging Gösterge olduğunu vurgulamakta fayda var, bu da onu profesyonel ticaret için ideal hale getiriyor. Çevrimiçi kurs, kullanıcı kılavuzu ve demo. Akıllı Fiyat Hareketi Kavramları Göstergesi, hem yeni hem de deneyimli tüccarlar için çok güçlü bir araçtır. İleri ticaret fikirlerini, Inner Circle Trader Analizi ve Smart Money Concepts Ticaret Stratejileri gibi 20'den fazla kullanışlı göstergeyi bir araya getirerek bir araya
Syntetic Mean Reversion
Danny Giovanni Romero Lozano
Synthetic Mean Reversion The Synthetic Mean Reversion is a technical indicator designed to analyze price momentum and its distance from dynamic equilibrium. It operates in a separate sub-window, offering a normalized view of market extensions and potential exhaustion zones based on price volatility. The indicator measures the difference between the current price and its mean, transforming market data into a visual scale of 0 to 100. This calculation helps identify periods when the price has de
Rigonstructor
Mark Lapukha
5 (1)
Bu bir yapıcıdır. Yani stratejilerin yaratıcısı. Ve sadece değil. Bu, MetaTrader 5'teki standart yerleşik göstergelerin çoğu için bir sinyal göstergesidir. Göstergelerinizi bir sinyal okunda birleştirin. Örneğin bir stratejiniz var ve onun karlılığını bulmanız, menüye gerekli öğeleri dahil etmeniz ve istatistik almanız gerekiyor. Ve eğer bir stratejiniz yoksa, onu internetten alın veya kendinizinkini yaratın. Rigonstruktor tüm bunlarda size yardımcı olacaktır. Kit, Forex, ölçeklendirme ve ikili
Temel Özellikler EMA Trend Filtresi Gösterge, mevcut trend yönünü tespit etmek için özelleştirilebilir bir EMA (Üstel Hareketli Ortalama) kullanır. Fiyatın EMA'nın üzerine geçmesi → Al Sinyali Fiyatın EMA'nın altına geçmesi → Sat Sinyali Dinamik Destek ve Direnç Seviyeleri Dahili yüksek/düşük yapısı: Kırmızı Çizgi → Önceki N barın en yüksek zirvesi (Direnç) Yeşil Çizgi → Önceki N barın en düşük dip noktası (Destek) Bu seviyeler, zayıf sinyalleri filtrelemeye ve güçlü kırılımları belirleme
The TrendChangeZone indicator displays global and local price highs and lows on the chart.   The indicator also shows the global trend on the chart and corrective waves.   This indicator is designed to determine the direction and change the trend.   Most importantly, the indicator shows trend continuation or reversal zones.   An indispensable assistant in trading.   The indicator does not redraw.   The indicator can work on all trading instruments. Important !!! Top trend if 2 (two) or more bl
Terra Infinity is a flat indicator. This improved version of the CalcFlat indicator has three additional lines that significantly increase its effectiveness. Unlike its predecessor with two static levels, Terra Infinity adds three dynamic lines above the main histogram, which are interpreted as follows: base signal line, minimum signal line, maximum signal line. These lines are formed using the additional parameter Avg, which is the average value of the histogram. Averaging produces a line cl
An indicator of pattern #31 ("Long Island") from Encyclopedia of Chart Patterns by Thomas N. Bulkowski. The second gap is in the opposite direction. Parameters: Alerts - show alert when an arrow appears   Push - send a push notification when an arrow appears (requires configuration in the terminal) GapSize - minimum gap size in points ArrowType - a symbol from 1 to 17 ArrowVShift - vertical shift of arrows in points   ShowLevels - show levels ColUp - color of an upward line ColDn - color of a d
The   Trendlines Oscillator   helps traders identify trends and momentum based on the normalized distances between the current price and the most recently detected bullish and bearish trend lines. The indicator features bullish and bearish momentum, a signal line with crossings, and multiple smoothing options. USAGE The   Trendlines Oscillator   works by systematically: Identifying pivot highs and lows. Connecting pivots to form bullish (support) and bearish (resistance) trendlines. Measuring
Universal Soul Reaper
Pieter Gerhardus Van Zyl
Universal Soul Reaper is an atmospheric market-flow oscillator designed to interpret price behavior as a cycle of spiritual energy. Instead of reacting to raw price alone, it visualizes the state of the market’s soul —revealing when momentum is awakening, stabilizing, or fading. The indicator operates in a separate window and presents three interwoven entities: the Ectoplasmic Veil , the Spirit Boundary , and the Soul Core . Together, they form a living framework that helps traders sense pressu
Slopes are an increasingly key concept in Technical Analysis. The most basic type is to calculate them on the prices, but also on technical indicators such as moving averages and the RSI. In technical analysis, you generally use the RSI to detect imminent reversal moves within a range. In the case of the Blue indicator, we are calculating the slope of the market price and then calculating the RSI of that slope in order to detect instances of reversal. The Blue indicator is therefore used as
Cvd Divergence
Thalles Nascimento De Carvalho
CVD Divergence – Profesyonel Emir Akışı ve Diverjans Analizi CVD Divergence, fiyat ile Kümülatif Delta Hacmi (CVD) arasındaki güvenilir uyumsuzlukları tespit etmek için tasarlanmış teknik bir göstergedir. Gerçek emir akışının fiyat hareketini doğrulamadığı anları yüksek hassasiyetle belirleyerek olası dönüşleri, momentum zayıflamasını ve kurumsal manipülasyonları ortaya çıkarır. Gösterge, agresif hacim analizini fiyat yapısıyla birleştirerek net, objektif ve erken sinyaller sağlar. Göstergenin Ö
Supertrend   indicator uses a combination of a moving average and average true range to detect the trend of a trading instrument. Supertrend indicator for MetaTrader 5 easily shows the trend as a line following the price. You can use the second my indicator: You will see 3 supertrends and EMA 200 lines on the screen. Working with my product : https://www.mql5.com/en/market/product/80692
Gobbo MT5
Alessandro Grossi
Gobbo è un indicatore professionale che evidenzia il trend del mercato con un aspetto grafico chiaro e comprensibile, è basato sulla Moving Average e può essere impostato su qualsiasi periodo di intervallo, di default impostato sul periodo 14, scegliendo un periodo più alto evidenzierà meno cambi di tendenza per un approccio sul medio o lungo periodo, con un periodo più basso più cambi di tendenza per un approccio sul breve termine L'aggiornamento e l'adattamento al time frame scelto avviene in
TRI Visualizer
Yoshimi Mon 三 Ura
TRI Visualizer MT5 – Thermodynamic Market Analysis Overview The TRI (Thermal Range Indicator) Visualizer Enhanced is a rare market analysis indicator that goes beyond conventional technical analysis, applying principles of thermodynamics from physics. It interprets market price fluctuations as “thermodynamic energy,” enabling the highly accurate detection of subtle market changes that are often overlooked. Innovative Mechanisms 1. Dual Calculation Engines Classic TRI Mode Formula: |Close
Noize Absorption Index - is the manual trading system that measures the difference of pressure between bears forces and bulls forces. Green line - is a noize free index that showing curent situation. Zero value of index shows totally choppy/flat market.Values above zero level shows how powerfull bullish wave is and values below zero measures bearish forces.Up arrow appears on bearish market when it's ready to reverse, dn arrow appears on weak bullish market, as a result of reverse expectation.
The RSI Divergence + FVG Signal indicator combines Relative Strength Index (RSI) Divergence with Fair Value Gap (FVG) detection to generate high-probability buy and sell signals based on both momentum shifts and institutional imbalance zones. Core Features: RSI Divergence Detection : Identifies both regular and hidden bullish/bearish divergences between price and RSI. Divergences indicate potential trend reversals or continuation. FVG Zone Recognition : Detects Fair Value Gaps (imbalances caused
Swing Tracer
Ely Alsedy
5 (1)
it depends on ATR period to get swing points to help make better trading decisions  blue dot and red dot is the default color scheme of course you can change it later if you'd like  you can change the following : ATR PERIOD  sending notifications number of times to send notifications  sending notifications to your smart phone that's it very simple to use just drag and drop and follow the trend 
Professional MACD with 6 trading modes, divergence detection, adaptive periods,  and complete risk management system /SL,TP/ for all trader levels. Shows adaptive support and resistance! Shows the previous day: high , low and equilibrium price level! Providing trading suggestions! Choose your trading style and let the indicator configure itself automatically: - ** BEGINNER MODE** - Simple, safe signals with clear confirmations - ** INTERMEDIATE MODE** - Balanced approach for most traders 
The Trend Duration Forecast MT5 indicator is designed to estimate the probable lifespan of a bullish or bearish trend. Using a Hull Moving Average (HMA) to detect directional shifts, it tracks the duration of each historical trend and calculates an average to forecast how long the current trend is statistically likely to continue. This allows traders to visualize both real-time trend strength and potential exhaustion zones with exceptional clarity. KEY FEATURES Dynamic Trend Detection:   Utiliz
KasTon Trend System: The Complete 2-in-1 Trading Strategy Identify the Trend, Confirm the Signal, and Trade with Confidence! Do you suffer from confusion while trading? Do you find it difficult to determine the market's direction? Are you tired of losing money on false signals? The KasTon Trend System is here as an integrated solution to all these problems. This is not just an indicator; it is a complete trading strategy built on the synergy of two powerful, custom-built indicators. Our main g
HAshi-E is an enhanced way to analyze Heiken-Ashi signals. Briefing: Heiken-Ashi is particularly valued for its ability to filter out short-term volatility, making it a preferred tool for identifying and following trends, helps in decision-making regarding entry and exit points, and assists in distinguishing between false signals and genuine trend reversals. Unlike traditional candlestick charts, Heiken-Ashi candles are calculated using average values of previous bars, creating a smoother, mo
LT Rainbow Trend
Thiago Duarte
5 (1)
Do you, like me, like to trade with the trend? Then this indicator will help you! Rainbow Trend is a trend indicator, which uses several Moving Averages on the chart. It measures different trend strenght zones for different periods: very long term, long term, mid term, short term and very short term. Each zone has its color, and it is possible to have sound alert when the prices leaves a zone and enters another. Its configuration is very simple. If you find any bug or have any suggestions, conta
Bu ürünün alıcıları ayrıca şunları da satın alıyor
SuperScalp Pro
Van Minh Nguyen
5 (14)
SuperScalp Pro – Gelişmiş Çoklu Filtreli Scalping Gösterge Sistemi SuperScalp Pro, klasik Supertrend ile çok sayıda akıllı onay filtresini birleştiren gelişmiş bir scalping gösterge sistemidir. Gösterge M1’den H4’e kadar tüm zaman dilimlerinde verimli çalışır ve özellikle XAUUSD, BTCUSD ve ana Forex pariteleri için uygundur. Bağımsız bir sistem olarak kullanılabilir veya mevcut ticaret stratejilerine esnek şekilde entegre edilebilir. Gösterge, hız ve yavaş EMA’lar, trend belirleyen üç EMA, EMA e
Azimuth Pro
Ottaviano De Cicco
5 (6)
LAUNCH PROMO Azimuth Pro price is initially set at 299$ for the first 100 buyers. Final price will be 499$ . THE DIFFERENCE BETWEEN RETAIL AND INSTITUTIONAL ENTRIES ISN'T THE INDICATOR — IT'S THE LOCATION. Most traders enter at arbitrary price levels, chasing momentum or reacting to lagging signals. Institutions wait for price to reach structured levels where supply and demand actually shift. Azimuth Pro maps these levels automatically: swing-anchored VWAP, multi-timeframe structure lines, an
Divergence Bomber
Ihor Otkydach
4.89 (83)
Bu göstergeyi satın alan herkese aşağıdaki ekstra içerikler ücretsiz olarak sunulmaktadır: Her işlemi otomatik olarak yöneten, Stop Loss ve Take Profit seviyelerini ayarlayan ve işlemleri strateji kurallarına göre kapatan özel yardımcı araç: "Bomber Utility" Göstergenin farklı varlıklar üzerinde kullanılmasına yönelik ayar dosyaları (set dosyaları) Bomber Utility için 3 farklı modda kullanım sunan ayar dosyaları: "Minimum Risk", "Dengeli Risk" ve "Bekle-Gör Stratejisi" Bu ticaret stratejisini hı
Entry In The Zone and SMC Multi Timeframe is a real-time market analysis tool developed based on Smart Money Concepts (SMC). It is designed to analyze market structure, price direction, reversal points, and key zones across multiple timeframes in a systematic way. The system displays Points of Interest (POI) and real-time No Repaint signals, with instant alerts when price reaches key zones or when signals occur within those zones. It functions as both an Indicator and a Signal System (2-in-1), c
ARICoins
Temirlan Kdyrkhan
ARICoin is a powerful trading companion designed to generate high-probability entry signals with dynamic TP/SL/DP levels based on volatility. Built-in performance tracking shows win/loss stats, PP1/PP2 hits, and success rates all updated live. Key Features: Buy/Sell signals with adaptive volatility bands Real-time TP/SL/DP levels based on ATR Built-in MA Filter with optional ATR/StdDev volatility Performance stats panel (Success, Profit/Loss, PP1/PP2) Alerts via popup, sound, push, or email Cust
Bu indikatörü satın alırsanız, Profesyonel Trade Manager’ımı  + EA ÜCRETSİZ olarak alacaksınız. Öncelikle, bu Ticaret Sistemi'nin Non-Repainting, Non-Redrawing ve Non-Lagging Göstergesi olduğunu vurgulamak önemlidir, bu da hem manuel hem de robot ticareti için ideal hale getirir. Online kurs, kılavuz ve ön ayarları indir. "Smart Trend Trading System MT5", yeni ve deneyimli tüccarlar için özelleştirilmiş kapsamlı bir ticaret çözümüdür. 10'dan fazla premium göstergeyi birleştiriyor ve 7'den fazla
FX Trend MT5 NG
Daniel Stein
5 (4)
FX Trend NG: Yeni Nesil Çoklu Piyasa Trend Zekâsı Genel Bakış FX Trend NG , çoklu zaman dilimlerinde çalışan profesyonel bir trend analiz ve piyasa izleme aracıdır. Piyasanın yapısını saniyeler içinde anlamanızı sağlar. Birden fazla grafik arasında geçiş yapmak yerine, hangi enstrümanların trendde olduğunu, momentumun nerede zayıfladığını ve hangi zaman dilimlerinin uyumlu olduğunu anında görebilirsiniz. Lansman Teklifi – FX Trend NG sadece $30 (6 Ay) veya $80 Ömür Boyu Lisans ile edinin. Zate
Trend Screener Pro MT5
STE S.S.COMPANY
4.84 (102)
Trend Göstergesi, Trend Alım Satım ve Filtreleme için Çığır Açan Benzersiz Çözüm, Tüm Önemli Trend Özellikleriyle Tek Bir Araç İçinde Yerleştirildi! Forex, emtialar, kripto para birimleri, endeksler ve hisse senetleri gibi tüm sembollerde/araçlarda kullanılabilen %100 yeniden boyamayan çoklu zaman çerçevesi ve Çoklu para birimi göstergesidir. Trend Screener, grafikte noktalarla ok trend sinyalleri sağlayan etkili bir trend trend göstergesidir. Trend analizörü göstergesinde bulunan özellikler: 1.
AriX
Temirlan Kdyrkhan
1 (4)
AriX Indicator for MT5 A powerful trend-following and signal-evaluation tool AriX is a custom MT5 indicator that combines Moving Averages and ATR-based risk/reward logic to generate clear buy/sell signals. It visualizes dynamic SL/TP levels, evaluates past trade outcomes, and displays win/loss statistics in a clean on-chart panel. Key features include: Buy/Sell signals based on MA crossovers ATR-based SL/TP1/TP2/TP3 levels with visual lines and labels Signal outcome tracking with real-time stat
FX Power MT5 NG
Daniel Stein
5 (31)
FX Power: Daha Akıllı Ticaret Kararları için Para Birimlerinin Gücünü Analiz Edin Genel Bakış FX Power , her piyasa koşulunda başlıca para birimlerinin ve altının gerçek gücünü anlamak için vazgeçilmez bir araçtır. Güçlü para birimlerini alıp zayıf olanları satarak, FX Power ticaret kararlarınızı basitleştirir ve yüksek olasılıklı fırsatları ortaya çıkarır. İster trendlere sadık kalın ister Delta'nın aşırı değerlerini kullanarak tersine dönüşleri öngörün, bu araç ticaret tarzınıza mükemmel bir
RFI levels PRO MT5
Roman Podpora
3.67 (3)
Bu gösterge, fiyat dönüş noktalarını ve fiyat geri dönüş bölgelerini doğru bir şekilde gösterir.       Başlıca oyuncular   . Yeni trendlerin nerede oluştuğunu görüyorsunuz ve her işlem üzerinde kontrolü elinizde tutarak, azami hassasiyetle kararlar alıyorsunuz. TREND LINES PRO   göstergesiyle birlikte kullanıldığında maksimum potansiyelini ortaya koyar.  VERSION MT4 Göstergenin gösterdiği şey: Yeni bir trendin başlangıcında aktivasyonla birlikte tersine dönüş yapıları ve tersine dönüş seviyeler
Quantum TrendPulse
Bogdan Ion Puscasu
5 (22)
SuperTrend   ,   RSI   ve   Stochastic'in   gücünü tek bir kapsamlı göstergede birleştirerek işlem potansiyelinizi en üst düzeye çıkaran nihai işlem aracı olan   Quantum TrendPulse'u   tanıtıyoruz. Hassasiyet ve verimlilik arayan yatırımcılar için tasarlanan bu gösterge, piyasa trendlerini, momentum değişimlerini ve en uygun giriş ve çıkış noktalarını güvenle belirlemenize yardımcı olur. Temel Özellikler: SuperTrend Entegrasyonu:   Güncel piyasa trendlerini kolayca takip edin ve karlılık dalgası
Atomic Analyst MT5
Issam Kassas
3.94 (31)
Öncelikle belirtmek gerekir ki bu Ticaret Göstergesi Yeniden Çizim Yapmaz, Gecikmez ve Gecikme Göstermez, bu da hem manuel hem de robot ticareti için ideal hale getirir. Kullanıcı kılavuzu: ayarlar, girişler ve strateji. Atom Analisti, Piyasada Daha İyi Bir Avantaj Bulmak İçin Fiyatın Gücünü ve Momentumunu Kullanan PA Fiyat Hareketi Göstergesidir. Gürültüleri ve Yanlış Sinyalleri Kaldırmaya ve Ticaret Potansiyelini Artırmaya Yardımcı Olan Gelişmiş Filtrelerle Donatılmıştır. Birden fazla katmanl
Grabber System MT5
Ihor Otkydach
4.83 (23)
Size mükemmel bir teknik gösterge olan Grabber’ı tanıtıyorum. Bu araç, kullanıma hazır bir “her şey dahil” işlem stratejisi olarak çalışır. Tek bir yazılım kodu içinde güçlü piyasa teknik analiz araçları, işlem sinyalleri (oklar), uyarı işlevleri ve push bildirimleri entegre edilmiştir. Bu göstergeyi satın alan herkes aşağıdaki hediyeleri ücretsiz olarak alır: Açık emirleri otomatik yönetmek için Grabber Yardımcı Aracı Kurulum, yapılandırma ve nasıl işlem yapılacağını adım adım anlatan video kıl
Trend indicator AI mt5
Ramil Minniakhmetov
5 (16)
Trend Ai göstergesi, trend tanımlamasını işlem yapılabilir giriş noktaları ve geri dönüş uyarılarıyla birleştirerek bir yatırımcının piyasa analizini geliştirecek harika bir araçtır. Bu gösterge, kullanıcıların forex piyasasının karmaşıklıklarında güvenle ve hassasiyetle yol almalarını sağlar. Birincil sinyallerin ötesinde, Trend Ai göstergesi geri çekilmeler veya düzeltmeler sırasında ortaya çıkan ikincil giriş noktalarını belirleyerek, yatırımcıların belirlenen trend içindeki fiyat düzeltmele
TREND ÇİZGİLERİ PRO       Piyasanın gerçek yön değiştirdiği noktayı anlamaya yardımcı olur. Gösterge, gerçek trend dönüşlerini ve büyük oyuncuların piyasaya yeniden girdiği noktaları gösterir. Anlıyorsun   BOS hatları   Daha yüksek zaman dilimlerindeki trend değişiklikleri ve önemli seviyeler, karmaşık ayarlar veya gereksiz gürültü olmadan gösterilir. Sinyaller yeniden çizilmez ve çubuk kapandıktan sonra grafikte kalır. MT4 SÜRÜMÜ   -   RFI LEVELS PRO   göstergesiyle   birlikte kullanıldığında m
Meridian Pro
Ottaviano De Cicco
Meridian Pro: Professional Multi-Timeframe Trend Matrix for MT5 Overview Meridian Pro is a multi-timeframe trend matrix by Merkava Labs that compresses directional state, strength, momentum condition and matrix agreement into one compact panel. One adaptive engine, applied consistently from M1 to W1. No per-symbol tuning. No indicator stacking. One structured readout across every asset and every timeframe. Launch Offer — Get Meridian Pro for USD 99 (introductory). Regular price: USD 149. 1. Why
ARIPoint
Temirlan Kdyrkhan
ARIPoint is a powerful trading companion designed to generate high-probability entry signals with dynamic TP/SL/DP levels based on volatility. Built-in performance tracking shows win/loss stats, PP1/PP2 hits, and success rates all updated live. Key Features: Buy/Sell signals with adaptive volatility bands Real-time TP/SL/DP levels based on ATR Built-in MA Filter with optional ATR/StdDev volatility Performance stats panel (Success, Profit/Loss, PP1/PP2) Alerts via popup, sound, push, or email Cu
Btmm state engine pro
Garry James Goodchild
5 (2)
Get the user guide here  https://g-labs.software/guides/BTMM_State_Engine_Welcome_Pack.html BTMM State Engine Pro — the   all-in-one Banks   & Institutions Market Maker indicator for Meta Trader 5. Built for   BTMM traders who follow the Asian   session breakout methodology with Kill Zone timing , level stacking, peak formation detection , and multi-pair scanning — all   from a single chart. Combines   a full BTMM State Engine   with a built-in multi-pair Scanner dashboard, eliminating the need
OmniSync Projection
Antonio-alin Teculescu
5 (1)
Chronos Fractal Engine is an innovative price projection indicator for MetaTrader 5, designed to transform your technical analysis by intelligently identifying and projecting historical price patterns. Built upon an advanced correlation algorithm and the fractal principles of the market, this powerful tool visualizes potential future price movements, giving you a unique edge in your trading decisions. What is Chronos Fractal Engine? At its core, the Chronos Fractal Engine employs a sophisticat
Candle Smart Range
Gianny Alexander Lugo Sanchez
5 (1)
MetaTrader 5 için Candle Smart Range (CSR) Candle Smart Range, birden fazla zaman diliminde fiyat aralıklarının otomatik olarak tanımlanması için tasarlanmış teknik bir göstergedir. Bu araç, piyasa yapısını mum formasyonlarına ve fiyatın önceki en yüksek/en düşük seviyelerle olan etkileşimine dayanarak analiz eder. Ana Özellikler: Aralık Tespiti: İmpulsif hareketlerden önceki konsolidasyon bölgelerini tanımlar. Sahte Kırılma Tanımlama: Fiyatın önceki seviyeyi aştığı ancak mum kapanış kriterlerin
Trend Forecaster
Alexey Minkov
5 (7)
The Trend Forecaster indicator utilizes a unique proprietary algorithm to determine entry points for a breakout trading strategy. The indicator identifies price clusters, analyzes price movement near levels, and provides a signal when the price breaks through a level. The Trend Forecaster indicator is suitable for all financial assets, including currencies (Forex), metals, stocks, indices, and cryptocurrencies. You can also adjust the indicator to work on any time frames, although it is recommen
Matrix Arrow Indicator MT5
Juvenille Emperor Limited
5 (18)
Matrix Arrow Indicator MT5 ,   forex ,   emtialar ,   kripto   para birimleri ,   endeksler ,   hisse senetleri   gibi tüm sembollerde/araçlarda kullanılabilen   %100 yeniden boyamayan   çoklu zaman çerçevesi göstergesini izleyen benzersiz bir 10'u 1 arada trenddir.  Matrix Arrow Indicator MT5 , mevcut eğilimi erken aşamalarında belirleyecek ve aşağıdakiler gibi 10'a kadar standart göstergeden bilgi ve veri toplayacaktır: Ortalama Yönlü Hareket Endeksi (ADX) Emtia Kanal Endeksi (CCI) Klasik Hei
Bu gösterge, pratik ticaret için mükemmel olan otomatik dalga analizine yönelik bir göstergedir! Dava... Not:   Dalga sınıflandırması için Batılı isimleri kullanmaya alışkın değilim. Tang Lun'un (Tang Zhong Shuo Zen) adlandırma kuralının etkisiyle, temel dalgayı   kalem   , ikincil dalga bandını ise   segment   olarak adlandırdım. aynı zamanda segmentin trend yönü vardır. Adlandırma   esas olarak trend segmentidir   (bu adlandırma yöntemi gelecekteki notlarda kullanılacaktır, öncelikle söyleyey
Crystal Heikin Ashi Signals
Muhammad Jawad Shabir
5 (1)
Crystal Heikin Ashi Signals - Professional Trend & Signal Detection Indicator Advanced Heikin Ashi Visualization with Intelligent Signal System for Manual & Automated Trading Final Price: $149 ---------> Price goes up $10 after every 10 sales . Limited slots available — act fast . Overview Crystal Heikin Ashi Signals is a professional-grade MetaTrader 5 indicator that combines pure Heikin Ashi candle visualization with an advanced momentum-shift detection system. Designed for both manual traders
Introduction to X3 Chart Pattern Scanner X3 Cherart Pattern Scanner is the non-repainting and non-lagging indicator detecting X3 chart patterns including Harmonic pattern, Elliott Wave pattern, X3 patterns, and Japanese Candlestick patterns. Historical patterns match with signal patterns. Hence, you can readily develop the solid trading strategy in your chart. More importantly, this superb pattern scanner can detect the optimal pattern of its kind. In addition, you can switch on and off individu
Tanıtım       Quantum Breakout PRO   , Breakout Bölgeleri ile ticaret yapma şeklinizi değiştiren çığır açan MQL5 Göstergesi! 13 yılı aşkın ticaret tecrübesine sahip deneyimli tüccarlardan oluşan bir ekip tarafından geliştirilmiştir.       Kuantum Breakout PRO       yenilikçi ve dinamik koparma bölgesi stratejisiyle ticaret yolculuğunuzu yeni zirvelere taşımak için tasarlanmıştır. Kuantum Breakout Göstergesi, size 5 kar hedefi bölgesi ile kırılma bölgelerinde sinyal okları ve kırılma kutusuna da
Unlock hidden profits: accurate divergence trading for all markets Tricky to find and scarce in frequency, divergences are one of the most reliable trading scenarios. This indicator finds and scans for regular and hidden divergences automatically using your favourite oscillator. [ Installation Guide | Update Guide | Troubleshooting | FAQ | All Products ] Easy to trade Finds regular and hidden divergences Supports many well known oscillators Implements trading signals based on breakouts Displays
ACB Breakout Arrows MT5
KEENBASE SOFTWARE SOLUTIONS
5 (1)
ACB Breakout Arrows göstergesi, özel bir kırılma modelini tespit ederek piyasada önemli bir giriş sinyali sağlar. Göstergenin algoritması, fiyatın belirli bir yönde ivme kazandığı anları sürekli olarak tarar ve ana hareketten hemen önce doğru giriş sinyali verir. Çok sembollü ve çok zaman dilimli tarayıcıyı buradan alın - ACB Breakout Arrows MT5 için Tarayıcı Temel Özellikler Gösterge, Stop Loss ve Take Profit seviyelerini otomatik olarak belirler. Tüm zaman dilimlerinde kırılma sinyallerini i
Shock Pullback
Suleiman Alhawamdah
5 (1)
Basitçe söylemek gerekirse, mevcut mum çubuğunun yanında “pip” olarak bilinen beyaz sayıların hareketi görünmeye başladığında işlem yapmaya başlayabilirsiniz. Beyaz “pip”ler, bir alım veya satım işleminin şu anda aktif olduğunu ve beyaz renkleriyle belirtildiği gibi doğru yönde ilerlediğini gösterir. Beyaz pip hareketi durduğunda ve sabit yeşil renge dönüştüğünde, bu mevcut ivmenin sona erdiğini gösterir. Sayıların yeşil rengi, alım veya satım işlemiyle elde edilen toplam kârı “pip” cinsinden t
Filtrele:
Değerlendirme yok
Değerlendirmeye yanıt