EMA 34 vs EMA 89

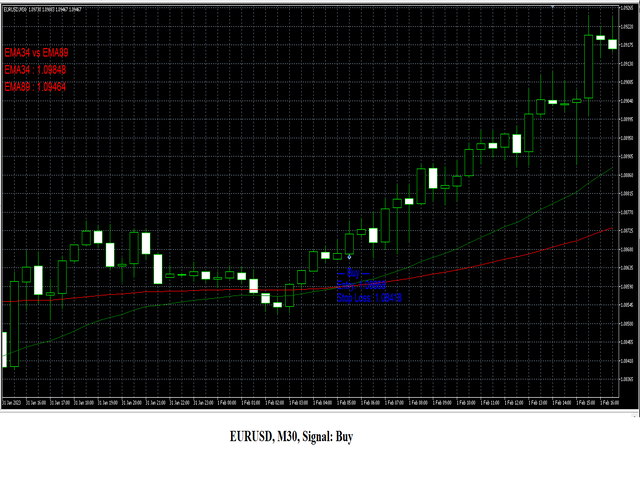
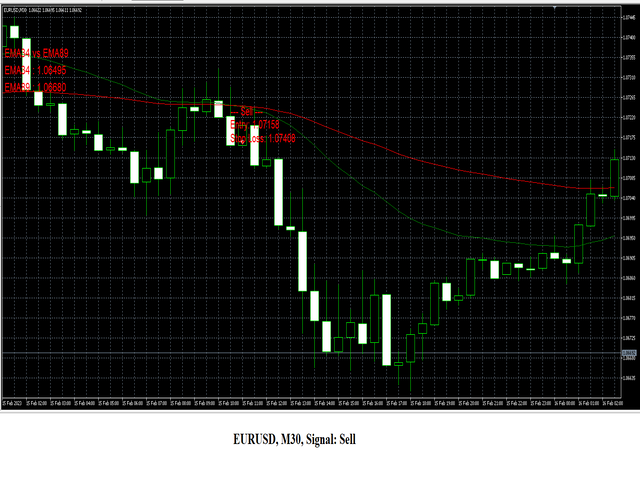
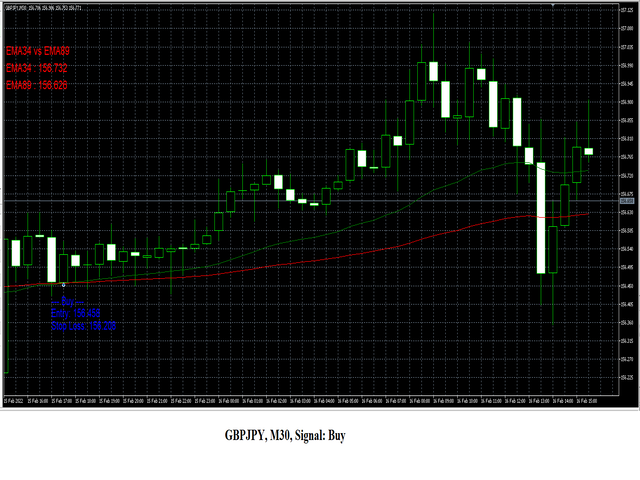
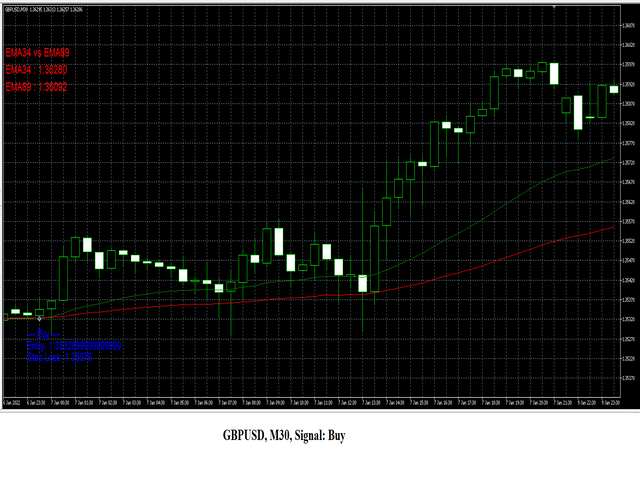
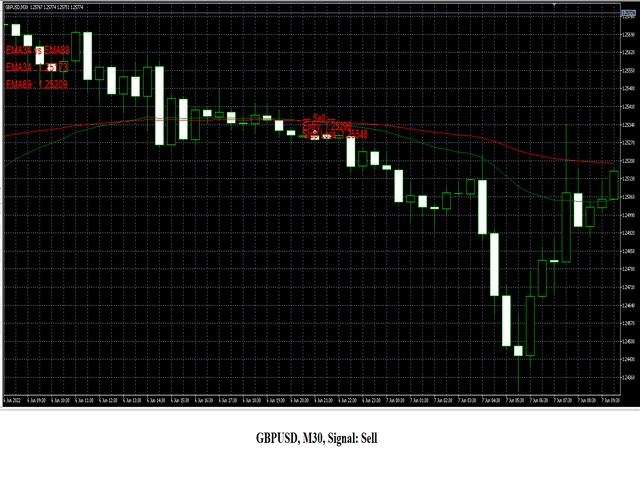
L'indicateur "EMA43 vs EMA89" est un outil puissant pour les traders cherchant à identifier les renversements de tendance et les opportunités de trading potentielles. Cet indicateur affiche deux moyennes mobiles, l'EMA34 et l'EMA89, sur le graphique. Lorsque ces moyennes mobiles se croisent, une alerte d'achat ou de vente est générée, indiquant un potentiel changement de direction de tendance.

Caractéristiques :

Facile à utiliser : Attachez simplement l'indicateur à votre graphique et commencez à recevoir des alertes lorsque l'EMA34 et l'EMA89 se croisent. Périodes de moyennes mobiles réglables : Ajustez la longueur de l'EMA34 et de l'EMA89 en fonction de votre stratégie de trading. Fonctionne sur toutes les plages de temps : Utilisez l'indicateur d'alerte de croisement EMA sur n'importe quelle plage de temps, de M1 à MN. Comment utiliser :

Attachez l'indicateur d'alerte de croisement EMA à votre graphique. Attendez que l'EMA34 et l'EMA89 se croisent. Lorsqu'une alerte d'achat ou de vente est générée, envisagez d'entrer dans un trade dans la direction de la nouvelle tendance. Clause de non-responsabilité : Le trading sur les marchés financiers comporte des risques. Les performances passées ne garantissent pas les résultats futurs. Effectuez toujours votre propre analyse et consultez un professionnel de la finance avant de prendre toute décision d'investissement.

Note : Cet indicateur est basé sur la stratégie populaire de croisement des moyennes mobiles exponentielles (EMA) et n'est pas un outil garanti pour générer des profits. Utilisez-le en conjonction avec d'autres outils d'analyse technique et votre propre stratégie de trading pour obtenir les meilleurs résultats.


Produits recommandés
Heiken Ashi Smoothed Strategy is a very simple but powerful system to get forex market trend direction. This indicator is actually 2 indicators in 1 pack, Heiken Ashi and Heiken Ashi Smoothed Moving Average both included. Because HA (Heiken Ashi) and HAS (Heiken Ashi Smoothed) are calculated in the same one system event with necessary buffers and loop only, so it is the FAST, OPTIMIZED and EFFICIENT HA having the combined indicator of MetaTrader 5. You can choose to display HA and HAS in the sam
RBreaker
Zhong Long Wu
RBreaker Gold Indicators est une stratégie de trading intraday à court terme pour les contrats à terme sur l'or, qui combine deux approches : le suivi de tendance et le retournement intraday. Elle permet non seulement de capturer les profits dans les marchés en tendance, mais aussi de prendre des bénéfices en temps opportun lors des retournements de marché et d'ouvrir une position en sens inverse. Cette stratégie a été classée pendant 15 années consécutives parmi les dix stratégies de trading l
CosmiCLab SMC FIBO CosmiCLab SMC FIBO is a professional trading indicator designed for traders who use Smart Money Concepts (SMC), market structure analysis and Fibonacci retracement levels. The indicator automatically detects market swings and builds Fibonacci levels based on the latest impulse movement. It also identifies market structure changes such as BOS (Break of Structure) and CHOCH (Change of Character), helping traders understand the current market direction. CosmiCLab SMC FIBO also pr
HMA Trend Professional MT5
Pavel Zamoshnikov
4.25 (4)
Improved version of the free HMA Trend indicator (for MetaTrader 4) with statistical analysis. HMA Trend is a trend indicator based on the Hull Moving Average (HMA) with two periods. HMA with a slow period identifies the trend, while HMA with a fast period determines the short-term movements and signals in the trend direction. The main differences from the free version: Ability to predict the probability of a trend reversal using analysis of history data. Plotting statistical charts for analyzi
PipFinite Trend PRO MT5
Karlo Wilson Vendiola
4.84 (558)
Breakthrough Solution For Trend Trading And Filtering With All Important Features Built Inside One Tool! Trend PRO's smart algorithm detects the trend, filters out market noise and gives entry signals with exit levels. The new features with enhanced rules for statistical calculation improved the overall performance of this indicator. Important Information Revealed Maximize the potential of Trend Pro, please visit www.mql5.com/en/blogs/post/713938 The Powerful Expert Advisor Version Automatin
STRICTLY FOR BOOM INDEX ONLY!!!!! Here I bring the Maximum Trend Arrows OT1.0 MT5 indicator. This indicator is made up of a combination of different trend indicators for entries and exits, for entries an orange arrow will paint on the chart below the current market and a red flag for closing of trades and it produces buy arrows only. When the orange arrow appears, it will appear along with it's sound to notify you. The 1H timeframe is recommended, don't use it anywhere else than on the 1H timefr
MACD Pro Master
Itumeleng Mohlouwa Kgotso Tladi
MACD Pro Master The MACD Pro Master is your ultimate trading companion, designed to revolutionize your financial journey and unlock the doors to wealth. Here's why it's the next best thing since sliced bread: Advantages Precision Trading : The MACD Pro Master leverages the powerful Moving Average Convergence Divergence (MACD) indicator to provide accurate buy and sell trades,  ensuring you capitalize on every market opportunity. Customizable Settings : Tailor the trading strategy to your unique
Trend Monitor MT5
Pavel Zamoshnikov
4.5 (2)
The indicator generates early signals basing on ADX reading data combined with elements of price patterns. Works on all symbols and timeframes. The indicator does not redraw its signals. You see the same things on history and in real time. For better visual perception signals are displayed as arrows (in order not to overload the chart). Features The best results are obtained when the indicator works on two timeframes. For example: M30 – the indicator shows the main trend; M5 – the indicator gen
Tout d'abord, il convient de souligner que cet outil de trading est un indicateur non repeint, non redessiné et non retardé, ce qui le rend idéal pour le trading professionnel. Cours en ligne, manuel utilisateur et démonstration. L'indicateur Smart Price Action Concepts est un outil très puissant à la fois pour les nouveaux et les traders expérimentés. Il regroupe plus de 20 indicateurs utiles en un seul, combinant des idées de trading avancées telles que l'analyse du trader Inner Circle et le
Syntetic Mean Reversion
Danny Giovanni Romero Lozano
Synthetic Mean Reversion The Synthetic Mean Reversion is a technical indicator designed to analyze price momentum and its distance from dynamic equilibrium. It operates in a separate sub-window, offering a normalized view of market extensions and potential exhaustion zones based on price volatility. The indicator measures the difference between the current price and its mean, transforming market data into a visual scale of 0 to 100. This calculation helps identify periods when the price has de
Rigonstructor
Mark Lapukha
5 (1)
C'est un constructeur. C'est-à-dire le créateur de stratégies. Et pas seulement. Il s'agit d'un indicateur de signal pour la plupart des indicateurs standard intégrés dans MetaTrader 5. Combinez vos indicateurs dans une flèche de signal. Par exemple, vous avez une stratégie et vous devez connaître sa rentabilité, inclure les éléments nécessaires dans le menu et obtenir des statistiques. Et si vous n’avez pas de stratégie, utilisez-la sur Internet ou créez la vôtre. Rigonstruktor vous aidera avec
The TrendChangeZone indicator displays global and local price highs and lows on the chart.   The indicator also shows the global trend on the chart and corrective waves.   This indicator is designed to determine the direction and change the trend.   Most importantly, the indicator shows trend continuation or reversal zones.   An indispensable assistant in trading.   The indicator does not redraw.   The indicator can work on all trading instruments. Important !!! Top trend if 2 (two) or more bl
Terra Infinity is a flat indicator. This improved version of the CalcFlat indicator has three additional lines that significantly increase its effectiveness. Unlike its predecessor with two static levels, Terra Infinity adds three dynamic lines above the main histogram, which are interpreted as follows: base signal line, minimum signal line, maximum signal line. These lines are formed using the additional parameter Avg, which is the average value of the histogram. Averaging produces a line cl
An indicator of pattern #31 ("Long Island") from Encyclopedia of Chart Patterns by Thomas N. Bulkowski. The second gap is in the opposite direction. Parameters: Alerts - show alert when an arrow appears   Push - send a push notification when an arrow appears (requires configuration in the terminal) GapSize - minimum gap size in points ArrowType - a symbol from 1 to 17 ArrowVShift - vertical shift of arrows in points   ShowLevels - show levels ColUp - color of an upward line ColDn - color of a d
The   Trendlines Oscillator   helps traders identify trends and momentum based on the normalized distances between the current price and the most recently detected bullish and bearish trend lines. The indicator features bullish and bearish momentum, a signal line with crossings, and multiple smoothing options. USAGE The   Trendlines Oscillator   works by systematically: Identifying pivot highs and lows. Connecting pivots to form bullish (support) and bearish (resistance) trendlines. Measuring
Universal Soul Reaper
Pieter Gerhardus Van Zyl
Universal Soul Reaper is an atmospheric market-flow oscillator designed to interpret price behavior as a cycle of spiritual energy. Instead of reacting to raw price alone, it visualizes the state of the market’s soul —revealing when momentum is awakening, stabilizing, or fading. The indicator operates in a separate window and presents three interwoven entities: the Ectoplasmic Veil , the Spirit Boundary , and the Soul Core . Together, they form a living framework that helps traders sense pressu
Slopes are an increasingly key concept in Technical Analysis. The most basic type is to calculate them on the prices, but also on technical indicators such as moving averages and the RSI. In technical analysis, you generally use the RSI to detect imminent reversal moves within a range. In the case of the Blue indicator, we are calculating the slope of the market price and then calculating the RSI of that slope in order to detect instances of reversal. The Blue indicator is therefore used as
Cvd Divergence
Thalles Nascimento De Carvalho
CVD Divergence – Analyse Professionnelle du Flux d’Ordres et des Divergences CVD Divergence est un indicateur technique conçu pour détecter des divergences fiables entre le prix et le Cumulative Delta Volume (CVD). Il identifie avec précision les moments où le flux réel d’ordres ne confirme pas le mouvement du prix, révélant ainsi de possibles retournements, des phases d’essoufflement et des manipulations institutionnelles. L’indicateur combine l’analyse du volume agressif avec l’étude structure
Supertrend   indicator uses a combination of a moving average and average true range to detect the trend of a trading instrument. Supertrend indicator for MetaTrader 5 easily shows the trend as a line following the price. You can use the second my indicator: You will see 3 supertrends and EMA 200 lines on the screen. Working with my product : https://www.mql5.com/en/market/product/80692
Gobbo MT5
Alessandro Grossi
Gobbo è un indicatore professionale che evidenzia il trend del mercato con un aspetto grafico chiaro e comprensibile, è basato sulla Moving Average e può essere impostato su qualsiasi periodo di intervallo, di default impostato sul periodo 14, scegliendo un periodo più alto evidenzierà meno cambi di tendenza per un approccio sul medio o lungo periodo, con un periodo più basso più cambi di tendenza per un approccio sul breve termine L'aggiornamento e l'adattamento al time frame scelto avviene in
TRI Visualizer
Yoshimi Mon 三 Ura
TRI Visualizer MT5 – Thermodynamic Market Analysis Overview The TRI (Thermal Range Indicator) Visualizer Enhanced is a rare market analysis indicator that goes beyond conventional technical analysis, applying principles of thermodynamics from physics. It interprets market price fluctuations as “thermodynamic energy,” enabling the highly accurate detection of subtle market changes that are often overlooked. Innovative Mechanisms 1. Dual Calculation Engines Classic TRI Mode Formula: |Close
Noize Absorption Index - is the manual trading system that measures the difference of pressure between bears forces and bulls forces. Green line - is a noize free index that showing curent situation. Zero value of index shows totally choppy/flat market.Values above zero level shows how powerfull bullish wave is and values below zero measures bearish forces.Up arrow appears on bearish market when it's ready to reverse, dn arrow appears on weak bullish market, as a result of reverse expectation.
The RSI Divergence + FVG Signal indicator combines Relative Strength Index (RSI) Divergence with Fair Value Gap (FVG) detection to generate high-probability buy and sell signals based on both momentum shifts and institutional imbalance zones. Core Features: RSI Divergence Detection : Identifies both regular and hidden bullish/bearish divergences between price and RSI. Divergences indicate potential trend reversals or continuation. FVG Zone Recognition : Detects Fair Value Gaps (imbalances caused
Swing Tracer
Ely Alsedy
5 (1)
it depends on ATR period to get swing points to help make better trading decisions  blue dot and red dot is the default color scheme of course you can change it later if you'd like  you can change the following : ATR PERIOD  sending notifications number of times to send notifications  sending notifications to your smart phone that's it very simple to use just drag and drop and follow the trend 
Professional MACD with 6 trading modes, divergence detection, adaptive periods,  and complete risk management system /SL,TP/ for all trader levels. Shows adaptive support and resistance! Shows the previous day: high , low and equilibrium price level! Providing trading suggestions! Choose your trading style and let the indicator configure itself automatically: - ** BEGINNER MODE** - Simple, safe signals with clear confirmations - ** INTERMEDIATE MODE** - Balanced approach for most traders 
The Trend Duration Forecast MT5 indicator is designed to estimate the probable lifespan of a bullish or bearish trend. Using a Hull Moving Average (HMA) to detect directional shifts, it tracks the duration of each historical trend and calculates an average to forecast how long the current trend is statistically likely to continue. This allows traders to visualize both real-time trend strength and potential exhaustion zones with exceptional clarity. KEY FEATURES Dynamic Trend Detection:   Utiliz
KasTon Trend System: The Complete 2-in-1 Trading Strategy Identify the Trend, Confirm the Signal, and Trade with Confidence! Do you suffer from confusion while trading? Do you find it difficult to determine the market's direction? Are you tired of losing money on false signals? The KasTon Trend System is here as an integrated solution to all these problems. This is not just an indicator; it is a complete trading strategy built on the synergy of two powerful, custom-built indicators. Our main g
HAshi-E is an enhanced way to analyze Heiken-Ashi signals. Briefing: Heiken-Ashi is particularly valued for its ability to filter out short-term volatility, making it a preferred tool for identifying and following trends, helps in decision-making regarding entry and exit points, and assists in distinguishing between false signals and genuine trend reversals. Unlike traditional candlestick charts, Heiken-Ashi candles are calculated using average values of previous bars, creating a smoother, mo
LT Rainbow Trend
Thiago Duarte
5 (1)
Do you, like me, like to trade with the trend? Then this indicator will help you! Rainbow Trend is a trend indicator, which uses several Moving Averages on the chart. It measures different trend strenght zones for different periods: very long term, long term, mid term, short term and very short term. Each zone has its color, and it is possible to have sound alert when the prices leaves a zone and enters another. Its configuration is very simple. If you find any bug or have any suggestions, conta
Price Magnet — Price Density and Attraction Levels Indicator Price Magnet is a professional analytical tool designed to identify key support and resistance levels based on statistical Price Density. The indicator analyzes a specified historical period and detects price levels where the market spent the most time. These zones act as “magnets,” attracting price action or forming a structural base for potential reversals. Unlike traditional Volume Profile tools, Price Magnet focuses on price-time d
Les acheteurs de ce produit ont également acheté
SuperScalp Pro
Van Minh Nguyen
4.72 (18)
SuperScalp Pro – Système d’indicateur de scalping avancé multi-filtres SuperScalp Pro est un système d’indicateur de scalping avancé qui combine le Supertrend classique avec plusieurs filtres de confirmation intelligents. L’indicateur fonctionne efficacement sur toutes les unités de temps de M1 à H4 et est particulièrement adapté à XAUUSD, BTCUSD et aux principales paires Forex. Il peut être utilisé comme système autonome ou intégré de manière flexible dans des stratégies de trading existantes.
Azimuth Pro
Ottaviano De Cicco
5 (6)
LAUNCH PROMO Azimuth Pro price is initially set at 299$ for the first 100 buyers. Final price will be 499$ . THE DIFFERENCE BETWEEN RETAIL AND INSTITUTIONAL ENTRIES ISN'T THE INDICATOR — IT'S THE LOCATION. Most traders enter at arbitrary price levels, chasing momentum or reacting to lagging signals. Institutions wait for price to reach structured levels where supply and demand actually shift. Azimuth Pro maps these levels automatically: swing-anchored VWAP, multi-timeframe structure lines, an
Entry In The Zone and SMC Multi Timeframe is a real-time 2-in-1 market analysis tool that combines market structure analysis and a No Repaint BUY / SELL signal system into a single indicator, built on Smart Money Concepts (SMC) — a widely adopted framework used by professional traders to understand market structure. This indicator helps you see the market more clearly, make decisions based on structure rather than guesswork, and focus on high-probability zones where price is more likely to react
Divergence Bomber
Ihor Otkydach
4.9 (86)
Chaque acheteur de cet indicateur reçoit également gratuitement : L’outil exclusif « Bomber Utility », qui accompagne automatiquement chaque opération de trading, fixe les niveaux de Stop Loss et de Take Profit, et clôture les positions selon les règles de la stratégie Des fichiers de configuration (set files) pour adapter l’indicateur à différents actifs Des set files pour configurer le Bomber Utility selon différents modes : « Risque Minimum », « Risque Équilibré » et « Stratégie d’Attente » U
Si vous achetez cet indicateur, vous recevrez mon Gestionnaire de Trading Professionnel + EA  GRATUITEMENT. Tout d'abord, il convient de souligner que ce système de trading est un indicateur non repeint, non redessiné et non retardé, ce qui le rend idéal pour le trading manuel et automatisé. Cours en ligne, manuel et téléchargement de préréglages. Le "Système de Trading Smart Trend MT5" est une solution de trading complète conçue pour les traders débutants et expérimentés. Il combine plus de 10
Meridian Pro
Ottaviano De Cicco
5 (1)
Meridian Pro: Professional Multi-Timeframe Trend Matrix for MT5 Overview Meridian Pro is a multi-timeframe trend matrix by Merkava Labs that compresses directional state, strength, momentum condition and matrix agreement into one compact panel. One adaptive engine, applied consistently from M1 to W1. No per-symbol tuning. No indicator stacking. One structured readout across every asset and every timeframe. Launch Offer — Get Meridian Pro for USD 99 (introductory). Regular price: USD 149. 1. Why
OmniSync Projection
Antonio-alin Teculescu
5 (1)
Chronos Fractal Engine is an innovative price projection indicator for MetaTrader 5, designed to transform your technical analysis by intelligently identifying and projecting historical price patterns. Built upon an advanced correlation algorithm and the fractal principles of the market, this powerful tool visualizes potential future price movements, giving you a unique edge in your trading decisions. What is Chronos Fractal Engine? At its core, the Chronos Fractal Engine employs a sophisticat
Trend Screener Pro MT5
STE S.S.COMPANY
4.85 (104)
Indicateur de tendance, solution unique révolutionnaire pour le trading et le filtrage des tendances avec toutes les fonctionnalités de tendance importantes intégrées dans un seul outil ! Il s'agit d'un indicateur multi-période et multi-devises 100 % non repeint qui peut être utilisé sur tous les symboles/instruments : forex, matières premières, crypto-monnaies, indices et actions. Trend Screener est un indicateur de suivi de tendance efficace qui fournit des signaux de tendance fléchés avec des
Btmm state engine pro
Garry James Goodchild
5 (3)
BTMM State Engine Pro is a MetaTrader 5 indicator for traders who use the Beat The Market Maker approach: Asian session context, kill zone timing, level progression, peak formation detection, and a multi-pair scanner from a single chart. It combines cycle state logic with a built-in scanner dashboard so you do not need the same tool on many charts at once. What it does Draws the Asian session range; session times can follow broker server offset or be set in inputs. Tracks level progression (L
Voyez quelle strategie fonctionne reellement sur votre symbole - avant de risquer de l'argent reel. Power Bar detecte les barres de prix extremes sur n'importe quel symbole et n'importe quel timeframe, puis backteste instantanement 3 strategies de trading differentes pour que vous puissiez comparer les taux de reussite, les facteurs de profit et les P&L cote a cote. Le tout dans un seul panneau interactif. Pas de suppositions. Pas de suroptimisation. Juste des donnees. Qu'est-ce qui rend Power
FX Trend MT5 NG
Daniel Stein
5 (4)
FX Trend NG : La Nouvelle Génération d’Intelligence de Tendance Multi-Marchés Vue d’ensemble FX Trend NG est un outil professionnel d’analyse de tendance multi-timeframe et de surveillance des marchés. Il vous permet de comprendre la structure complète du marché en quelques secondes. Au lieu de naviguer entre de nombreux graphiques, vous identifiez immédiatement quels instruments sont en tendance, où le momentum s’affaiblit et où plusieurs unités de temps sont alignées. Offre de Lancement – Ob
Crystal Heikin Ashi Signals
Muhammad Jawad Shabir
5 (2)
Crystal Heikin Ashi Signals - Professional Trend & Signal Detection Indicator Advanced Heikin Ashi Visualization with Intelligent Signal System for Manual & Automated Trading Final Price: $149 ---------> Price goes up $10 after every 10 sales . Limited slots available — act fast . Overview Crystal Heikin Ashi Signals is a professional-grade MetaTrader 5 indicator that combines pure Heikin Ashi candle visualization with an advanced momentum-shift detection system. Designed for both manual traders
RFI levels PRO MT5
Roman Podpora
3.67 (3)
L'indicateur montre avec précision les points de retournement et les zones de retour des prix où le       Acteurs majeurs   . Vous repérez les nouvelles tendances et prenez des décisions avec une précision maximale, en gardant le contrôle de chaque transaction. VERSION MT4     -    Révèle son potentiel maximal lorsqu'il est combiné à l'indicateur   TREND LINES PRO Ce que l'indicateur montre : Structures et niveaux d'inversion avec activation au début d'une nouvelle tendance. Affichage des nivea
Trend indicator AI mt5
Ramil Minniakhmetov
5 (16)
L'indicateur Trend Ai est un excellent outil qui améliorera l'analyse du marché d'un trader en combinant l'identification des tendances avec des points d'entrée exploitables et des alertes d'inversion. Cet indicateur permet aux utilisateurs de naviguer dans les complexités du marché forex avec confiance et précision Au-delà des signaux primaires, l'indicateur Trend Ai identifie les points d'entrée secondaires qui surviennent lors des retraits ou des retracements, permettant aux traders de capit
Bill Williams Advanced
Siarhei Vashchylka
5 (11)
Bill Williams Advanced is designed for automatic chart analysis using Bill Williams' "Profitunity" system. The indicator analyzes four timeframes at once. Manual (Be sure to read before purchasing) Advantages 1. Analyzes the chart using Bill Williams' "Profitunity" system. Signals are displayed in a table in the corner of the screen and on the price chart. 2. Finds all known AO and AC signals, as well as zone signals. Equipped with a trend filter based on the Alligator. 3. Finds "Divergence Bar
Atomic Analyst MT5
Issam Kassas
3.94 (31)
Tout d'abord, il convient de souligner que cet indicateur de trading n'est ni repainting, ni redrawing et ne présente aucun délai, ce qui le rend idéal à la fois pour le trading manuel et automatisé. Manuel de l'utilisateur : réglages, entrées et stratégie. L'Analyste Atomique est un indicateur d'action sur les prix PA qui utilise la force et le momentum du prix pour trouver un meilleur avantage sur le marché. Équipé de filtres avancés qui aident à éliminer les bruits et les faux signaux, et à
Quantum TrendPulse
Bogdan Ion Puscasu
5 (22)
Présentation de   Quantum TrendPulse   , l'outil de trading ultime qui combine la puissance de   SuperTrend   ,   RSI   et   Stochastic   dans un seul indicateur complet pour maximiser votre potentiel de trading. Conçu pour les traders qui recherchent précision et efficacité, cet indicateur vous aide à identifier les tendances du marché, les changements de dynamique et les points d'entrée et de sortie optimaux en toute confiance. Caractéristiques principales : Intégration SuperTrend :   suivez f
Gann Made Easy   est un système de trading Forex professionnel et facile à utiliser qui est basé sur les meilleurs principes de trading en utilisant la théorie de mr. WD Gann. L'indicateur fournit des signaux d'ACHAT et de VENTE précis, y compris les niveaux Stop Loss et Take Profit. Vous pouvez échanger même en déplacement en utilisant les notifications PUSH. VEUILLEZ ME CONTACTER APRÈS L'ACHAT POUR RECEVOIR GRATUITEMENT DES INSTRUCTIONS DE TRADING ET D'EXCELLENTS INDICATEURS SUPPLÉMENTAIRES! V
PZ Trend Trading MT5
PZ TRADING SLU
3.8 (5)
Capture every opportunity: your go-to indicator for profitable trend trading Trend Trading is an indicator designed to profit as much as possible from trends taking place in the market, by timing pullbacks and breakouts. It finds trading opportunities by analyzing what the price is doing during established trends. [ Installation Guide | Update Guide | Troubleshooting | FAQ | All Products ] Trade financial markets with confidence and efficiency Profit from established trends without getting whip
RelicusRoad Pro : Système d'Exploitation Quantitatif du Marché 70% DE RÉDUCTION ACCÈS À VIE (DURÉE LIMITÉE) - REJOIGNEZ 2 000+ TRADERS Pourquoi la plupart des traders échouent-ils même avec des indicateurs "parfaits" ? Parce qu'ils tradent des concepts isolés dans le vide. Un signal sans contexte est un pari. Pour gagner, il faut de la CONFLUENCE . RelicusRoad Pro est un Écosystème Quantitatif complet . Il cartographie la "Fair Value Road", distinguant le bruit des cassures structurelles. Arrête
FX Power MT5 NG
Daniel Stein
5 (31)
FX Power : Analysez la force des devises pour des décisions de trading plus intelligentes Aperçu FX Power est l'outil essentiel pour comprendre la force réelle des principales devises et de l'or, quelles que soient les conditions du marché. En identifiant les devises fortes à acheter et les faibles à vendre, FX Power simplifie vos décisions de trading et révèle des opportunités à forte probabilité. Que vous suiviez les tendances ou anticipiez les retournements à l'aide de valeurs extrêmes de D
Currency Strength Dashboard Pro Tableau de bord professionnel d’ analyse de la force des devises en temps réel pour MetaTrader 5 . L’indicateur calcule et affiche la force de 8 devises majeures (EUR, USD, GBP, JPY, CHF, AUD, CAD, NZD) en utilisant 28 paires de devises simultanément sur plusieurs unités de temps. Le tableau de bord offre au trader une vision complète du marché en un seul coup d’œil — sans calculs supplémentaires ni changement entre plusieurs graphiques. Méthode de calcul L’indica
CGE Trading Suite
Carl Gustav Johan Ekstrom
5 (1)
CGE Trading Suite delivers the analytical edge typically reserved for professional trading desks. The platform integrates a full suite of analytical tools into one seamless workflow: dynamic grid mapping, liquidity behavior analysis, ECM, trend lines, MIDAS, trade cycles, and directional channel projections. Together, these provide a unified view of market structure and momentum. Directional clarity is further enhanced by the capital flow index, which measures currency basket strength to identif
ARIPoint
Temirlan Kdyrkhan
ARIPoint is a powerful trading companion designed to generate high-probability entry signals with dynamic TP/SL/DP levels based on volatility. Built-in performance tracking shows win/loss stats, PP1/PP2 hits, and success rates all updated live. Key Features: Buy/Sell signals with adaptive volatility bands Real-time TP/SL/DP levels based on ATR Built-in MA Filter with optional ATR/StdDev volatility Performance stats panel (Success, Profit/Loss, PP1/PP2) Alerts via popup, sound, push, or email Cu
TREND LINES PRO   Cet indicateur permet de comprendre les véritables changements de direction du marché. Il révèle les renversements de tendance et les points de retour des principaux acteurs. Tu vois   Lignes BOS   Détection des changements de tendance et des niveaux clés sur des unités de temps supérieures, sans paramètres complexes ni interférences inutiles. Les signaux restent affichés sur le graphique même après la fermeture de la bougie. Version MT4   -   Révèle son potentiel maximal lorsq
Berma Bands
Muhammad Elbermawi
5 (8)
L'indicateur Berma Bands (BB) est un outil précieux pour les traders qui cherchent à identifier et à capitaliser sur les tendances du marché. En analysant la relation entre le prix et les BB, les traders peuvent déterminer si un marché est dans une phase de tendance ou de range. Visitez le [ Berma Home Blog ] pour en savoir plus. Les bandes de Berma sont composées de trois lignes distinctes : la bande de Berma supérieure, la bande de Berma moyenne et la bande de Berma inférieure. Ces lignes sont
Advanced Supply Demand MT5
Bernhard Schweigert
4.53 (15)
La meilleure solution pour tout commerçant débutant ou expert ! Cet indicateur est un outil de trading unique, de haute qualité et abordable car nous avons intégré un certain nombre de fonctionnalités propriétaires et une nouvelle formule. Avec cette mise à jour, vous pourrez afficher des zones à double horaire. Vous pourrez non seulement afficher un TF plus élevé, mais afficher les deux, le graphique TF, PLUS le TF supérieur : AFFICHAGE DES ZONES NICHÉES. Tous les traders Supply Demand vont ado
Gold Sniper Scalper Pro
Ich Khiem Nguyen
3.78 (9)
Gold Sniper Scalper Pro est un indicateur pour MetaTrader 5 conçu spécifiquement pour détecter les figures de fausse cassure (false breakout) sur XAUUSD. Il identifie la structure piège à 4 barres où le prix franchit la limite d'un range, attire les traders de cassure, puis inverse — confirmant que le mouvement était une fausse cassure. L'indicateur évalue chaque configuration selon 17 facteurs de qualité, la traite à travers un pipeline de confluence à 4 couches, la vérifie contre un moteur de
Auto Optimized Parabolic RSI : Moteur de Momentum 3D Avancé La plupart des indicateurs pour les particuliers échouent car ils s'appuient sur des paramètres statiques qui se brisent dès que la volatilité du marché change. L'Auto Optimized Parabolic RSI résout le problème de l'« obsolescence des indicateurs » en recalculant continuellement son propre avantage mathématique, apportant une adaptation quantitative de niveau institutionnel directement sur votre terminal MT5. L'Avantage Principal : Opti
Trend Hunter MT5
Andrey Tatarinov
5 (4)
Trend Hunter est un indicateur de tendance pour travailler sur les marchés du Forex, des cryptomonnaies et des CFD. Une particularité de l'indicateur est qu'il suit la tendance avec confiance, sans changer le signal lorsque le prix dépasse légèrement la ligne de tendance. L'indicateur n'est pas redessiné; un signal d'entrée sur le marché apparaît après la fermeture de la barre. Lorsque vous suivez une tendance, l'indicateur affiche des points d'entrée supplémentaires dans la direction de la te
Filtrer:
Aucun avis
Répondre à l'avis