All in One Pivot Point
- Göstergeler
- Sürüm: 3.8
- Güncellendi: 30 Kasım 2022

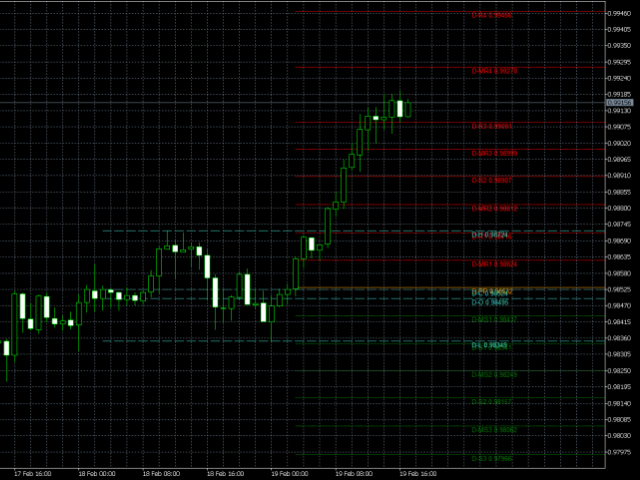
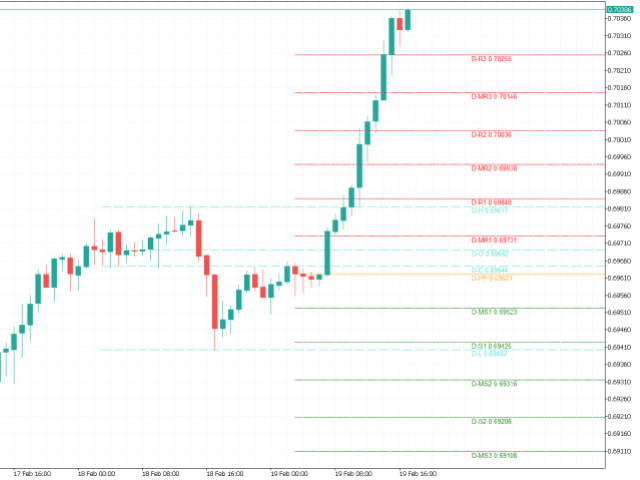
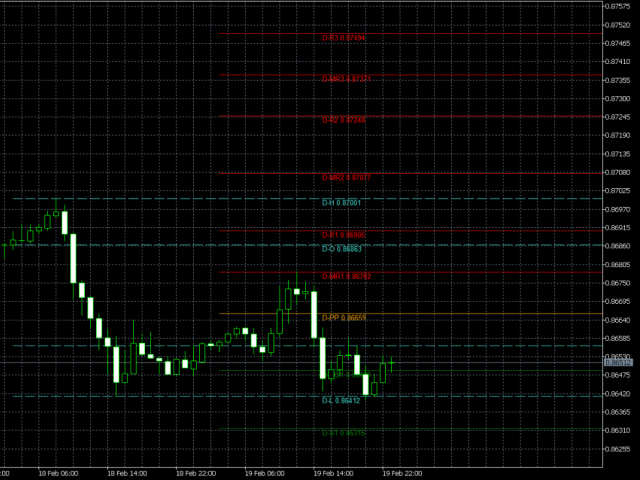
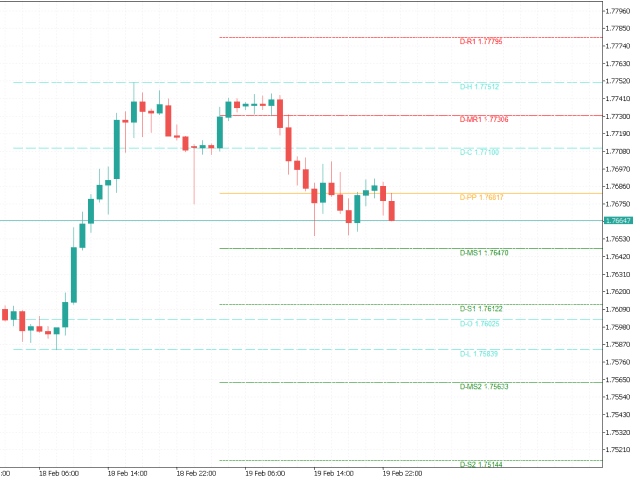
This indicator calculates support and resistance prices in multi-timeframe with different formulation and draw them on the chart that style do you choose. And If you want, Indicator can alert you when the current price arrive these pivot levels.
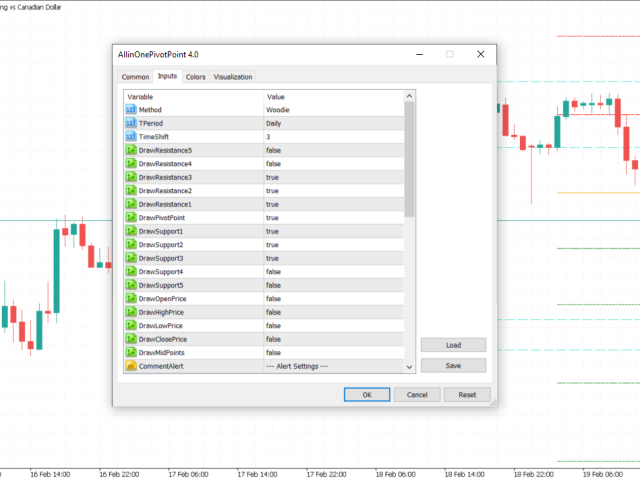
Formulations: Classic, Camarilla, Woodie, Demark, Floor, Fibonacci
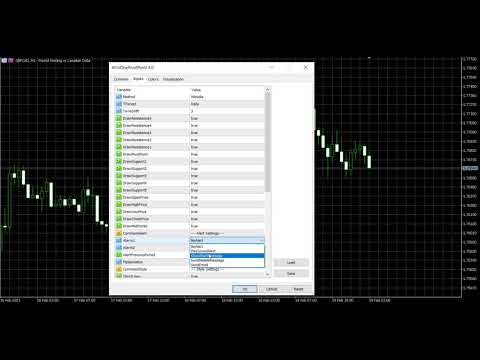
Alert Options: Send Mobil Message, Send E-mail, Show Message, Sound Alert
Levels: PP, S1, S2, S3, S4, S5, R1, R2, R3, R4, R5, TC, BC and Middle Points
Why do you need this indicator:
- Time Shifting: You can set start hour for calculating. And that way you can see levels independently from broker server's time-zone.
- Extended Levels: You can enable R5 and R4 Resistance levels or S4 and S5 Support levels
- Previous Period: You can show previous period prices that used to calculate support and resistance levels. Such as open price, close price, high price and low price.
- Middle Points: You can show midpoints between Support and Resistance levels
- CPR: You can show CPR(Central Pivot Range) levels. TC(Top Central) and BC(Bottom Central)
- Style: You can set style settings for all pivot levels separately. For example Type, Width, Color, length (short or long line), Draw Background and Disable Selection, etc.
- Compatibility: This indicator works flawless with other indicators on the same chart. And If you want, you can use it in the other custom indicator or expert advisor' code for getting all support and resistance prices from indicator buffer.
- Multi-Use: You can use more than one time on the same chart with different period setting. For example: one with a daily period setting and second one with a weekly period setting or if you want, also you can add third with the monthly period setting.
- Dual-Alert: If you like, you can set two alert type. Such as you can get push message to your phone and e-mail message at the same time.
- Re-Calculate: When start the new period, Indicator calculates the new prices and draw pivot levels on the chart automatically.
- Different Periods: You can choose Hourly, Daily, Weekly or Montly period for calculation pivot levels.
- Save-Time: Time is the most valuable thing. Don't waste your precious time for calculating pivot levels every day.
- Toggle Button: You can enable toggle button for pivot lines. (Button position can be changeable by xdistance and ydistance inputs)
Recommends:
- AlertPreviousPeriod: False (If one of the previous period level is very close the one of the current level, you should not enable it for not getting a lot of alert.)
- PipDeviation: 3 (You must set max 10 to prevent from getting a lot of alert.)
Alert Options:
* If you choose to SendEmail, you must configure the E-Mail settings (MetaTrader > Tools > Options > E-Mail)
* If you choose to SendMobilMessage, you must configure the push notification settings (MetaTrader > Tools > Options > Notifications)
* Send E-mail and Send Mobil Message options cannot be used in Demo mode. But you can select ShowAlertMessage option and see all created alarm in the strategy tester's journal section.


Good Stuff! Thanks!