Pivot classic woodie camarilla fibo demark
- Göstergeler
- Sürüm: 1.0

Pivot Classic, Woodie, Camarilla, Fibonacci and Demark
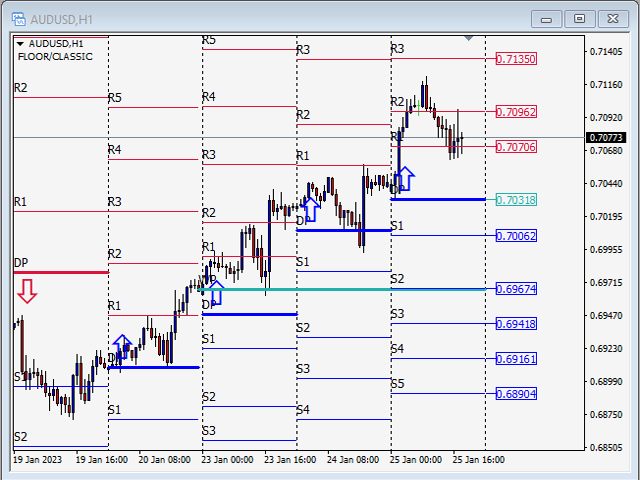
Floor/Classic
Pivot noktaları veya basitçe pivotlar, bir varlığın en yüksek, en düşük ve kapanış değerlerini inceleyerek potansiyel destek/direnç seviyelerini, alım satım aralıklarını, trend dönüşlerini ve piyasa duyarlılığını belirlemek için kullanışlıdırlar. Floor/Classic Pivot Noktaları şu şekilde hesaplanabilir.
Pivot Point (P) = (High + Low + Close)/3
S1 = P * 2 - High
S2 = P - (High - Low)
S3 = Low – 2*(High - P)
R1 = P * 2 - Low
R2 = P + (High - Low)
R3 = High + 2*(P - Low)
Woodie
Pivot noktası hesaplamasının standart yöntemden farklıdır. Destek ve direnç seviyelerini hesaplamak için, aralık olarak da bilinen bir önceki günün yüksek ve düşük seviyeleri arasındaki farkı kullanır. Bazı tüccarlar, bir önceki dönemin kapanış fiyatına daha fazla ağırlık verdikleri için Woodie formüllerini kullanmayı tercih ederler. Woodie Pivot Noktaları şu şekilde hesaplanabilir.
R2 = P + (H - L)
R1 = (2 * P) - LOW
P = (HIGH + LOW + (CLOSE * 2)) / 4
S1 = (2 * P) - HIGH
S2 = P - (H - L)
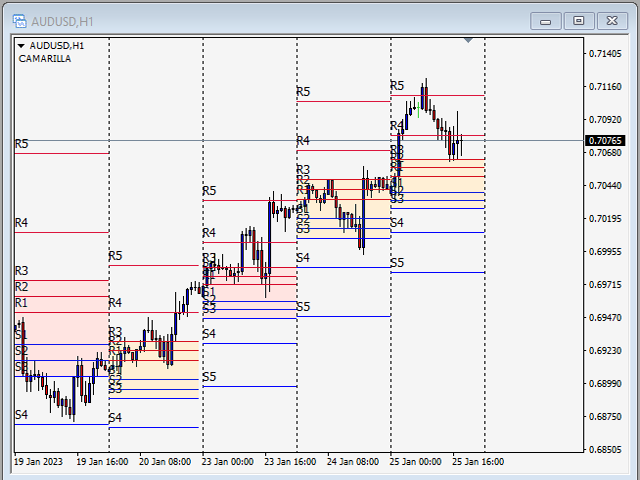
Camarilla
Camarilla formülleri Woodie formülüne benzer. Temel fikri fiyatın ortalamasına geri dönme eğiliminde olduğudur. Camarilla seviyeleri doğru zarar durdurma ve kar hedefi emirlerini hedeflemeye yardımcı olur. En önemli seviyeler S3, S4 ve R3, R4 'tür. Camarilla Pivot Noktaları şu şekilde hesaplanabilir.
R4 = ((High - Low) * 1.1) / 2 + Close
R3 = ((High - Low) * 1.1) / 4 + Close
R2 = ((High - Low) * 1.1) / 6 + Close
R1 = ((High - Low) * 1.1) / 12 + Close
S1 = Close - ((High - Low) * 1.1) / 12
S2 = Close - ((High - Low) * 1.1) / 6
S3 = Close - ((High - Low) * 1.1) / 4
S4 = Close - ((High - Low) * 1.1) / 2
Fibonacci
Fibonacci pivot noktası seviyeleri, standart yöntemde olduğu gibi önce pivot noktası hesaplanarak belirlenir. Ardından, önceki günün aralığını karşılık gelen Fibonacci seviyesiyle çarpılır Çoğu tacir, hesaplamalarında % 38,2 % 61,8 ve %100 düzeltmelerini kullanır. Bunun arkasındaki mantık, birçok tüccarın Fibonacci oranlarını kullanmasıdır. Fibonacci Pivot Noktaları şu şekilde hesaplanabilir.
Pivot Point (P) = (High + Low + Close)/3
Support 1 (S1) = P - (0.382 * (High - Low))
Support 2 (S2) = P - (0.6182 * (High - Low))
Support 3 (S3) = P - (1 * (High - Low))
Resistance 1 (R1) = P + (0.382 * (High - Low))
Resistance 2 (R2) = P + (0.6182 * (High - Low))
Resistance 3 (R3) = P + (1 * (High - Low))
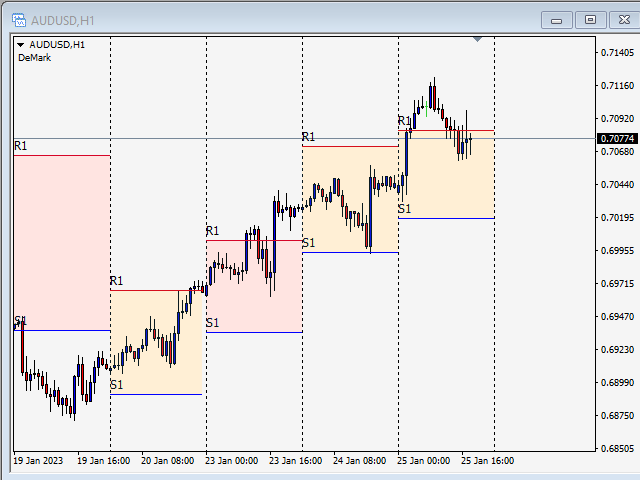
Demark
Bu pivot noktaları, açılış fiyatı ile kapanış fiyatı arasındaki ilişkiye bağlı olarak son fiyat hareketlerine daha fazla önem veren koşullu bir yapıya sahiptir. Demark Pivot Noktaları şu şekilde hesaplanabilir.
If Close < Open, then X = High + (2 * Low) + Close
If Close > Open, then X = (2 * High) + Low + Close
If Close = Open, then X = High + Low + (2 * Close)
Support 1 (S1) = X/2 - High
Resistance 1 (R1) = X/2 - Low
It really helps me to take trades. Thanks to the Creator.