Support and Resistance Depth of Market

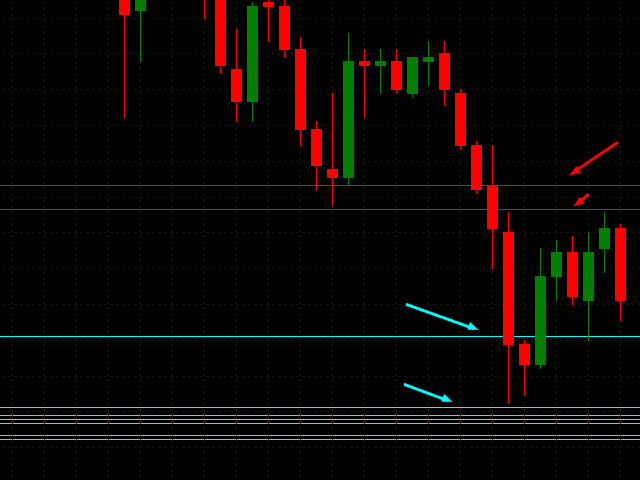
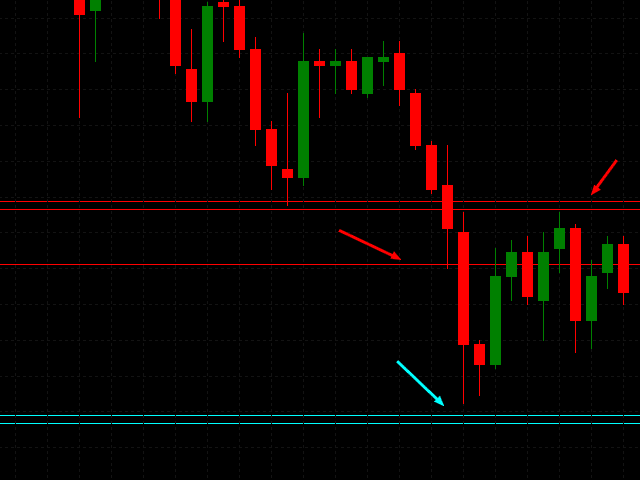
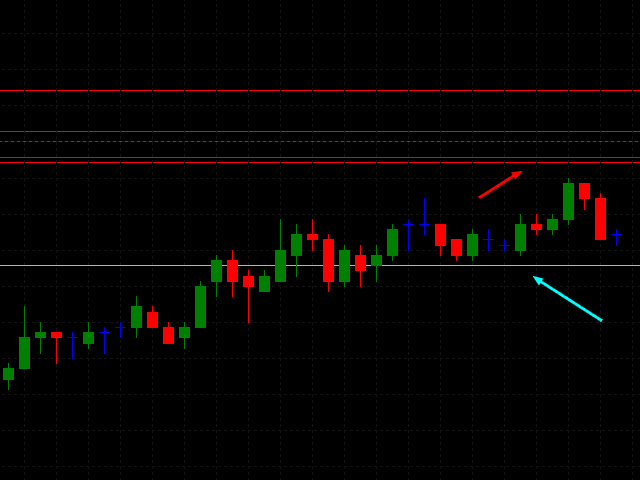
We often look for support and resistance points on the chart. One of the techniques that can be used is through the quantity of lots offered in the order book. This indicator searches for the largest lots in the order book and draws them on the graph in the form of lines, thereby obtaining where is the greatest concentration of lots offered on the centralized stock market at that time, thus configuring possible support and resistance lines.

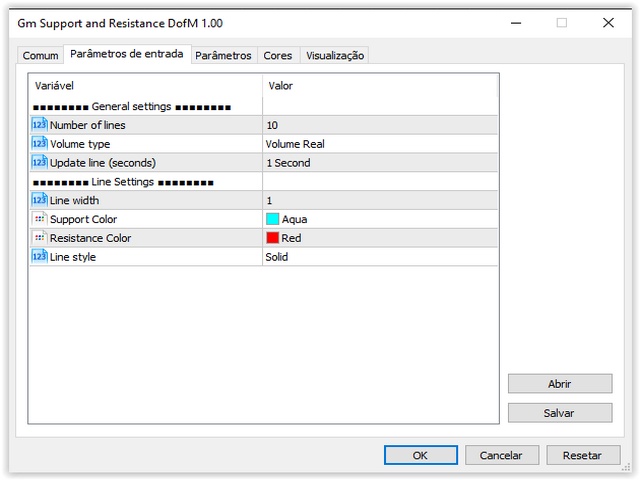
- The number of lines to draw can be defined by the user;

- Line width;

- Line update time;

- Line style;

- Line colors.

NOTE: This indicator only works on assets with an Order Book, such as a centralized stock exchange.

DOES NOT WORK IN FOREX !!!

Any doubts I am available!
Önerilen ürünler
ZigZag SMC MT5
Kallebe Lins De Oliveira Santos
The ZigZag SMC/SMT Indicator for MT5 is the ideal tool for traders who want to accurately identify tops and bottoms based on the advanced concepts of Smart Money Concepts (SMC) and Smart Money Trap (SMT). Main Benefits: Automatic identification of strategic tops and bottoms. Based on concepts used by institutional traders. Ideal for analyzing liquidity, market structure and manipulation. Simple to use: just add it to the chart and track the critical points. ️ Free Version: This ve
FREE
Cybertrade Auto Fibonacci
Emanuel Andriato
4.9 (10)
Cybertrade Auto Fibonacci retraction and projection  - MT5 Auto Fibonacci is an indicator that automatically plots the Fibonacci retracement and projection based on the number of bars you select in the indicator setting. You can customize nine different levels of retraction and three levels of projection. It works on periods longer than the period visible on the chart. All values ​​are available in the form of buffers to simplify possible automations. This indicator is the same one we use in ou
FREE
Günün en yüksek ve en düşük değerine dayalı olarak otomatik çizilen RETRACEMENT ve SAVUNMA bölgelerini "Maximum and Minimum Fibonacci Retracement Full" göstergesi ile keşfedin Bu göstergede, retracement seviyeleri günün en yüksek ve en düşük değerine göre otomatik olarak ayarlanır, böylece işlemci önemli retracement noktalarını, örneğin Altın Bölgeler (61,8%) analiz edebilir. Birçok kişi için Fibonacci teknik göstergesi çok önemlidir ve piyasa hareketlerini tahmin etmenin temelini oluşturur.
Hurst Cycles Diamonds Description This indicator is an alternative version inspired by the pioneering work of David Hickson and the Hurst Cycles Notes indicator developed by Grafton. The main objective is to provide a clear and intuitive view of the Hurst cycles. Credits Original Concept : David Hickson - Hurst Cycles Theory Inspiration : Grafton - Hurst Diamond Notation Pivots Alternative Version : Fillipe dos Santos Main Features Identifies and displays pivots in multiple time cycles Visual t
Probability Advanced Indicator
Dioney De Jesus Batista Alves
The   ProbabilityAdvancedIndicator   is a sophisticated trend probability analysis tool designed for scalping and day trading. It combines multiple technical indicators and multi-timeframe analysis to generate clear visual signals for buy/sell probabilities. The   ProbabilityAdvancedIndicator   is a comprehensive tool for traders looking for: Probability-based decision-making Consolidated technical analysis Flexibility for different trading styles Intuitive and customizable interface Pro Tip:  
Fibonacci Sessions Göstergesi, hassas scalping ve gün içi stratejiler için tasarlanmış güçlü bir ticaret aracıdır. New York, Londra ve Asya seansları için otomatik olarak önemli Fibonacci seviyelerini çizer ve yatırımcılara ana piyasa seanslarındaki fiyat hareketlerinin net bir görünümünü sunar. Her seansta fiyatın en çok tepki verdiği benzersiz "Altın Bölgeler" vurgulanır. Bu, dönüşler, kırılmalar ve trend yönlü işlemler için son derece güvenilir bölgeler oluşturur. Gösterge, fiyatın sık sık bi
FREE
Marca Dagua
Erison Francisco De Sales
3 (1)
Adiciona marca d'água com nome do ativo em negociação. Pode ser ajustado definindo tamanho da fonte e coloração do texto. Testado com vários ativos do mercado B3 e Forex  Adione ao gráfico e configure de acordo com a necessidade. Caso tenha problemas sinta-se a-vontade para nos avisar e providenciaremos a correção logo que possível. ______________________________
FREE
This indicator builds upon the previously posted Nadaraya-Watson smoothers. Here we have created an envelope indicator based on Kernel Smoothing with integrated alerts from crosses between the price and envelope extremities. Unlike the Nadaraya-Watson estimator, this indicator follows a contrarian methodology. Please note that by default this indicator can be subject to repainting. Users can use a non-repainting smoothing method available from the settings. The triangle labels are designed so
Timeframe Separator
Alexandre Borela
5 (2)
If you like this project, leave a 5 star review. Often times we are using brokers that are outside of the GMT-0 timezone, this not only complicates things, but, it can make seeing when a trading session starts a bit more difficult than it should. This indicator allows you to set a timezone offset it will draw a vertical line for the: Day. Week. Month. Quarter. year.
FREE
This indicator was creating a perfect structure to not re-paint or recalculate, all signals are accurate. I can create a robotic version of this indicator but I need more precision in the signals. So appreciate this work. Tips to use when trading, do not buy at the top or sell at the bottom, always buy at the bottom  and sell at the top. Risk 1 to 3. In the settings you can adjust the size of the shadow or trail of the candle, you can change the colors and sizes of the arrows.
FREE
XCalper HiLo Activator
Aecio de Feo Flora Neto
HiLo Activator v1.02 by xCalper The HiLo Activator is similar to moving average of previous highs and lows. It is a trend-following indicator used to display market’s direction of movement. The indicator is responsible for entry signals and also helps determine stop-loss levels. The HiLo Activator was first introduced by Robert Krausz in the Feb. 1998 issue of Stocks & Commodities Magazine.
BlockOscilationDay
Everton Fernando Da Silva Messias
BlockOscilationDay – Profesyonel Piyasa Görsel Analizi Açıklama BlockOscilationDay, piyasa hareketlerinin net ve zarif bir görsel analizini sunan sofistike bir teknik göstergedir. Basitlik ve verimliliğe değer veren yatırımcılar için tasarlanan gösterge, temiz ve sezgisel bir arayüzde birden fazla bilgi katmanını birleştirir. Ana Özellikler Çoklu Zaman Dilimi Analizi Herhangi bir zaman diliminde yapılandırılabilir dinamik trend çizgileri Önceki günün önemli seviyelerinin görselleştirilmesi
Golden Vector
Marius Ovidiu Sunzuiana
Golden Vector — Precision Market Geometry for the Modern Trader Golden Vector is a cutting‑edge trading indicator that fuses advanced Fibonacci analytics with high‑level mathematical modeling to reveal the hidden vectors driving market movement. Engineered for traders who demand more than basic retracement lines, it transforms raw price data into a geometrically structured roadmap for strategic entries and exits. Core Advantages Next‑Gen Fibonacci Engine — Goes beyond standard ratios, dynamical
DG TrendSigns
David Gadelha
2 (1)
Purpose DG Trend+Signs is an indicator that paints candles with trend colors and clearly shows consolidations, using both DoGMA Trend and DoGMA Channel indicators. It was created to help users in their trades, showing trends, consolidations and marking entry and exit points. The indicator also takes consolidations in consideration to identify breakouts. Key features Designed to be simple to use, with a few parameters Does NOT repaint Does NOT recalculate Signals on entries Works in ALL pairs Wo
Multiple Timeframe MACD indicator. This indicator was built for making multiple timeframe analysis possible in MT5 using MACD Indicator. MACD Indicator traditionally shows two lines and one histogram. MACD Line(Yellow) is calculated by subtracting 12period EMA(fast) from 26period EMA (slow). Signal Line(Blue) is created by a 9period EMA from MACD Line. Histogram is just the difference between MACD and Signal lines. Histogram is colored based on the difference between its value and the previous h
HiLo Activator Plus
Rodrigo Galeote
5 (1)
HiLo Activator is one of the most used indicators to determine trend. Find it here with the ability to customize period and colors. This indicator also plots up and down arrows when there is a change on the trend, indicating very strong entry and exit points. HiLo fits well to different types of periods for day trading. You can easily understand when it is time to buy or sell. It works pretty good also for other periods like daily and monthly signalizing long-term trends. The use of the indicato
A powerful oscillator that provide Buy and Sell signals by calculating the investor liquidity. The more liquidity the more buy possibilities. The less liquidity the more sell possibilities. Please download the demo and run a backtest! HOW IT WORKS: The oscillator will put buy and sell arrow on the chart in runtime only . Top value is 95 to 100 -> Investors are ready to buy and you should follow. Bottom value is 5 to 0 -> Investors are ready to sell and you should follow. Alert + sound will appe
MetaTraderPro Premium Indicator (MT5) The MetaTraderPro Premium Indicator is designed to clearly and objectively identify potential entry and exit points in the market. With signals displayed directly on the chart, it provides practicality and agility to support decision-making. Key Advantage: the indicator does not repaint and does not recalculate after the candle closes, ensuring consistent and reliable signals. Features: Buy and sell arrows directly on the chart No repainting or rec
Easy Fibonacci
Rajesh Kumar Nait
Easy Fibonacci, Fibonacci düzeltmelerini kolayca çizmenizi sağlayan MT5 için bir göstergedir. Özellikler Gösterge ayarlarından 10'a kadar fibo seviyesi ayarlanabilir. Her seviye, farklı çizgi stili, çizgi rengi, çizgi genişliği ve diğer özelleştirilebilir ayarlara sahip olabilir. Ekstra düğmeli bir fare kullanarak V ve B tuşlarını eşleyebilir ve Fibonacci'yi kolayca çizebilirsiniz. Düğme İşlevleri: B ve V: Grafiğin görünen alanında üst/alt Fibonacci'yi çiz. N ve M: Sonraki ve önceki Mumların uza
Descrição Este Expert Advisor (EA) implementa uma estratégia baseada na divergência de preços entre o mini dólar (WDO$N) e o dólar cheio (DOL$N). Ele monitora, segundos antes da abertura do mercado ou ao longo do dia (conforme o modo escolhido), possíveis discrepâncias entre esses dois ativos e efetua ordens no mini dólar, apostando na convergência futura. Principais Recursos Divergência Mínima Configurável: A estratégia utiliza um parâmetro de divergência mínima de 10 pontos, ajustável de acor
FREE
Golden Limit
Renato Fridschtein
There are no limits! Golden Limit is the ultimate indicator to get clear and easy readings of price movements on charts. It projects support and resistance ranges, calculated by statistical models involving Price Action and the Fibonacci sequence, revealing in advance the behavior of prices and the best places to trade and not to trade. It also has two moving averages to help choose the best entries. The Golden Limit method was created from a proven model. In summary: We use the names of precio
Noize Absorption Index - is the manual trading system that measures the difference of pressure between bears forces and bulls forces. Green line - is a noize free index that showing curent situation. Zero value of index shows totally choppy/flat market.Values above zero level shows how powerfull bullish wave is and values below zero measures bearish forces.Up arrow appears on bearish market when it's ready to reverse, dn arrow appears on weak bullish market, as a result of reverse expectation.
DMC Trend
Deibson Carvalho
Indicator that uses ATR and standard deviation to calculate the current trend. It has the top and bottom line. The top line is shown when it is high, and the bottom line when it is low. The indicator does not draw a trend line or show the trend for the day, or for a certain period. It has the function of indicating the current trend, and may indicate a reversal. use it with caution and at your own risk.
FREE
Swing Scanner MT5
Reza Aghajanpour
5 (6)
**   All Symbols   x   All Time frames   scan just by pressing scanner button ** Discount: The price is $50$, But now it is just $35, Limited time offer is active. *** Contact me  to send you instruction and add you in "Swing scanner group" for sharing or seeing experiences with other users. Swing EA:  https://www.mql5.com/en/market/product/124747 Introduction: Swing Scanner   is the indicator designed to detect swings in the direction of the trend and possible reversal swings. The indicator st
The indicator Supply Demand RSJ PRO calculates and plots the "Supply" and "Demand" zones on the graph, identifying the type of Zone (Weak, Strong, Verified, Proven) and in case of retests of the Zone it shows how many times it was retested. "Supply" Zones are the price zones where more supply than demand has occurred, driving prices down. "Demand" Zones are the price zones where more demand than supply has occurred, pushing prices up. Be sure to try our professional version with configurable fe
Dual Bollinger Session Channel
Danton Dos Santos Sardinha Junior
Dual Bollinger Session Channel Product Description Dual Bollinger Session Channel is a professional MetaTrader 5 indicator that builds price channels based on two independent Bollinger Bands , calculated from the last real trading session (daily or weekly), strictly respecting the exact session boundaries. Unlike traditional Bollinger Bands that move and recalculate on every new candle, this indicator locks the channel levels for the entire session , allowing traders to clearly identify: Price e
FREE
Fibaction
Abdelkhalek Orabi
Indicator Name: Fibaction – price action candle Detector Description: Fibo Signal Boxes is a powerful Smart Money Concept (SMC)-inspired indicator that auto-detects price action candles. bullish hammers and shooting stars, then draws precise Fibonacci entry zones and multiple take-profit levels directly on the chart. as for the SL personally i use 40 pips rules  Key Features: Detects bullish hammer and shooting star reversal candles. Automatically draws Fibonacci entry and TP boxes. as
Perfect indicator to use No Forex or Binary Options You can use it manually or use it automated on the mt2trading platform or similar 90% winrate indicator Common questions Which brokers does this work with? IQOption.com Binary.com Alpari.com Specter.ai Instaforex.com clmforex.com GCOption.com Is it necessary to leave my pc on all day using automated mode? > although our platform must constantly run on your laptop / PC, if you want it to work while you are away, it is not necessary to leave your
Provided Trend is a complex signal formation indicator. As a result of the work of internal algorithms, you can see only three types of signals on your chart. The first is a buy signal, the second is a sell signal, and the third is a market exit signal. Options: CalcFlatSlow - The first parameter that controls the main function of splitting the price chart into waves. CalcFlatFast - The second parameter that controls the main function of splitting the price chart into waves. CalcFlatAvg - Para
AguiaTraders F12 PRO
Renato Fiche Junior
3.5 (2)
This tool was developed to help traders on candle by candle and replay training. In the indicator settings, the user can set the training start datetime. The indicator will autommatically hide all candles after this datetime. So the user can make studies before starting the training. Starting the training, the user can simulate your trades quickly and easily! This is a product developed by Renato Fiche Junior and available to all MetaTrader 5 users! Input Parameters Training Start -  training
FREE
Bu ürünün alıcıları ayrıca şunları da satın alıyor
Bu indikatörü satın alırsanız, Profesyonel Trade Manager’ımı  + EA ÜCRETSİZ olarak alacaksınız. Öncelikle, bu Ticaret Sistemi'nin Non-Repainting, Non-Redrawing ve Non-Lagging Göstergesi olduğunu vurgulamak önemlidir, bu da hem manuel hem de robot ticareti için ideal hale getirir. Online kurs, kılavuz ve ön ayarları indir. "Smart Trend Trading System MT5", yeni ve deneyimli tüccarlar için özelleştirilmiş kapsamlı bir ticaret çözümüdür. 10'dan fazla premium göstergeyi birleştiriyor ve 7'den fazla
Power Candles – Tüm Piyasalar İçin Güce Dayalı Giriş Sinyalleri Power Candles , Stein Investments’ın kanıtlanmış güç analizini doğrudan fiyat grafiğinize taşır. Sadece fiyata tepki vermek yerine, her mum gerçek piyasa gücüne göre renklendirilir. Bu sayede momentum birikimleri, güç hızlanmaları ve net trend geçişleri anında görülebilir. Tüm Piyasalar İçin Tek Mantık Power Candles tüm işlem sembollerinde otomatik olarak çalışır. Gösterge, mevcut sembolün Forex mi yoksa Forex dışı bir piyasa mı old
Divergence Bomber
Ihor Otkydach
4.96 (76)
Bu göstergeyi satın alan herkese aşağıdaki ekstra içerikler ücretsiz olarak sunulmaktadır: Her işlemi otomatik olarak yöneten, Stop Loss ve Take Profit seviyelerini ayarlayan ve işlemleri strateji kurallarına göre kapatan özel yardımcı araç: "Bomber Utility" Göstergenin farklı varlıklar üzerinde kullanılmasına yönelik ayar dosyaları (set dosyaları) Bomber Utility için 3 farklı modda kullanım sunan ayar dosyaları: "Minimum Risk", "Dengeli Risk" ve "Bekle-Gör Stratejisi" Bu ticaret stratejisini hı
*** Entry In The Zone ve SMC Multi Timeframe, Smart Money Concepts (SMC) çerçevesine dayalı olarak geliştirilmiş gerçek zamanlı bir piyasa analiz aracıdır. Entry In The Zone ve SMC Multi Timeframe, yatırımcıların piyasa yapısını daha sistematik ve net bir şekilde analiz etmelerine yardımcı olmak, işlem verimliliğini artırmak ve stratejiniz için uzun vadeli sürdürülebilirlik yaratmak amacıyla geliştirilmiştir. Bu araç, Smart Money Concepts (SMC) çerçevesine dayanmaktadır. Birden fazla zaman dilim
FX Power MT5 NG
Daniel Stein
5 (28)
FX Power: Daha Akıllı Ticaret Kararları için Para Birimlerinin Gücünü Analiz Edin Genel Bakış FX Power , her piyasa koşulunda başlıca para birimlerinin ve altının gerçek gücünü anlamak için vazgeçilmez bir araçtır. Güçlü para birimlerini alıp zayıf olanları satarak, FX Power ticaret kararlarınızı basitleştirir ve yüksek olasılıklı fırsatları ortaya çıkarır. İster trendlere sadık kalın ister Delta'nın aşırı değerlerini kullanarak tersine dönüşleri öngörün, bu araç ticaret tarzınıza mükemmel bir
Gold Sniper Scalper Pro
Ich Khiem Nguyen
3.29 (7)
Gold Sniper Scalper Pro - MetaTrader 5'te Altın (XAU/USD) Ticaret Sistemi Ciddi yatırımcı için: Altın ticaretine, birden fazla piyasa analiz faktörünü birleştiren, yapılandırılmış, veriye dayalı bir metodoloji ile yaklaşın. Bu araç, Altın ticaret analizinizi desteklemek için üretilmiştir. Sınırlı Fiyat Fırsatı Bu, fiyat artmadan Gold Sniper Scalper Pro'ya sahip olma şansıdır.  Ürün fiyatı, sonraki her 10 satın alma işleminden sonra $50 artacaktır. Son Fiyat: $498 Analitik Avantajınızı Tanımlaya
Atomic Analyst MT5
Issam Kassas
4.19 (27)
Öncelikle belirtmek gerekir ki bu Ticaret Göstergesi Yeniden Çizim Yapmaz, Gecikmez ve Gecikme Göstermez, bu da hem manuel hem de robot ticareti için ideal hale getirir. Kullanıcı kılavuzu: ayarlar, girişler ve strateji. Atom Analisti, Piyasada Daha İyi Bir Avantaj Bulmak İçin Fiyatın Gücünü ve Momentumunu Kullanan PA Fiyat Hareketi Göstergesidir. Gürültüleri ve Yanlış Sinyalleri Kaldırmaya ve Ticaret Potansiyelini Artırmaya Yardımcı Olan Gelişmiş Filtrelerle Donatılmıştır. Birden fazla katmanl
Quantum TrendPulse
Bogdan Ion Puscasu
5 (20)
SuperTrend   ,   RSI   ve   Stochastic'in   gücünü tek bir kapsamlı göstergede birleştirerek işlem potansiyelinizi en üst düzeye çıkaran nihai işlem aracı olan   Quantum TrendPulse'u   tanıtıyoruz. Hassasiyet ve verimlilik arayan yatırımcılar için tasarlanan bu gösterge, piyasa trendlerini, momentum değişimlerini ve en uygun giriş ve çıkış noktalarını güvenle belirlemenize yardımcı olur. Temel Özellikler: SuperTrend Entegrasyonu:   Güncel piyasa trendlerini kolayca takip edin ve karlılık dalgası
Trend Screener Pro MT5
STE S.S.COMPANY
4.84 (99)
Trend Göstergesi, Trend Alım Satım ve Filtreleme için Çığır Açan Benzersiz Çözüm, Tüm Önemli Trend Özellikleriyle Tek Bir Araç İçinde Yerleştirildi! Forex, emtialar, kripto para birimleri, endeksler ve hisse senetleri gibi tüm sembollerde/araçlarda kullanılabilen %100 yeniden boyamayan çoklu zaman çerçevesi ve Çoklu para birimi göstergesidir. Trend Screener, grafikte noktalarla ok trend sinyalleri sağlayan etkili bir trend trend göstergesidir. Trend analizörü göstergesinde bulunan özellikler: 1.
Azimuth Pro
Ottaviano De Cicco
LAUNCH PROMO Azimuth Pro price is initially set at 299 $ for the first 100 buyers. Final price will be 499 $ . THE DIFFERENCE BETWEEN RETAIL AND INSTITUTIONAL ENTRIES ISN'T THE INDICATOR — IT'S THE LOCATION. Most traders enter at arbitrary price levels, chasing momentum or reacting to lagging signals. Institutions wait for price to reach structured levels where supply and demand actually shift. Azimuth Pro maps these levels automatically: swing-anchored VWAP, multi-timeframe structure lines,
Smart Stop Indicator – Stop-loss düzeylerini doğrudan grafikte akıllı ve hassas şekilde belirleyin Genel Bakış Smart Stop Indicator, stop-loss seviyesini tahmin ederek veya sezgilere güvenerek değil, net ve sistematik bir şekilde belirlemek isteyen traderlar için özel olarak geliştirilmiştir. Bu araç, klasik price-action mantığını (yükselen tepeler, düşen dipler) modern breakout algılama ile birleştirerek bir sonraki mantıklı stop seviyesini belirler. Trendlerde, yatay piyasalarda veya hızlı k
Trend indicator AI mt5
Ramil Minniakhmetov
5 (13)
Trend Ai göstergesi, trend tanımlamasını işlem yapılabilir giriş noktaları ve geri dönüş uyarılarıyla birleştirerek bir yatırımcının piyasa analizini geliştirecek harika bir araçtır. Bu gösterge, kullanıcıların forex piyasasının karmaşıklıklarında güvenle ve hassasiyetle yol almalarını sağlar. Birincil sinyallerin ötesinde, Trend Ai göstergesi geri çekilmeler veya düzeltmeler sırasında ortaya çıkan ikincil giriş noktalarını belirleyerek, yatırımcıların belirlenen trend içindeki fiyat düzeltmele
Ne kadar harika geriye dönük testler, canlı hesap performans kanıtları ve her yerde fantastik istatistikler sunan bir alım satım göstergesi aldınız, ancak onu kullandıktan sonra hesabınızı **patlatmakla mı sonuçlandınız?** Bir sinyale tek başına güvenmemelisiniz, öncelikle neden ortaya çıktığını bilmeniz gerekir ve RelicusRoad Pro bunu en iyi şekilde yapar! Kullanım Kılavuzu + Stratejiler + Eğitim Videoları + VIP Erişimli Özel Grup + Mobil Sürüm Mevcut Piyasaya Bakmanın Yeni Bir Yolu RelicusR
Öncelikle, bu Ticaret Aracının Non-Repainting, Non-Redrawing ve Non-Lagging Gösterge olduğunu vurgulamakta fayda var, bu da onu profesyonel ticaret için ideal hale getiriyor. Çevrimiçi kurs, kullanıcı kılavuzu ve demo. Akıllı Fiyat Hareketi Kavramları Göstergesi, hem yeni hem de deneyimli tüccarlar için çok güçlü bir araçtır. İleri ticaret fikirlerini, Inner Circle Trader Analizi ve Smart Money Concepts Ticaret Stratejileri gibi 20'den fazla kullanışlı göstergeyi bir araya getirerek bir araya
FX Levels MT5
Daniel Stein
5 (12)
FX Levels: Tüm Piyasalar İçin Son Derece Hassas Destek ve Direnç Hızlı Bakış Döviz kurları, endeksler, hisseler veya emtialar gibi herhangi bir piyasada güvenilir destek ve direnç seviyeleri belirlemek mi istiyorsunuz? FX Levels geleneksel “Lighthouse” yöntemini ileri düzey bir dinamik yaklaşımla birleştirerek neredeyse evrensel bir doğruluk sağlar. Gerçek broker deneyimimize ve otomatik günlük güncellemeler ile gerçek zamanlı güncellemelerin birleşimine dayalı olarak, FX Levels size dönüş nok
IX Power MT5
Daniel Stein
4.92 (12)
IX Power: Endeksler, Emtialar, Kripto Paralar ve Forex Piyasaları için İçgörüler Genel Bakış IX Power , endeksler, emtialar, kripto paralar ve forex sembollerinin gücünü analiz etmek için tasarlanmış çok yönlü bir araçtır. FX Power , tüm kullanılabilir döviz çiftlerinin verilerini kullanarak döviz çiftleri için maksimum doğruluk sağlarken, IX Power yalnızca temel sembolün piyasa verilerine odaklanır. Bu, IX Power 'ı forex dışındaki piyasalar için ideal ve daha basit forex analizleri için güven
Grabber System MT5
Ihor Otkydach
4.81 (21)
Size mükemmel bir teknik gösterge olan Grabber’ı tanıtıyorum. Bu araç, kullanıma hazır bir “her şey dahil” işlem stratejisi olarak çalışır. Tek bir yazılım kodu içinde güçlü piyasa teknik analiz araçları, işlem sinyalleri (oklar), uyarı işlevleri ve push bildirimleri entegre edilmiştir. Bu göstergeyi satın alan herkes aşağıdaki hediyeleri ücretsiz olarak alır: Açık emirleri otomatik yönetmek için Grabber Yardımcı Aracı Kurulum, yapılandırma ve nasıl işlem yapılacağını adım adım anlatan video kıl
ARIPoint
Temirlan Kdyrkhan
1 (1)
ARIPoint is a powerful trading companion designed to generate high-probability entry signals with dynamic TP/SL/DP levels based on volatility. Built-in performance tracking shows win/loss stats, PP1/PP2 hits, and success rates all updated live. Key Features: Buy/Sell signals with adaptive volatility bands Real-time TP/SL/DP levels based on ATR Built-in MA Filter with optional ATR/StdDev volatility Performance stats panel (Success, Profit/Loss, PP1/PP2) Alerts via popup, sound, push, or email Cu
SynaptixQuant Dominance Matrix
Devie Arevalo Montemayor
5 (1)
SynaptixQuant Dominance Matrix: Institutional-Grade Market State Extraction Engineered for traders who require a data-driven view of market behaviour beyond surface-level indicators. The Synaptix Quant (SQ) Dominance Matrix is not a conventional currency strength display. Behind its intentionally streamlined interface runs a sophisticated analytical architecture designed to quantify market conditions with precision. Every output is generated through layered signal processing built to identify d
- Real price is 80$ - 45% Discount (It is 45$ now) Contact me for extra bonus   indicator, instruction or any questions! - Lifetime update free - Non-repaint - Related product: Gann Gold EA - I just sell my products in Elif Kaya Profile, any other websites are stolen old versions, So no any new updates or support. Advantages of  M1 Scalper Pro  Profitability: M1 Scalper Pro is highly profitable with a strict exit strategy. Frequent Opportunities: M1 Scalper Pro  takes advantage of numerous smal
Berma Bands
Muhammad Elbermawi
5 (7)
Berma Bantları (BB'ler) göstergesi, piyasa trendlerini belirlemeyi ve bunlardan yararlanmayı amaçlayan yatırımcılar için değerli bir araçtır. Fiyat ile BB'ler arasındaki ilişkiyi analiz ederek, yatırımcılar bir piyasanın trend veya aralıklı fazda olup olmadığını ayırt edebilir. Daha fazla bilgi edinmek için [ Berma Home Blog ] adresini ziyaret edin. Berma Bantları üç belirgin çizgiden oluşur: Üst Berma Bandı, Orta Berma Bandı ve Alt Berma Bandı. Bu çizgiler fiyatın etrafına çizilir ve genel tren
FX Volume MT5
Daniel Stein
4.79 (24)
FX Volume: Bir Broker’ın Perspektifinden Gerçek Piyasa Duyarlılığını Deneyimleyin Kısa Özet Trading yaklaşımınızı bir adım öteye taşımak ister misiniz? FX Volume , perakende traderlar ile brokerların nasıl konumlandığını gerçek zamanlı olarak sunar—COT gibi gecikmeli raporlardan çok daha önce. İster istikrarlı kazançları hedefliyor olun, ister piyasada daha güçlü bir avantaj arayın, FX Volume önemli dengesizlikleri belirlemenize, kırılmaları (breakout) doğrulamanıza ve risk yönetiminizi iyileş
Support And Resistance Screener, MetaTrader için tek bir gösterge içinde birden fazla araç sağlayan tek bir Düzey göstergesindedir. Kullanılabilir araçlar şunlardır: 1. Piyasa Yapısı Eleme Aracı. 2. Geri Çekilme Bölgesi Boğa. 3. Geri Çekilme Bölgesi Ayı. 4. Günlük Pivot Noktaları 5. haftalık Pivot Noktaları 6. aylık Pivot Puanları 7. Harmonik Modele ve hacme dayalı Güçlü Destek ve Direnç. 8. Banka Seviyesi Bölgeleri. SINIRLI SÜRELİ TEKLİF : YG Destek ve Direnç Göstergesi sadece 50 $ ve ömür boyu
Meravith AUTO
Ivan Stefanov
5 (1)
Meravith Auto, Meravith ticaret sisteminin otomatik bir versiyonudur. Gösterge, rengini değiştiren bir trend çizgisinden oluşur. Yükseliş trendindeyken yeşil, düşüş trendindeyken kırmızıdır. Bu, trendin destek çizgisidir. Boğa hacminin ayı hacmine eşit olduğu bir likidite çizgisi. Üçlü boğa sapma çizgisi. Üçlü ayı sapma çizgisi. Yüksek hacmi gösteren mor ve mavi noktalar. Mor nokta, ortalama hacmin iki sapma üstünde hacmi gösterirken, mavi nokta iki sapmayı gösterir. Nasıl kullanılır? Trend çizg
TPSproTREND PrO MT5
Roman Podpora
4.74 (19)
TPSproTrend PRO, piyasanın yön değiştirdiği anı belirler ve hareketin başlangıcında bir giriş noktası oluşturur. Piyasaya, fiyat hareketi henüz yeni başladığı anda girersiniz, hareket gerçekleştikten sonra değil.   Gösterge       Sinyalleri yeniden çizmez ve giriş noktalarını, Zarar Durdurma ve Kar Al seviyelerini otomatik olarak göstererek alım satımı net, görsel ve yapılandırılmış hale getirir. RUSÇA TALİMATLAR   -   MT4 SÜRÜMÜ Başlıca avantajlar Yeniden çizim yapılmadan sinyaller.   Tüm sinya
Volatility Master for MetaTrader is a real-time dashboard tool that scans up to 56 symbols using up to 2 flexible dashboards on different charts to identify high-volatility, trending markets instantly. With clear bullish/bearish signals, customizable alerts, and a user-friendly interface, it helps you avoid range-bound conditions and focus on high-probability trades. Clarity leads to confidence. Trade confidently and protect your capital effectively with this powerful dashboard. Setup & Guide: 
Trend Forecaster
Alexey Minkov
5 (7)
The Trend Forecaster indicator utilizes a unique proprietary algorithm to determine entry points for a breakout trading strategy. The indicator identifies price clusters, analyzes price movement near levels, and provides a signal when the price breaks through a level. The Trend Forecaster indicator is suitable for all financial assets, including currencies (Forex), metals, stocks, indices, and cryptocurrencies. You can also adjust the indicator to work on any time frames, although it is recommen
Quantum Trend Sniper
Bogdan Ion Puscasu
4.74 (53)
Tanıtım       Kuantum Trend Keskin Nişancı Göstergesi   , trend tersine dönmeleri belirleme ve ticaret yapma şeklinizi değiştiren çığır açan MQL5 Göstergesi! 13 yılı aşkın ticaret tecrübesine sahip deneyimli tüccarlardan oluşan bir ekip tarafından geliştirilmiştir.       Kuantum Trend Keskin Nişancı Göstergesi       trend dönüşlerini son derece yüksek doğrulukla belirlemenin yenilikçi yolu ile ticaret yolculuğunuzu yeni zirvelere taşımak için tasarlanmıştır. ***Kuantum Trend Keskin Nişancı Göst
Advanced Supply Demand MT5
Bernhard Schweigert
4.5 (14)
Herhangi bir Acemi veya Uzman Tüccar için En İyi Çözüm! Bu gösterge benzersiz, yüksek kaliteli ve uygun fiyatlı bir ticaret aracıdır çünkü bir dizi tescilli özelliği ve yeni bir formülü bir araya getirdik. Bu güncelleme ile çift zaman dilimi dilimlerini gösterebileceksiniz. Yalnızca daha yüksek bir TF gösteremeyeceksiniz, aynı zamanda TF grafiğini ve ARTIK daha yüksek TF'yi de gösterebileceksiniz: YUVARLAK BÖLGELERİ GÖSTERMEK. Tüm Arz Talebi tüccarları buna bayılacak. :) Önemli Bilgiler Açıkland
Top indicator for MT5   providing accurate signals to enter a trade without repainting! It can be applied to any financial assets:   forex, cryptocurrencies, metals, stocks, indices .  Watch  the video  (6:22) with an example of processing only one signal that paid off the indicator! MT4 version is here It will provide pretty accurate trading signals and tell you when it's best to open a trade and close it. Most traders improve their trading results during the first trading week with the help of
Yazarın diğer ürünleri
Gm TrendSignal
Antonio Augusto Barreto De Melo
4.5 (4)
We often need to know the sudden change in trend that happens on the graph and this can be confirmed through indicators. This indicator shows the moments of trend reversal and how in which trend the price is shifting. Custom background, no need to configure the colors in the chart, just drag the indicator! Indication with arrows. - Blue arrow: Upward trend. - Pink Arrow: Downward Trend. NOTE: Free indicator, support may take a while to respond.
FREE
Gm Volumes
Antonio Augusto Barreto De Melo
4 (3)
A simple volume indicator according to the color of the candle! - Custom background! - Supports Volume by Ticks or Real Volume. The original Metatrader Volume indicator does not show the colors of the bar according to the color of the Candle, it only changes color when the volume of a candle is greater than the previous one, this sometimes creates confusion for beginners and does not know the real reason for the color change. Free indicator, support may take a while to respond!
FREE
Gm Vwap Point
Antonio Augusto Barreto De Melo
VWAP is an intraday calculation used primarily by algorithms and institutional traders to assess where a stock is trading in relation to its weighted average volume for the day. Day traders also use VWAP to assess market direction and filter out trading signals. This indicator is used to analyze and calculate the Vwap from a certain point on the graph, which is widely used to analyze the beginning of a movement of the price relationship with the volume. - Multi Vwaps on the same chart, placed
Gm Aggressive Volume
Antonio Augusto Barreto De Melo
5 (1)
Volume is a resource used by analysts of various methodologies, precisely because it shows the confirmation of movements and the market's progress. It is an indicator that analyzes the financial quantity that was traded during a certain period. This indicator analyzes the amount of volume for each candle, when there is an excessive increase in this, it differs from the others by a colored bar. In addition to informing in the form of colored bars, this indicator allows you to emit an audible w
Filtrele:
İnceleme yok
İncelemeye yanıt