Price Detect Volume
- Göstergeler
- Sürüm: 1.0
- Etkinleştirmeler: 5

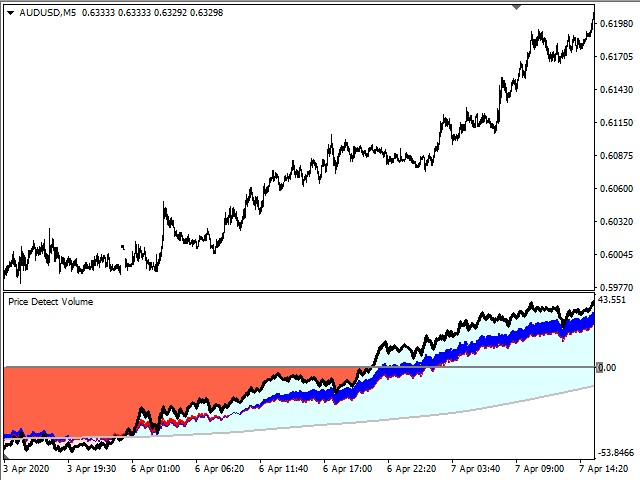
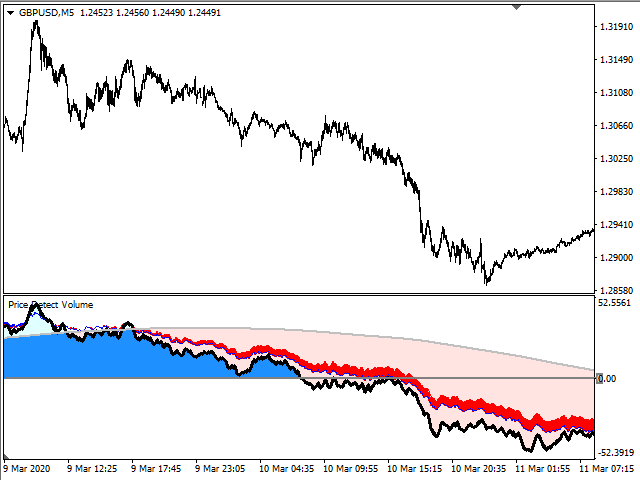
Определения текущей тенденции одна из самых важных задач трейдера не зависимо от стиля торговли. Индикатор Price Detect Volume поможет с достаточно высокой вероятностью это сделать.
Price Detect Volume - индикатор распознавания тенденции, использующий авторский алгоритм расчета, использующий объемы. Показания индикатора не изменяются не при каких условиях. Также с помощью индикатора можно наблюдать за коррекцией цены в сторону глобального тренда, определять возможные границы окончания отката. Рекомендуется совместное использование данного индикатора вместе с Price Detect https://www.mql5.com/ru/market/product/45682#!tab=tab_p_overview . Индикатор подходит для любой валютной пары, любого таймфрейма, рекомендую TF не выше H4.
Со всеми моими продуктами можно ознакомиться по ссылке https://www.mql5.com/ru/users/slavakucher/seller
Параметры индикатора
- Основные настройки (Main Settings):
- HistoryBars - количество баров для отображения.
- GlobalTrendPeriod - период для расчета значений глобальной тенденции.
- LocalTrendPeriod - период для расчета значений локальной тенденции.
- DeltaLines - дельта линий.
- SignalPeriod - период для расчета сигнальной линии.
- IndicatorID - название индикатора, и идентификатор для рисовки графики.
- Настройки отображения сигнального облака (Signal Ribbon Settings):
- ShowSignalRibbon - показывать гистограмму, или нет.
- SR_Style - стиль линии гистограммы.
- SR_Width - ширина линии гистограммы.
- SR_UP_Color - цвет гистограммы, когда сигнальная линия выше нуля.
- SR_DN_Color - цвет гистограммы, когда сигнальная линия ниже нуля.
- Настройки отображения глобального облака (Global Ribbon Settings):
- ShowGLobalRibbon - показывать гистограмму, или нет.
- GR_Style - стиль линии гистограммы.
- GR_Width - ширина линии гистограммы.
- GR_UP_Color - цвет гистограммы, когда быстрая линия выше медленной.
- GR_DN_Color - цвет гистограммы, когда быстрая линия ниже медленной.
- Настройки отображения локального облака (Local Ribbon Settings):
- ShowLocalRibbon - показывать гистограмму, или нет.
- LR_Style - стиль линии гистограммы.
- LR_Width - ширина линии гистограммы
- LR_UP_Color - цвет гистограммы, когда быстрая линия выше медленной.
- LR_DN_Color - цвет гистограммы, когда быстрая линия ниже медленной.