Volume Analysis Trader
- Göstergeler
- Sürüm: 1.1
- Güncellendi: 2 Aralık 2020
- Etkinleştirmeler: 20

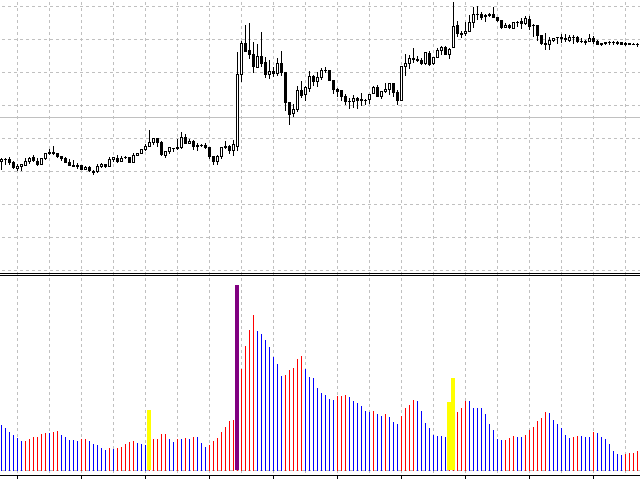
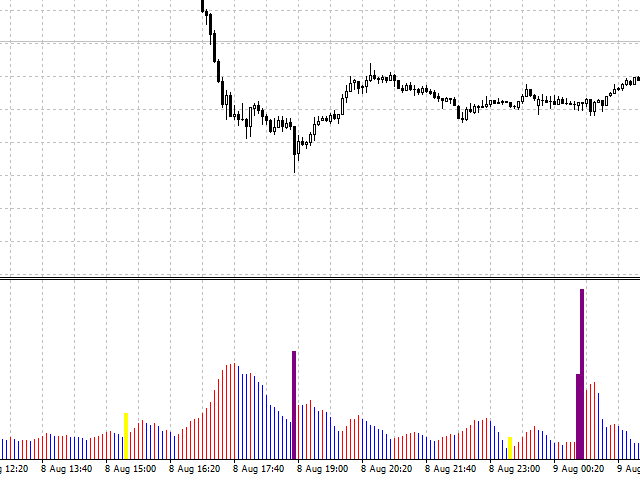
Volume Analysis Trader looks at volume using a fixed average of volume. This averaging helps spot when volume is rising or declining. Also I have added volume spikes which are when volume suddenly is above the average. These help spot market reversals.
This will hep a trader look for the following in their trading:
- Rising volume during a rally shows trend is strong. Falling volume on a rally shows trend is weakening.
As a rule of thumb on daily charts if current volume is higher than yesterday's volume the trend is likely to continue.
- A burst of extreme volume signals reversal. Think about it. Nobody likes holding a losing trade. Typically once you get out as its too painful the trend goes in your favor when its too late. Amateurs react like this at the same time hence the spike.
Features :
- An improved way of revealing what the volume is doing.
- Choose which averaging period you need.
- Choose your favorite colors for the volume and volume spike bars.
- Send alerts to either your PC, eMail or mobile device.
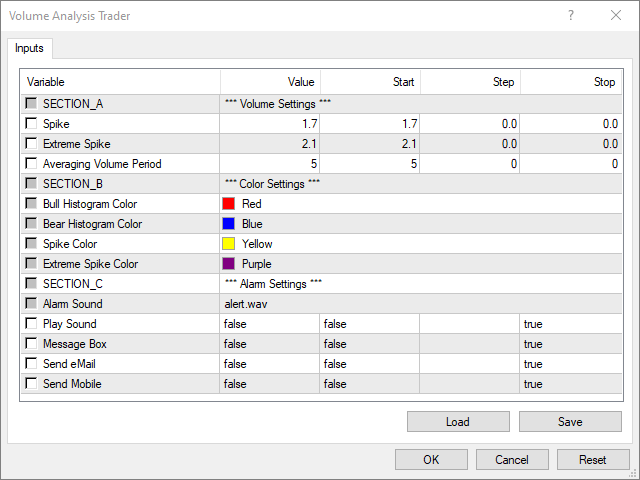
Settings :
Volume Settings
- Spike - Using decimals we choose how far we want our spike to be before sounding an alarm
- Extreme Spike - Using decimals we choose how far we want our extreme spike to be before sounding an alarm
- Averaging Volume Period - The averaging period of volume
Color Settings
- Bull Histogram Color - Sets color of bull histogram
- Bear Histogram Color - Sets color of bear histogram
- Extreme Spike Color - Sets color of extreme spike
- Spike Color - Sets color of spike
Kullanıcı değerlendirmeye herhangi bir yorum bırakmadı